MIR retrotransposon sequences provide insulators to the human genome
- PMID: 26216945
- PMCID: PMC4538669
- DOI: 10.1073/pnas.1507253112
MIR retrotransposon sequences provide insulators to the human genome
Abstract
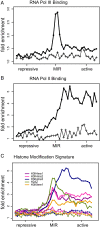
Insulators are regulatory elements that help to organize eukaryotic chromatin via enhancer-blocking and chromatin barrier activity. Although there are several examples of transposable element (TE)-derived insulators, the contribution of TEs to human insulators has not been systematically explored. Mammalian-wide interspersed repeats (MIRs) are a conserved family of TEs that have substantial regulatory capacity and share sequence characteristics with tRNA-related insulators. We sought to evaluate whether MIRs can serve as insulators in the human genome. We applied a bioinformatic screen using genome sequence and functional genomic data from CD4(+) T cells to identify a set of 1,178 predicted MIR insulators genome-wide. These predicted MIR insulators were computationally tested to serve as chromatin barriers and regulators of gene expression in CD4(+) T cells. The activity of predicted MIR insulators was experimentally validated using in vitro and in vivo enhancer-blocking assays. MIR insulators are enriched around genes of the T-cell receptor pathway and reside at T-cell-specific boundaries of repressive and active chromatin. A total of 58% of the MIR insulators predicted here show evidence of T-cell-specific chromatin barrier and gene regulatory activity. MIR insulators appear to be CCCTC-binding factor (CTCF) independent and show a distinct local chromatin environment with marked peaks for RNA Pol III and a number of histone modifications, suggesting that MIR insulators recruit transcriptional complexes and chromatin modifying enzymes in situ to help establish chromatin and regulatory domains in the human genome. The provisioning of insulators by MIRs across the human genome suggests a specific mechanism by which TE sequences can be used to modulate gene regulatory networks.
Keywords: chromatin; gene regulation; genomics; insulators; transposable elements.
Conflict of interest statement
The authors declare no conflict of interest.
Figures


Similar articles
-
The Idefix enhancer-blocking insulator also harbors barrier activity.Gene. 2010 Jan 15;450(1-2):25-31. doi: 10.1016/j.gene.2009.09.015. Gene. 2010. PMID: 19819312
-
A chromatin insulator-like element in the herpes simplex virus type 1 latency-associated transcript region binds CCCTC-binding factor and displays enhancer-blocking and silencing activities.J Virol. 2006 Mar;80(5):2358-68. doi: 10.1128/JVI.80.5.2358-2368.2006. J Virol. 2006. PMID: 16474142 Free PMC article.
-
Human tRNA genes function as chromatin insulators.EMBO J. 2012 Jan 18;31(2):330-50. doi: 10.1038/emboj.2011.406. Epub 2011 Nov 15. EMBO J. 2012. PMID: 22085927 Free PMC article.
-
Organizing the genome: enhancers and insulators.Biochem Cell Biol. 2005 Aug;83(4):516-24. doi: 10.1139/o05-054. Biochem Cell Biol. 2005. PMID: 16094455 Review.
-
Insulators are fundamental components of the eukaryotic genomes.Heredity (Edinb). 2005 Jun;94(6):571-6. doi: 10.1038/sj.hdy.6800669. Heredity (Edinb). 2005. PMID: 15815711 Review.
Cited by
-
Roles of transposable elements in the regulation of mammalian transcription.Nat Rev Mol Cell Biol. 2022 Jul;23(7):481-497. doi: 10.1038/s41580-022-00457-y. Epub 2022 Feb 28. Nat Rev Mol Cell Biol. 2022. PMID: 35228718 Free PMC article. Review.
-
Integrating transposable elements in the 3D genome.Mob DNA. 2020 Feb 4;11:8. doi: 10.1186/s13100-020-0202-3. eCollection 2020. Mob DNA. 2020. PMID: 32042316 Free PMC article.
-
Towards a predictive model of chromatin 3D organization.Semin Cell Dev Biol. 2016 Sep;57:24-30. doi: 10.1016/j.semcdb.2015.11.013. Epub 2015 Dec 3. Semin Cell Dev Biol. 2016. PMID: 26658098 Free PMC article. Review.
-
MIR retrotransposons link the epigenome and the transcriptome of coding genes in acute myeloid leukemia.Nat Commun. 2022 Oct 31;13(1):6524. doi: 10.1038/s41467-022-34211-x. Nat Commun. 2022. PMID: 36316347 Free PMC article.
-
Long Terminal Repeats: From Parasitic Elements to Building Blocks of the Transcriptional Regulatory Repertoire.Mol Cell. 2016 Jun 2;62(5):766-76. doi: 10.1016/j.molcel.2016.03.029. Mol Cell. 2016. PMID: 27259207 Free PMC article. Review.
References
-
- Gaszner M, Felsenfeld G. Insulators: Exploiting transcriptional and epigenetic mechanisms. Nat Rev Genet. 2006;7(9):703–713. - PubMed
-
- Valenzuela L, Kamakaka RT. Chromatin insulators. Annu Rev Genet. 2006;40:107–138. - PubMed
-
- Capelson M, Corces VG. Boundary elements and nuclear organization. Biol Cell. 2004;96(8):617–629. - PubMed
-
- Lunyak VV. Boundaries. Boundaries...Boundaries??? Curr Opin Cell Biol. 2008;20(3):281–287. - PubMed
-
- West AG, Gaszner M, Felsenfeld G. Insulators: Many functions, many mechanisms. Genes Dev. 2002;16(3):271–288. - PubMed
Publication types
MeSH terms
Substances
LinkOut - more resources
Full Text Sources
Other Literature Sources
Research Materials

