. 2015 Aug 4;12(5):760-73.
doi: 10.1016/j.celrep.2015.06.074. Epub 2015 Jul 23.

miR-302 Is Required for Timing of Neural Differentiation, Neural Tube Closure, and Embryonic Viability

Affiliations

miR-302 Is Required for Timing of Neural Differentiation, Neural Tube Closure, and Embryonic Viability

Ronald J Parchem et al. Cell Rep. .

Abstract

The evolutionarily conserved miR-302 family of microRNAs is expressed during early mammalian embryonic development. Here, we report that deletion of miR-302a-d in mice results in a fully penetrant late embryonic lethal phenotype. Knockout embryos have an anterior neural tube closure defect associated with a thickened neuroepithelium. The neuroepithelium shows increased progenitor proliferation, decreased cell death, and precocious neuronal differentiation. mRNA profiling at multiple time points during neurulation uncovers a complex pattern of changing targets over time. Overexpression of one of these targets, Fgf15, in the neuroepithelium of the chick embryo induces precocious neuronal differentiation. Compound mutants between mir-302 and the related mir-290 locus have a synthetic lethal phenotype prior to neurulation. Our results show that mir-302 helps regulate neurulation by suppressing neural progenitor expansion and precocious differentiation. Furthermore, these results uncover redundant roles for mir-290 and mir-302 early in development.


Figures

Figure 1
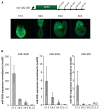
Figure 1. Expression of miR-302 during Embryonic Development
(A) Design of mir-302 reporter with GFP expression from targeted mir-302 locus. Reporter embryos show embryonic expression of mir-302-GFP at E7.5 and increased fluorescence in anterior neural structures from E8.5-E9.5. (B) qRT-PCR of miR-302b, miR-302c, and miR-367 expression relative to sno202 (n = 3) at various developmental time points. Samples for E7.5 were whole embryos (extra-embryonic tissues were removed); cranial neural tissue was isolated at other time points. Error bars represent SD.
Figure 2
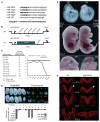
Figure 2. Deletion of mir-302 Leads to Failure of Cranial Neural Tube Closure
(A) Sequences of mature miRNAs produced from the miR-302-367 cluster with common seed sequence for miR-302 miRNAs in bold. The seed sequence for miR-302c is shifted by one nucleotide relative to the other family members. (B) Schematic showing design of knockout approach. EGFP coding sequence replaced the mir-302a-d hairpin sequences, leaving mir-367 and Larp7 sequences unaltered. (C) Number of knockout embryos recovered at indicated developmental stages. Graph of observed knockout frequency showing reduced recovery after E15.5. (D) Bright-field and fluorescent image of E7.5 litter from mir-302 heterozygous intercross. Individual embryos were genotyped and assayed for expression of miR-302a, miR-302b, miR-367, and sno202. Normalized expression is relative to wild-type embryo #3. (E) Bright-field images comparing wild-type and knockout embryos at indicated developmental stages. One hundred percent of mir-302-knockout embryos exhibited defects in mid/hindbrain closure at E9.5 (n = 42 mutants). (F) Transverse hindbrain sections of wild-type and knockout embryos with immunohistochemistry staining using a pan-cadherin antibody at indicated developmental stages. Arrows indicate area of dorsolateral bending.
Figure 3
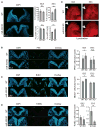
Figure 3. Increased Thickness of Neuroepithelium in mir-302-Knockout Embryos
(A) Transverse sections through wild-type and mutant embryonic hindbrain at E9.5 stained for DAPI to enable counting of nuclei (n = 3 embryos, six sections per embryo). Quantification at E8.5 and E9.5. Error bars represent SD. *p < 0.05, **p < 0.005. The scale bar represents 100 μm. (B) Immunohistochemistry against PH3 to visualize cells in M phase of the cell cycle. Quantification of PH3-positive cells was calculated as the percentage of PH3-positive cells out of total (DAPI+) neuroepithelial cells at indicated developmental stages. Error bars represent SD (n = 3 embryos, six sections per embryo). *p < 0.05, **p < 0.005. The scale bar represents 50 μm. (C) BrdU incorporation analysis after 2 hr pulse. Quantification of BrdU-positive cells was calculated as the percentage of BrdU-positive cells out of total neuroepithelial cells at indicated developmental stages. Error bars represent SD (n = 3 embryos, six sections per embryo). *p < 0.05, **p < 0.005. The scale bar represents 50 μm. (D) TUNEL assay was used to identify apoptotic cells in transverse sections of presumptive hindbrain. Quantification of TUNEL-positive cells was calculated as the percentage of TUNEL-positive cells out of total neuroepithelial cells at indicated developmental stages. Error bars represent SD (n = 3 embryos, six sections per embryo). *p < 0.05, **p < 0.005. The scale bar represents 100 μm. (E) LysoTracker staining labels dead cells. White arrows point to comparable regions of mutant and wild-type embryos. A qualitative decrease in LysoTracker staining was observed at E9.5 (n = 3). Differences in staining were less pronounced at E8.5 between wild-type and knockout.
Figure 4
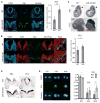
Figure 4. Precocious Neural Differentiation in mir-302-Knockout Embryos
(A) Tuj1 immunohistochemistry to visualize β-III-tubulin+ post-mitotic neural cells. Quantification of Tuj1+ cells was calculated as the percentage of Tuj1+ cells out of total neuroepithelial cells (DAPI+) at E9.5. Error bars represent SD (n = 3 embryos, six sections/embryo). *p < 0.05, **p < 0.005. The scale bar represents 200 μm. (B) Immunohistochemistry against Ki67 was used to identify cycling cells, and Tuj1 was used to identify neurons. Quantification of Ki67+ cells was calculated as the percentage of Ki67+ cells out of total neuroepithelial cells at E9.5. Error bars represent SD (n = 3 embryos, six sections per embryo). *p < 0.05, **p < 0.005. Increased Ki67+ staining and increased Tuj1+ staining in the knockout is due to a greater number of Ki67+ cells that are also Tuj1+. The scale bar represents 100 μm. (C) In situ hybridization using probe against Btg2 to identify neurogenic dividing cells. (D) In situ hybridization using probe against Hes5 to identify neural progenitors. Transverse sections of embryonic hindbrain counterstained with Fast Red. (E) Individual neuroepithelial cells were plated at clonal density, incubated for 24 hr, fixed, then stained for Tuj1. Pairs of cells that were generated from a single precursor were scored for three possible division types. Quantification represents the average of >150 cells per embryo and genotype (n = 3 embryos). *p < 0.05, **p < 0.005.
Figure 5
Figure 5. Identification of miR-302 Targets
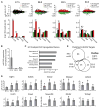
(A) Microarray analysis of wild-type and knockout embryos at E7.5, E8.0, E8.5, and E9.5. Significantly upregulated transcripts are shown as red diamonds, downregulated transcripts as green squares, and unchanged transcripts as black circles (adjusted p value < 0.05, p < 0.1 for E7.5) (n = 3 embryos at each developmental time point). Analysis of seed matches in the promoter, 5′UTR, ORF, and 3′UTR of downregulated and upregulated transcripts. Data are presented as the mean number of seeds matches per kilobase of sequence for the listed groups of altered genes described in (A). p values calculated by the Wilcoxon rank sum test and Bonferroni corrected are shown for p < 0.01. *p < 0.05, **p < 0.005. (B) qRT-PCR of miR-293 expression relative to sno202 (n = 3) at various developmental time points. Samples for E7.5 were whole embryos; at other time points, cranial neural tissue (i.e., neuroepithelium/neural tube) was isolated. Error bars represent SD. (C) Gene Ontology analysis of upregulated genes in knockout embryos at E9.5 reveals enrichment for neural development-related terms. (D) qRT-PCR of ten predicted targets that were upregulated in microarray analysis. Expression was normalized to Rpl7 (n = 3 embryos for each genotype and developmental stage). *p < 0.05. (E) Venn diagram showing the overlap of genes that are upregulated at E8.0, E8.5, and E9.5. Fgf15 and Ednrb were the only two genes upregulated across all time points.
Figure 6
Figure 6. Fgf15 Promotes Neural Differentiation and Is a Direct Target of miR-302
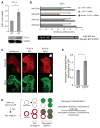
(A) Western blot assaying levels of FGF15 in wild-type versus knockout brain at E11.5. Quantification represents average expression relative to wild-type (n = 3). *p < 0.05. (B) Luciferase reporter assay verifying miRNA-mediated translational repression of Fgf15. Luciferase activity in cells transfected with reporters expressing either wild-type or mutant UTRs with or without co-transfection of indicated miRNAs normalized to transfection with control miRNA (mock) (n = 3 technical replicates). *p < 0.05. Schematic of Fgf15 mRNA with miR-302 binding site indicated in the 3′ UTR. (C) Whole-mount immunohistochemistry against GAG and Elavl2 in chicken embryos 72 hr post-infection of the neuroepithelium. (D) Pair analysis was performed on cranial neuroepithelium 72 hr after infection. Pairs were grouped into GAG-positive and GAG-negative to compare neural differentiation associated with viral overexpression of Fgf15 or GFP. Neurogenic division ratio is calculated as the ratio of divisions giving rise to neurogenic (Elavl2+) progeny versus non-neurogenic progeny in GAG+ versus GAG− divisions (n = 3 embryos). (E) Average neurogenic potential ratio of Fgf15 and GFP infected neural cells (n = 3 embryos). *p < 0.05.
Figure 7
Figure 7. mir-290 and mir-302 Are Functionally Redundant
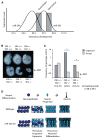
(A) Schematic summary of embryonic expression of mir-290 and mir-302 showing an overlapping expression pattern during early development. (B) Bright-field images of embryos recovered at E9.5 with genotypes listed. Loss of three alleles corresponding to mir-290 and mir-302 results in early embryonic death and severe phenotypic embryos. (C) Recovery of mir-302 knockout embryos at E9.5 is lost when one or two alleles of mir-290 are deleted. Expected number of recovered embryos indicated relative to expected. *p < 0.05. (D) Schematic summary of the mir-302 phenotype.

Similar articles

Cited by

References

    1. Abbott AL, Alvarez-Saavedra E, Miska EA, Lau NC, Bartel DP, Horvitz HR, Ambros V. The let-7 MicroRNA family members mir-48, mir-84, and mir-241 function together to regulate developmental timing in Caenorhabditis elegans. Dev Cell. 2005;9:403–414. - PMC - PubMed
    1. Alvarez-Saavedra E, Horvitz HR. Many families of C. elegans microRNAs are not essential for development or viability. Curr Biol. 2010;20:367–373. - PMC - PubMed
    1. Bartel DP. MicroRNAs: target recognition and regulatory functions. Cell. 2009;136:215–233. - PMC - PubMed
    1. Bernstein E, Kim SY, Carmell MA, Murchison EP, Alcorn H, Li MZ, Mills AA, Elledge SJ, Anderson KV, Hannon GJ. Dicer is essential for mouse development. Nat Genet. 2003;35:215–217. - PubMed
    1. Borello U, Cobos I, Long JE, McWhirter JR, Murre C, Rubenstein JL. FGF15 promotes neurogenesis and opposes FGF8 function during neocortical development. Neural Dev. 2008;3:17. - PMC - PubMed

Publication types

Associated data