. 2015 Jul 24:6:7743.
doi: 10.1038/ncomms8743.

MEG3 long noncoding RNA regulates the TGF-β pathway genes through formation of RNA-DNA triplex structures

Affiliations

MEG3 long noncoding RNA regulates the TGF-β pathway genes through formation of RNA-DNA triplex structures

Tanmoy Mondal et al. Nat Commun. .

Erratum in

Abstract

Long noncoding RNAs (lncRNAs) regulate gene expression by association with chromatin, but how they target chromatin remains poorly understood. We have used chromatin RNA immunoprecipitation-coupled high-throughput sequencing to identify 276 lncRNAs enriched in repressive chromatin from breast cancer cells. Using one of the chromatin-interacting lncRNAs, MEG3, we explore the mechanisms by which lncRNAs target chromatin. Here we show that MEG3 and EZH2 share common target genes, including the TGF-β pathway genes. Genome-wide mapping of MEG3 binding sites reveals that MEG3 modulates the activity of TGF-β genes by binding to distal regulatory elements. MEG3 binding sites have GA-rich sequences, which guide MEG3 to the chromatin through RNA-DNA triplex formation. We have found that RNA-DNA triplex structures are widespread and are present over the MEG3 binding sites associated with the TGF-β pathway genes. Our findings suggest that RNA-DNA triplex formation could be a general characteristic of target gene recognition by the chromatin-interacting lncRNAs.


Figures
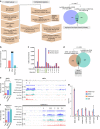
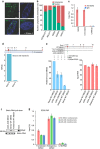
Figure 1
Figure 1. Identification of repressive chromatin-associated lncRNAs using ChRIP-seq.
(a) The ChRIP-seq analysis pipeline used to identify lncRNAs enriched in repressive chromatin. The pie chart shows 276 lncRNAs enriched in both EZH2 and H3K27me3 ChRIP-seq samples compared with the nuclear RNA (input). The P value was obtained by performing a hypergeometric test using all the lncRNAs in our analysis. (b) Bar diagram showing the distribution of T-to-C transitions (indicative of putative RNA–protein contact sites) in input (8,361), EZH2 (18,905) and H3K27me3 (2,651) ChRIP-seq data. Black in the EZH2 bar indicates the number of T-to-C transitions (1,253) that are either present in input or H3K27me3 samples, and blue indicates EZH2-specific T-to-C transitions (17,652). The EZH2-specific T-to-C transitions (17,652) were used to associate with lncRNAs. (c) All the possible conversions present in the EZH2 ChRIP-seq sample. T-to-C conversion and the reverse-strand A-to-G conversions were predominant among all the possible conversion events. (d) LncRNAs (1,046; annotated and non-annotated) harbour EZH2-specific (17,652) T-to-C conversion site. Seventy repressive chromatin-enriched lncRNAs (out of 276) carry T-to-C transitions, including known PRC2-interacting lncRNAs such as MEG3, KCNQ1OT1 and BDNF-AS1. The P value was obtained by performing a hypergeometric test using all the lncRNAs considered in our analysis. (e,f) The distribution of the sequencing reads on MEG3 and KCNQ1OT1 transcripts from H3K27me3, EZH2-enriched chromatin fractions and input RNA samples. The tags represent the read distribution and the signal represents the intensity of reads over MEG3 and KCNQ1OT1 transcripts. Locations of T-to-C transitions over the exons are depicted below the physical maps. The left panel depicts the RPKM (Reads per kilobase per million) for MEG3 and KCNQ1OT1 in H3K27me3, EZH2 ChRIP RNA and input RNA samples. The fold enrichment (FC) in H3K27me3 and EZH2 ChRIP RNA compared with input is indicated. (g) ChRIP validation: RT–qPCR data showing the enrichment of the selected annotated and non-annotated lncRNAs in the EZH2 and H3K27me3 ChRIP pull-downs compared with input. We did not observe any enrichment of these lncRNAs in the H3K4me2 (active chromatin marks) and immunoglobulin G (IgG; nonspecific antibody) ChRIP pull-downs. Actin was used as a negative control. Data represent the mean±s.d. of three independent biological experiments.
Figure 2
Figure 2. Molecular characterization of MEG3 and PRC2 interaction.
(a) RNA-fluorescence in situ hybridization showing the distribution of the MEG3 signal (green) in the nucleus (blue, stained with 4,6-diamidino-2-phenylindole). An RNase A-treated sample was used as a negative control. Scale bar, 1 μm. (b) RT–qPCR data showing the distribution of lncRNAs and protein-coding RNAs in the nuclear and cytoplasmic fractions (±s.d., n=3). (c) RT–qPCR analysis of MEG3, KCNQ1OT1 and U1SnRNA in EZH2 RIP-purified RNA from BT-549 cells. U1SnRNA served as negative control. The enrichment is plotted as percentage of input (±s.d., n=3). (d) Physical map of the MEG3 containing numbered exons showing two T-to-C transitions. The exons in red are constitutively expressed and blue are alternatively spliced exons. First conversion is part of exon 3 showing higher expression, whereas the second conversion is part of exon 4 showing low expression in the nuclear RNA sequencing. (e) In vitro interaction of MEG3 and PRC2. The schematic indicates the exons of the WT MEG3 clone. Left: RT–qPCR showing enrichment of sense WT MEG3 and MEG3 carrying deletions (Δ340-348 or Δ345-348 MEG3) in in vitro RNA binding assays. Reaction with antisense WT MEG3 or without purified PRC2 served as negative controls. The binding efficiency of MEG3 deletions were presented relative to WT MEG3 (±s.d., n=3). Right: RT–qPCR showing the quantification of input RNAs. (f) Upper panel: western blot showing EZH2 levels after pull-down with biotinylated sense WT MEG3, antisense WT MEG3, and Δ345-348 MEG3 RNAs incubated with nuclear extract. This is a representative data set from several experiments. Lower panel: agarose gel picture showing input biotin-RNA. (g) RT–qPCR result showing the relative enrichment of WT MEG3, Δ340-348 and Δ345-348 MEG3 RNAs in the EZH2-RIP, performed after BT-549 cells were transfected with WT and mutant MEG3 plasmids. Data were normalized to the input RNAs and plotted as percentage of input (±s.d., n=3). To distinguish the endogenous MEG3 from the ectopically expressed MEG3, we designed RT–qPCRs primers, with one primer mapped to the transcribed portion of the vector and the other to MEG3 RNA. Endogenous MEG3 served as positive control and U1SnRNA as negative control.
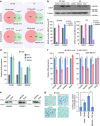
Figure 3
Figure 3. MEG3/EZH2 functional interaction regulates TGF-β pathway genes.
(a–c) MEG3 and EZH2 share common gene targets. (a) Venn diagram showing the number of genes deregulated after downregulation of MEG3 and EZH2 using siRNA in BT-549 and HF cells, and the degree of overlap between the MEG3- and EZH2-dependent genes. The P values were obtained by hypergeometric test using all protein-coding genes as a background. (b) EZH2 protein levels, as determined by western blotting, following EZH2 and MEG3 downregulation in BT-549 and HF cells. Tubulin was used as a loading control. (c) RT–qPCR analysis of EZH2 and MEG3 mRNA expression in Ctrlsi, EZH2si and MEG3si transfected BT-549 and HF cells (±s.d., n=3). (d) RT–qPCR analysis of TGFB2, TGFBR1 and SMAD2 gene expression in Ctrlsi, MEG3si and EZH2si transfected BT-549 cells (±s.d., n=3). (e) Immunoblot showing SMAD2, TGFBR1 and tubulin protein levels following transfection of BT-549 cells with Ctrlsi and MEG3si. (f) Bar graph showing RT–qPCR analysis of TGFB2, TGFBR1 and SMAD2 mRNA levels after overexpression of MEG3 (pREP4MEG3) in BT-549 and MDA-MB-231 cells. The levels in pREP4MEG3 are presented relative to CtrlpREP4 (±s.d., n=3). EZH2 was used as a control showing no change in expression after overexpression of MEG3. The P values were calculated using Student's t-test (two-tailed, two-sample unequal variance), *P<0.05. (g) Downregulation of MEG3 influences the invasive property of BT-549 cells through regulation of the TGF-β pathway. Images showing Matrigel invasion of the BT-549 cells. The two images in the upper panel show invasion of BT-549 cells infected with Ctrlsh lentivirus, and Ctrlsh infection followed by incubation with TGF-β2 ligand (Ctrlsh-TGFB2). The images in the bottom panel show the cells infected with MEG3Sh and MEG3sh infection followed by incubation with TGF-β inhibitor (MEG3sh+TGF-βin). Scale bar, 10 μm. The bar graph shows quantification (±s.d., n=3) of the matrix invaded cells in MEG3sh relative to the Ctrlsh. The P values were calculated using Student's t-test (two-tailed, two-sample unequal variance), *P<0.05, **P<0.01.
Figure 4
Figure 4. Genome-wide mapping of MEG3 lncRNA binding sites.
(a) RT–qPCR analysis showing specific enrichment (presented as percentage of input) of MEG3 but not MALAT1 RNA in the ChOP pull-down assay with MEG3 antisense probes. The ChOP pull-down with GFP antisense oligo, used as a negative control, did not show any enrichment of MEG3 and MALAT1 RNAs. (b) Genomic tracks showing ChOP-seq (MEG3, GFP and input) and ChIP-seq (H3K4me1) intensities, visualized in log scale. The MEG3 binding site is located upstream of the TGFBR1 gene (falls within the intron of the COL15A1 gene) and it overlaps with H3K4me1 peaks in BT-549 cells. (c) ChIP–qPCR showing enrichment of H3K27me3 chromatin marks, presented as percentage of input, over the MEG3 peaks associated with the TGF-β genes in Ctrlsh and MEG3sh cells (±s.d., n=3). (d) Schematic outline of the TGFBR1 gene showing MEG3 peaks and the location of 3C primers (P1–P9), as indicated by arrows. EcoRI restriction sites are shown as blue vertical lines. Each error bar represents ±s.d. from three experiments. Looping events between the upstream MEG3 binding site (corresponding to P2 primer) and the TGFBR1 promoter detected by 3C–qPCR in Ctrlsh and MEG3sh cells. The P values were calculated using Student's t-test (two-tailed, two-sample unequal variance), *P<0.05.
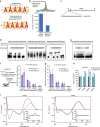
Figure 5
Figure 5. MEG3 lncRNA regulates its target genes through triplex structure formation.
(a) Predicted GA-rich motifs enriched in all MEG3 peaks and peaks associated with deregulated genes using MEME-ChIP. (b) Number of TrTS over the MEG3 peak summits and neighbouring regions, predicted by Triplexator. (c) The schematic shows the MEG3 TFO used in the triplex assays. The exons are colour-coded as described before. (d) Electrophoretic mobility shift assay. End-labelled dsDNA oligos (sequences provided in the schematic with gene name) were incubated alone (lane 1) or with increasing concentrations of MEG3 ssRNA TFO (lanes 2 and 3: shift indicated with arrow) or with increasing concentrations of control ssRNA oligo (lanes 8 and 9). dsDNA oligos were incubated with MEG3 TFO and treated with either RNase A (lane 4) or RNase H (lane 5). dsDNA oligos were incubated with MEG3 ssRNA TFO in the presence of either unlabelled specific competitor (lane 6) or nonspecific competitor (lane 7). (e) TGFBR1-associated MEG3 peak sequence and its mutated version (the changed nucleotides are in red) were incubated alone (lanes 1 and 7) or with MEG3 TFO. Arrow indicates complex formation. (f,g) Enrichment of MEG3 peak sequences using biotin- and psoralen-labelled MEG3 TFO. RNase H-treated lysates were used to capture the labelled MEG3 TFO using streptavidin beads. The enrichment of MEG3 peaks is presented as the ratio between MEG3 TFO and control oligo (±s.d., n=3). (h) RT–qPCR analysis of gene expression in BT-549 cells transfected with either MEG3 TFO or control RNA oligo. Expression in MEG3 TFO presented relative to the control oligo (±s.d., n=3). *P<0.05, Student's t-test (two-tailed, two-sample unequal variance). (i) Left panel: CD spectra of a 1:1 mixture of TGFB2 dsDNA and MEG3 TFO (ssRNA) are shown in black, and TGFB2 dsDNA and the control ssRNA are shown in red. Right panel: the sum of the individual CD spectra for TGFB2 dsDNA and MEG3 TFO (ssRNA) is shown in black, and the sum of the individual CD spectra for TGFB2 dsDNA and the control ssRNA is shown in red. Inset in the left and right panel shows the difference between the two spectra.
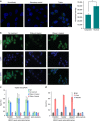
Figure 6
Figure 6. RNA–DNA triplexes are present in vivo.
(a) Confocal microscopic images showing immunostaining with anti-triplex dA.2rU antibody (green) in BT-549 cells. The nucleus is stained with DAPI (4,6-diamidino-2-phenylindole; blue). Immunostaining with no antibody and secondary antibody were used as negative controls. Scale bar, 5 μm. The graph to the right shows quantification of the triplex signal in cytoplasm and nuclear compartments obtained from the three-dimensional confocal images. The graph represents the average of cytoplasmic and nuclear signals from >50 cells in several microscopic fields. The error bars indicate s.e.m. The P value was calculated using Student's t-test **P<0.01. (b) RNA–DNA triplex structures are sensitive to RNase A but are resistant to RNase H in vivo. Top panel: immunofluorescent staining of BT-549 cells with anti-triplex dA.2rU antibody (green) with no treatment (left), pretreated with RNase A (centre), or pretreated with RNase H (right) as indicated. Middle panel: cells were counterstained with DAPI (blue). Bottom panel: overlay of the triplex signals with DAPI staining. Scale bar, 5 μm. (c) Triplex-ChIP–qPCR showing enrichment (presented as percentage of input) of triplex structures over the MEG3 peaks associated with the TGF-β pathway genes (TGFBR1, TGFB2 and SMAD2) in BT-549 cells (±s.d., n=3). Actin was used as a negative control. Chromatin was pretreated with RNase A or RNase H before ChIP. Immunoglobulin G (IgG) was used as an antibody control. (d) Triplex-ChIP–qPCR showing enrichment (presented as percentage of input) of triplex structures over the MEG3 peaks associated with the TGF-β pathway genes (TGFBR1, TGFB2 and SMAD2) in Ctrlsh and MEG3sh BT-549 cells (±s.d., n=3). IgG was used as an antibody control.
Figure 7
Figure 7. Chromatin-binding sequences and PRC2-binding sequences of MEG3 lncRNA are functionally distinct.
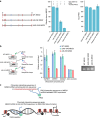
(a) MEG3-PRC2 in vitro binding assay. Left panel: schematic representation of WT MEG3, Δ46-56MEG3 and Δ345-348MEG3. Green and red boxes indicate PRC2- and chromatin-interacting sequences, respectively. Middle panel: bar diagram showing the relative binding efficiency (as determined by RT–qPCR) of the sense WT MEG3, Δ46-56 MEG3 and Δ345-348 MEG3 RNAs in an in vitro PRC2-binding assay. Binding assays with no PRC2 and antisense WT MEG3 served as negative controls. The PRC2-binding efficiency of sense WT MEG3 was set to 100, and the binding efficiency of the MEG3 mutants is presented relative to WT MEG3 (±s.d., n=3). Right panel: RT–qPCR showing the quantification of the input sense WT MEG3, MEG3 deletions (Δ340-348 or Δ345-348 MEG3) and antisense WT MEG3 RNAs. (b) Deletion of MEG3 TFO leads to loss of chromatin interaction. Left panel: schematic display of interaction of the WT MEG3 and MEG3 mutants (Δ46-56MEG3 and Δ345-348MEG3) with the MEG3 peak sequences in vivo. Red (MEG3 TFO) and green (PRC2-interacting region) colour-coded regions indicate the location of the deleted MEG3 RNA sequences 46-56 and 345-348, respectively. Biotin-labelled WT MEG3 or MEG3 mutants were used to transfect BT-549 cells followed by crosslinking with formaldehyde. RNAse H-treated cell lysates were incubated with streptavidin beads to capture the MEG3 RNA-associated DNA. Middle panel: qPCR data are presented as the ratio of captured DNA in WT MEG3 or MEG3 mutants to captured non-biotinylated MEG3 RNA (±s.d., n=3). Right panel: agarose gel picture showing the quality of the biotin-labelled WT and mutant MEG3 RNAs (500 ng of each biotin-RNA was loaded). (c) Model depicting how chromatin-interacting sequences of MEG3 lncRNA-containing GA-rich sequences form RNA–DNA triplex with the GA-rich DNA sequences to guide MEG3 lncRNA to chromatin. PRC2-interacting sequences of MEG3 lncRNA facilitate recruitment of the PRC2 to distal regulatory elements, thereby establishing H3K27me3 marks to modulate gene expression.

Similar articles

Cited by

References

    1. Kretz M. et al. Control of somatic tissue differentiation by the long non-coding RNA TINCR. Nature 493, 231–235 (2013). - PMC - PubMed
    1. Klattenhoff C. A. et al. Braveheart, a long noncoding RNA required for cardiovascular lineage commitment. Cell 152, 570–583 (2013). - PMC - PubMed
    1. Cesana M. et al. A long noncoding RNA controls muscle differentiation by functioning as a competing endogenous RNA. Cell 147, 358–369 (2011). - PMC - PubMed
    1. Mohammad F., Mondal T., Guseva N., Pandey G. K. & Kanduri C. Kcnq1ot1 noncoding RNA mediates transcriptional gene silencing by interacting with Dnmt1. Development 137, 2493–2499 (2010). - PubMed
    1. Sun L. et al. Long noncoding RNAs regulate adipogenesis. Proc. Natl Acad. Sci. USA 110, 3387–3392 (2013). - PMC - PubMed

Publication types

MeSH terms