. 2015 Jul 23:4:e07004.
doi: 10.7554/eLife.07004.

MicroRNA-203 represses selection and expansion of oncogenic Hras transformed tumor initiating cells

Affiliations

MicroRNA-203 represses selection and expansion of oncogenic Hras transformed tumor initiating cells

Kent Riemondy et al. Elife. .

Abstract

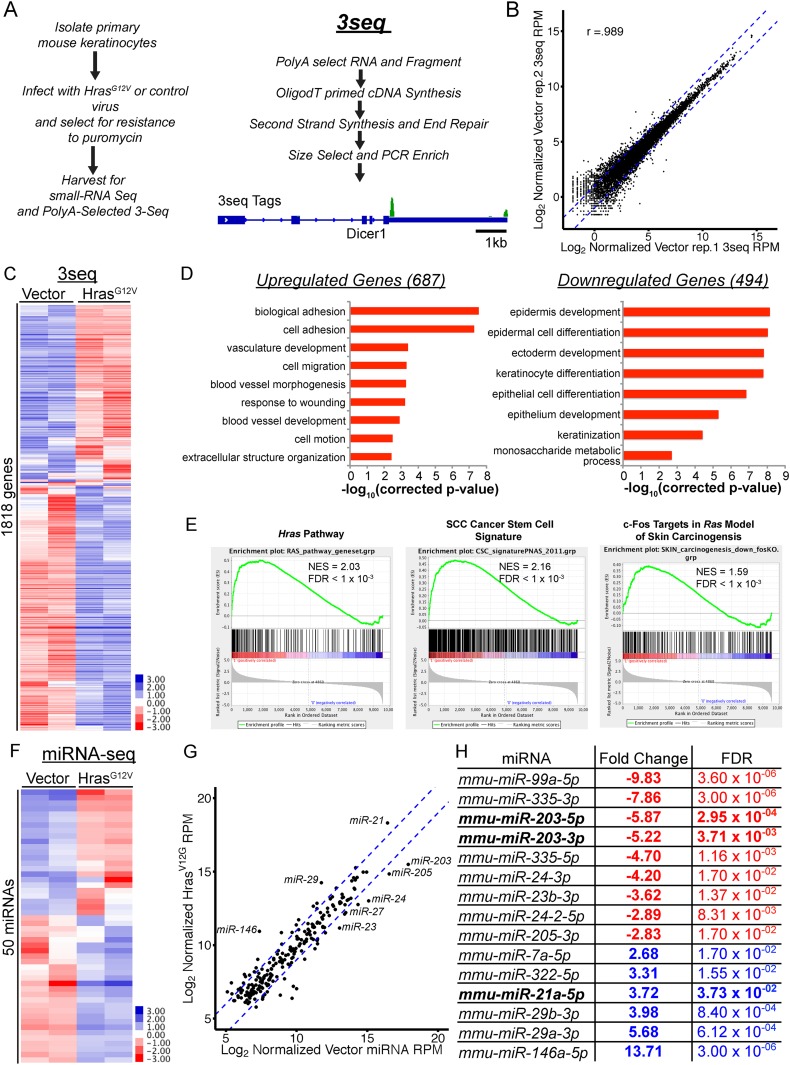
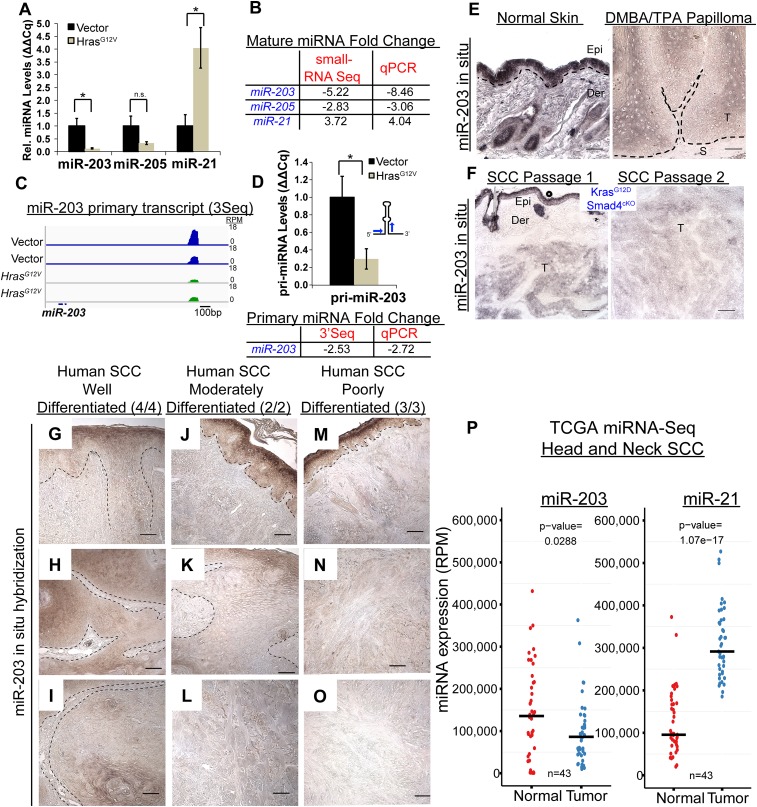
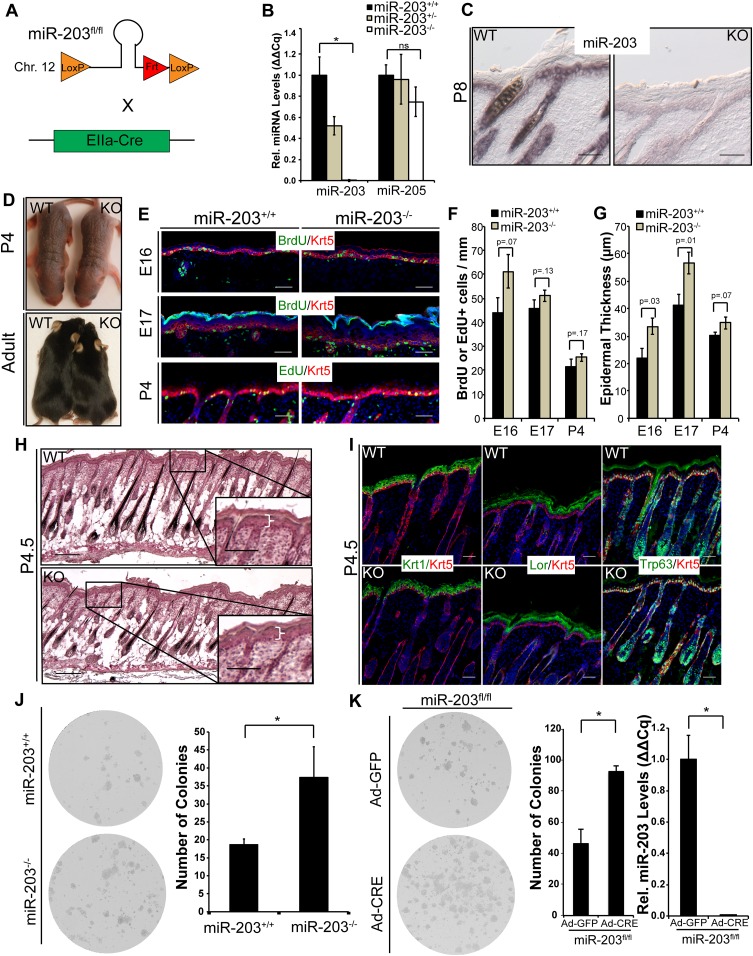
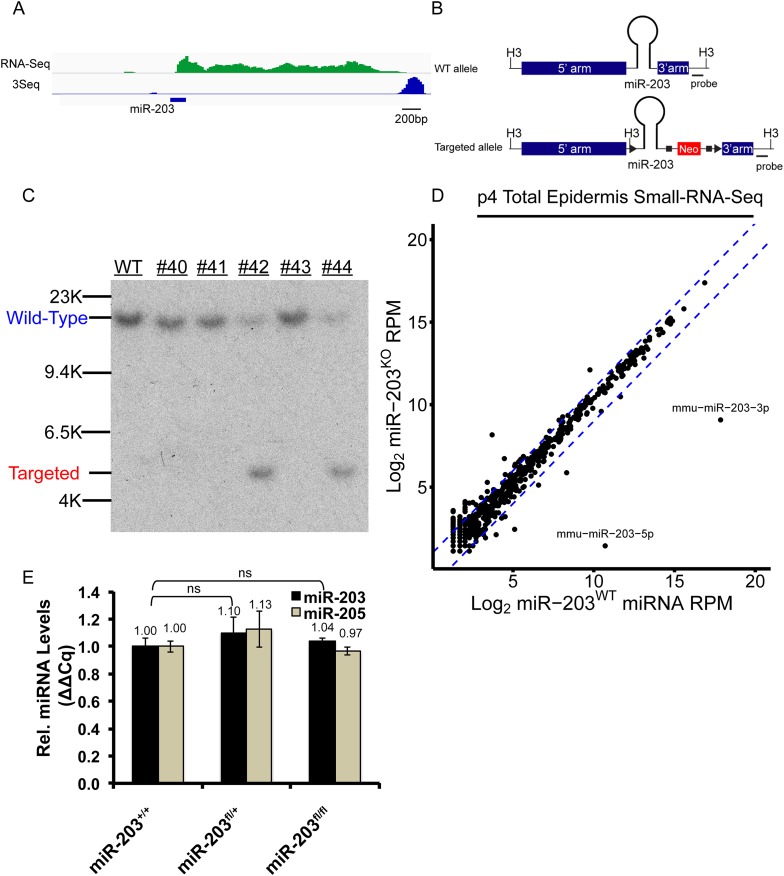
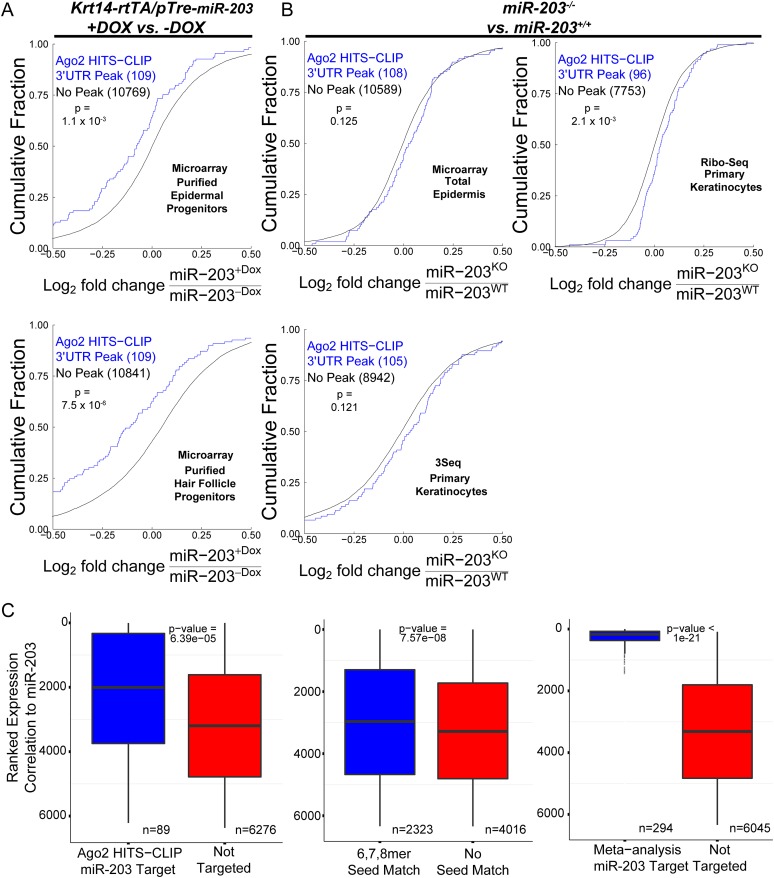
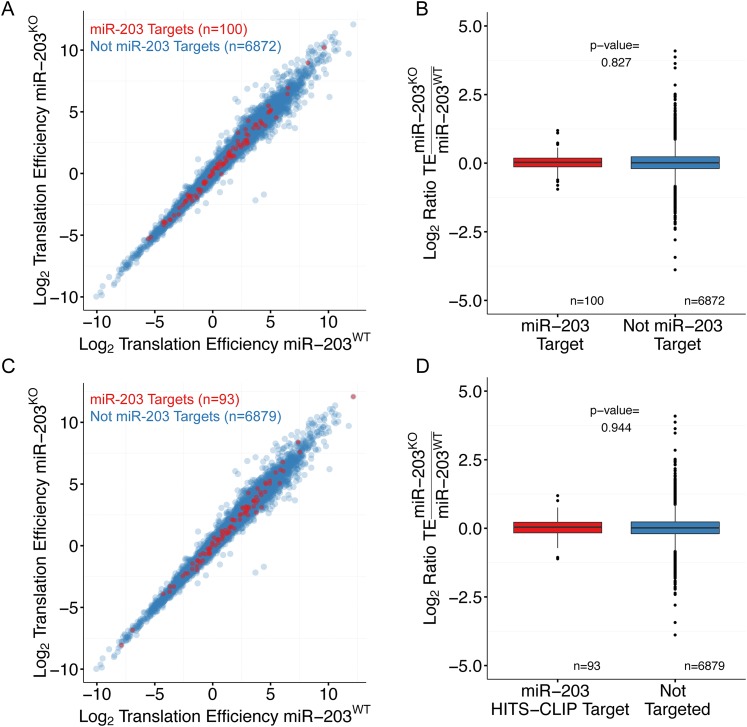
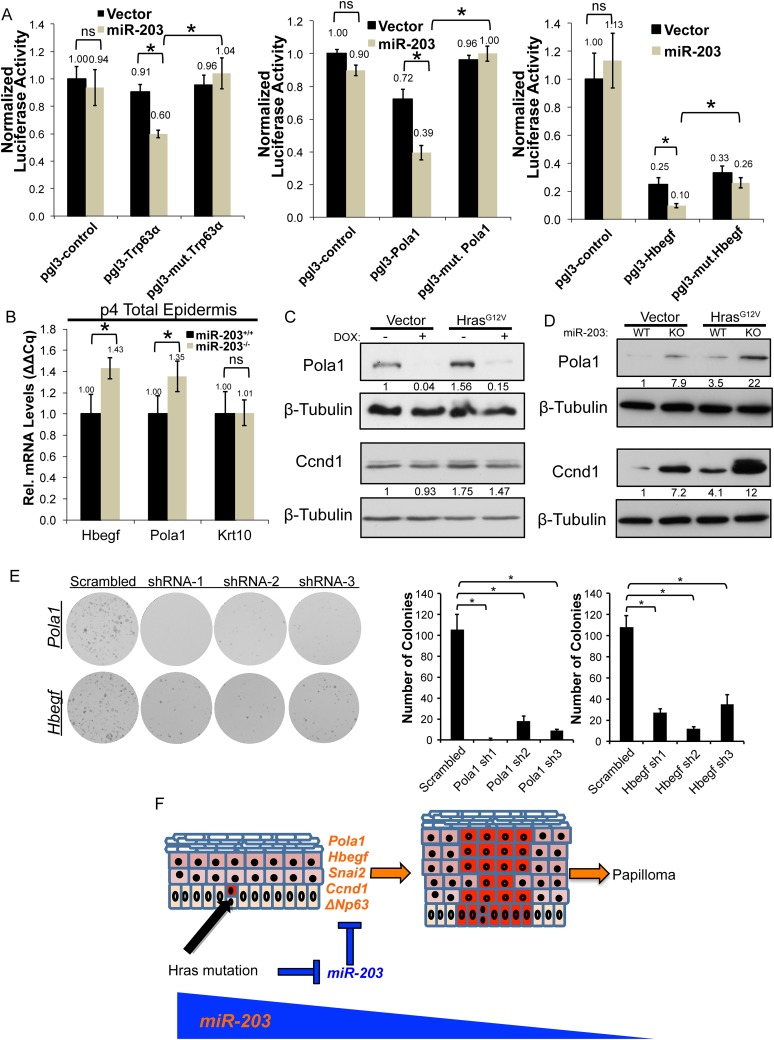
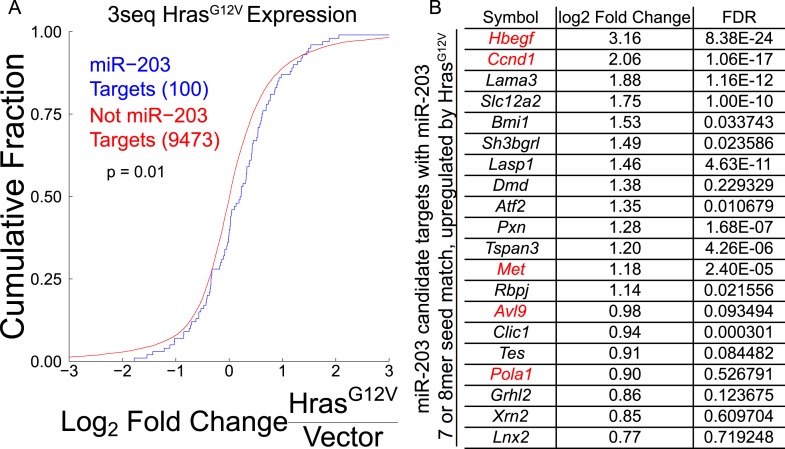
In many mouse models of skin cancer, only a few tumors typically form even though many cells competent for tumorigenesis receive the same oncogenic stimuli. These observations suggest an active selection process for tumor-initiating cells. Here, we use quantitative mRNA- and miR-Seq to determine the impact of Hras(G12V) on the transcriptome of keratinocytes. We discover that microRNA-203 is downregulated by Hras(G12V). Using a knockout mouse model, we demonstrate that loss of microRNA-203 promotes selection and expansion of tumor-initiating cells. Conversely, restoration of microRNA-203 using an inducible model potently inhibits proliferation of these cells. We comprehensively identify microRNA-203 targets required for Hras-initiated tumorigenesis. These targets include critical regulators of the Ras pathway and essential genes required for cell division. This study establishes a role for the loss of microRNA-203 in promoting selection and expansion of Hras mutated cells and identifies a mechanism through which microRNA-203 antagonizes Hras-mediated tumorigenesis.

Keywords: Hras; developmental biology; human biology; medicine; microRNA; mouse; skin cancer; stem cells; tumor suppressor.


Conflict of interest statement

The authors declare that no competing interests exist.

Figures

Figure 1.
Figure 1.. Genome-wide profiling of the oncogenic HrasG12V-transformed miRNA and mRNA transcriptome in primary keratinocytes.
(A) Schematic of experimental approach to identify deregulated mRNA and miRNA networks driven by oncogenic HrasG12V using small-RNA Seq and 3Seq. The 3seq library preparation allows quantitative definition of poly-A+ RNA 3′ends and expression levels. (B) 3Seq reproducibly detects mRNA expression levels over 4 orders of magnitude. Pearson correlation coefficient displayed (C) unsupervised hierarchical clustering of log-transformed mean-centered mRNA expression levels for all transcripts deregulated twofold by oncogenic HrasG12V (n = 2 libraries per condition) (D) Gene Ontology analysis of transcripts up and downregulated by HrasG12V (twofold change FDR <0.05) indicates enrichment for migratory and angiogenic processes, and suppression of keratinocyte differentiation. (E) GSEA analysis of selected genesets relevant to skin carcinogenesis. (F) Unsupervised hierarchical clustering of log-transformed mean-centered miRNA expression levels for all transcripts deregulated twofold by oncogenic HrasG12V (n = 2 libraries per condition) (G, H) Abundant miRNAs such as miR-203, miR-205, and miR-21 are strongly deregulated by oncogenic Ras. DOI: http://dx.doi.org/10.7554/eLife.07004.003
Figure 2.
Figure 2.. miR-203 is strongly suppressed in mouse and human SCCs.
(A, B) qPCR and small-RNA-Seq independently validate downregulation of miR-203 and upregulation of miR-21 driven by oncogenic HrasG12V (n = 3 biological rep. qPCR, n = 2 small-RNA-Seq, mean ± SEM displayed, *p < 0.05, Student's t-test two-sided). (C) Gene track and quantification the 3′end of the miR-203 primary transcript based on 3Seq. (D) miR-203 primary transcript detection by qPCR (n = 3 biological replicates, Mean ± SEM displayed, *p < 0.05, ns = non-significant, Student's t-test two-sided). (E) miR-203 is downregulated in DMBA/TPA produced papillomas compared to normal adjacent tissue. Epi = epidermis, Der = dermis, T = tumor, and S = stroma. The black lines denote the epidermal/dermal and tumor/stroma boundary (F) miR-203 is downregulated in malignant SCCs derived from KrasG12D/Smad4cKO and passaged in immunocompromised mice. (GO) Reduced miR-203 expression is correlated with increasing malignancy in human skin SCC cancers. Panels G, J, M were taken from regions with more histologically normal regions to demonstrate successful miR-203 hybridization. (P) miRNA-Seq quantification from patient matched normal and tumor tissue obtained from the TCGA consortium data (bar indicates mean value, Student's t-test two-sided). Scale bar = 50 μm. DOI: http://dx.doi.org/10.7554/eLife.07004.005
Figure 3.
Figure 3.. Loss of miR-203 modestly impairs embryonic epidermal development.
(A) Schematic of miR-203 conditional allele generation and knockout strategy. (B) Validation of miR-203 ablation by qPCR from isolated epidermal samples (n = 3 biological replicates, * p < 0.05, ns = non-significant, Student's t-test two-sided). (C) Validation of miR-203 ablation within the epidermis by in situ hybridization (Scale bar = 50 μm). (D) miR-203 knockout mice are visibly indistinguishable from wild-type counterparts. (EG) miR-203 ablation results in mild epidermal hyperplasia during embryonic development. (n = 3 E16, n = 4 E17, and n = 3 p4 animals, p-value provided in figure, Student's t-test one-sided). (H) Representative hematotoxylin and eosin image from p4.5 animals, demonstrating restored normal skin morphology in neonatal animals. (Scale bars = 50 μm for inset and 100 μm for main images) (I) Epidermal differentiation is not compromised by loss of miR-203. (Scale bars = 50 μm) (J) miR-203−/− primary keratinocytes are more clonogenic than wild-type counterparts (representative results from 3 experiments, *p < 0.05, Student's t-test two-sided). (K) Conditional ablation of miR-203 from passaged miR-203fl/fl keratinocytes results in higher clonogenicity (representative results from n = 3 independent experiments, mean ± standard deviation displayed, *p < 0.05, Student's t-test, two-sided). DOI: http://dx.doi.org/10.7554/eLife.07004.006
Figure 3—figure supplement 1.
Figure 3—figure supplement 1.. Generation of a miR-203 conditional knockout mouse.
(A) RNA-Seq and 3Seq detection of the miR-203 primary transcript (B) Schematic of the miR-203 conditional allele. H3 = HindIII (C) Southern blot confirmation of founder miR-203 conditional knockout mice (D) Small-RNA-seq confirmation of miR-203 loss. Blue lines indicate twofold change (E) qPCR quantification of miR-203 and miR-205, demonstrating that the miR-203floxed allele does not alter microRNA levels. Error bars represent S.E.M from reactions performed from n = 2 mice in technical triplicate, ns = non-significant. DOI: http://dx.doi.org/10.7554/eLife.07004.007
Figure 3—figure supplement 2.
Figure 3—figure supplement 2.. miR-203 expression in diverse mouse tissues.
qPCR detection of mature miR-203 in various adult mouse organ tissues. Error bars represent S.E.M from reactions performed in technical duplicate. DOI: http://dx.doi.org/10.7554/eLife.07004.008
Figure 4.
Figure 4.. Loss of miR-203 sensitizes mice to DMBA/TPA skin carcinogenesis.
(A) Representative images of tumors that were formed in the skin of WT and miR-203 null mice treated with DMBA/TPA. (B) miR-203−/− mice have a larger tumor burden than miR-203+/+ counterparts (n = 6 and 7 miR-203+/+ and miR-203−/− animals respectively, mean ± SEM displayed, £ = p < 0.05, Whitney–Mann U-test one-sided). (C) miR-203−/− tumor size distribution is similar to wild-type animals (ns = non-significant, Student's t-test two sided, median displayed as bar). (D, E) miR-203+/+ and miR-203−/− papillomas display similar morphologies and histology. (F) Proliferation and differentiation dynamics are similar between miR-203+/+ and miR-203−/− tumors. (Scale bars = 50 μm). DOI: http://dx.doi.org/10.7554/eLife.07004.009
Figure 4—figure supplement 1.
Figure 4—figure supplement 1.. The HrasQ61L mutation is common in both miR-203+/+ and miR-203−/− tumors.
(A) Representative end-point PCR followed by XbaI digestion. The HrasQ61L allele produces 120 bp and 87 bp product, whereas wild-type produces a 207-bp product (B) Table with quantification of genotyping results. non-significant p > 0.05, chi-squared test. DOI: http://dx.doi.org/10.7554/eLife.07004.010
Figure 5.
Figure 5.. miR-203 antagonizes HrasG12V-driven keratinocyte proliferation.
(A) HrasG12V transduced miR-203−/− primary cultures are more colonogenic upon serial passage than wild-type controls (representative of n = 2 independent experiments, mean ± standard deviation displayed. *p < 0.05, ns = non-significant, Student's t-test two-sided). (B) qPCR of miR-203 induction upon addition of doxycycline in vector and HrasG12V transduced cells (mean ± SEM displayed, n = 3 biological replicates). (C) Restoration of miR-203 using a doxycycline-inducible transgene results in suppression of colony formation ability in HrasG12V transduced and control keratinocytes. miR-203 was induced with doxycycline (5 μg/ml) 24 hr after plating (representative of n = 3 independent experiments, mean ± standard deviation displayed, *p ≤ 0.05, , ns = non-significant). (D) miR-203 restoration suppresses HrasG12V-driven S-Phase entry. miR-203 was induced for 24 hr prior to harvesting for flow cytometry. (n = 3, mean ± standard deviation displayed, *p ≤ 0.05). DOI: http://dx.doi.org/10.7554/eLife.07004.011
Figure 6.
Figure 6.. Comprehensive identification of miR-203 targets using genome-wide expression analyses and Ago2 HITS-CLIP.
(A) Schematic of genome-wide expression profiling data sets used in meta-analysis to identify bono-fide miR-203 targets. (B) Genes upregulated in all three miR-203 loss-of-function data sets (786 genes, no fold-change or p-value cut-off) were compared to genes downregulated in both miR-203 gain-of-function data sets (1704 genes, no fold-change or p-value cut-off) to identify a subset of genes with a strong inverse correlation to miR-203 expression (294 genes) of which 100 genes contained miR-203 7mer or 8mer seed sequence matches in their 3′UTRs. (C) Table demonstrating top 20 genes identified in meta-analysis ranked by negative-correlation to miR-203 expression. Genes colored in red contain 3′ UTR miR-203 7 or 8mer seed matches. (D) De novo motif searching identified an 8mer miR-203 seed motif, complementary to the miR-203 seed sequence enriched in the 3′UTR of candidate miR-203 target genes identified in the meta-analysis (294 genes). Table demonstrating enrichment for 7 or 8mer seed matches in the 3′UTR of candidate miR-203 target genes (294) over the background seed distribution in primary keratinocytes, which is not seen for randomly selected 294 genes expressed in primary keratinocytes or a negative control gene set of genes upregulated in miR-203 gain-of-function and downregulated miR-203 loss-of-function (353 genes). (E) Schematic of Ago2 HITS-CLIP and the identified miR-203 seed motif. (F) Diagram of genes detected by expression meta-analysis and Ago2-HITS-CLIP. Table of 21 high confidence miR-203 targets identified through expression meta-analysis and that have Ago2-HITS-CLIP 3′UTR peaks with miR-203 seed matches. DOI: http://dx.doi.org/10.7554/eLife.07004.012
Figure 6—figure supplement 1.
Figure 6—figure supplement 1.. Transcripts containing 3′UTR miR-203 seed matches are regulated by miR-203.
(A) Genes containing miR-203 seed matches are more likely to be downregulated upon miR-203 overexpression or (B) upregulated upon miR-203 ablation (panel B) (p-value <0.05 for comparison of 8mer match to no-match, K–S test, one-sided). (C) Transcripts are ranked based upon aggregate fold-changes consistent with miR-203 regulation to produce a ranked expression correlation metric. Transcripts with 7 or 8mer miR-203 seed matches are more likely to be regulated by miR-203 modulation. (p < 0.05) (see ‘Materials and methods’). DOI: http://dx.doi.org/10.7554/eLife.07004.015
Figure 6—figure supplement 2.
Figure 6—figure supplement 2.. Ago2-HITS-CLIP in primary keratinocytes.
(A) Example autoradiogram of isolated Ago2-RNA complexes, red box indicates region excised for sequencing. (B) Proportion of miRNAs detected by Ago2-HITS-CLIP. (C) Number of 3′UTR Ago2 peak containing seed sequences from miRNA families accounting for 90% of all miRNAs in p4 epidermis. (D) Genome-wide distribution of Ago2 peaks and reads. (E) Comparison of miRNAs detected by Ago2-HITS-CLIP and small-RNA-Seq. DOI: http://dx.doi.org/10.7554/eLife.07004.016
Figure 6—figure supplement 3.
Figure 6—figure supplement 3.. Ago2 HITS-CLIP 3′UTR peaks are enriched in keratinocyte miRNA seed matches, including miR-203.
(A) Position of miRNA seed matches for miRNAs highly expressed in total epidermal samples. The peak summit represents nucleotide position 0 (B) De novo motif searching identifies the most enriched 8mer motifs in 3′UTR peaks. DOI: http://dx.doi.org/10.7554/eLife.07004.017
Figure 6—figure supplement 4.
Figure 6—figure supplement 4.. Predicted miR-203 targets based on HITS-CLIP are regulated by miR-203.
(A) Cumulative distributions of miR-203 targets or not targeted transcripts based on HITS-CLIP in miR-203 overexpression data sets. (B) Cumulative distributions of miR-203 targets or not targeted transcripts based on HITS-CLIP in miR-203 knockout data sets (C) Ranked analysis of miR-203 targets detected by HITS-CLIP, based on 6, 7, 8mer seed only, or through meta-analysis (p value displayed on plots). DOI: http://dx.doi.org/10.7554/eLife.07004.018
Figure 6—figure supplement 5.
Figure 6—figure supplement 5.. miR-203 targets do not display translation efficiency changes upon miR-203 ablation.
(A) Comparison of translation efficiency for miR-203 targets (red) and non-targeted transcripts (blue) identified by expression meta-analysis. (B) Quantification of the change in translation efficiency in miR-203 KO samples for miR-203 targets identified by expression meta-analysis. (C) Comparison of translation efficiency for miR-203 targets identified by Ago2-HITS-CLIP (red) and non-targeted transcripts (blue). (D) Quantification of the change in translation efficiency in miR-203 KO samples for miR-203 targets based on Ago2-HITS-CLIP. DOI: http://dx.doi.org/10.7554/eLife.07004.019
Figure 7.
Figure 7.. Hbegf and Pola1 are direct miR-203 target genes critical for keratinocyte proliferation.
(A) 3′UTR luciferase reporter assays demonstrate that miR-203 directly targets Trp63 (positive control), Pola1, and Hbegf in keratinocytes (representative of n = 3 independent experiments, mean ± propagated standard deviation displayed, *p < 0.05, ns = non-significant, Student's t-test two-sided) (B) Hbegf and Pola1 are upregulated in miR-203−/− isolated epidermis (p4) (n = 8 and n = 10, miR-203+/+ and miR-203−/− animals respectively, mean ± SEM displayed, *p < 0.05). (C, D) Western blots from lysates with miR-203 overexpression (48 hr) or miR-203 ablation. (E) shRNA knockdown of Hbegf or Pola1 impairs keratinocyte colony formation ability (representative of n = 3 independent experiments, *p <0.05, mean ± standard deviation displayed). (F) Model for the mechanism of miR-203 in restricting Hras-initiated tumorigenesis. DOI: http://dx.doi.org/10.7554/eLife.07004.020
Figure 7—figure supplement 1.
Figure 7—figure supplement 1.. A subset of miR-203 targets are upregulated by HrasG12V.
(A) miR-203 target genes identified through meta-analysis containing miR-203 seed matches are more likely to be upregulated upon HrasG12V expression in primary keratinocytes than non-targeted transcripts (p-value ≤0.05, K–S test one-sided). (B) Top 20 miR-203 targets, based on expression meta-analysis, ranked by upregulation by HrasG12V, genes shown in red are also identified by Ago2-HITS-CLIP. DOI: http://dx.doi.org/10.7554/eLife.07004.021
Figure 7—figure supplement 2.
Figure 7—figure supplement 2.. Hbegf and Pola1 are required for keratinocyte growth potential in HrasG12V-transformed miR-203+/+ and miR-203−/− cultures.
(A) Colony formation assays of established miR-203+/+ cultures stably infected with pbabe-HrasG12V-neo, followed by Pola1 and Hbegf knockdown. (B) Colony formation assays of established miR-203+/+ cultures stably infected with pbabe-HrasG12V-neo, followed by Pola1 and Hbegf knockdown. (p-value determined by ANOVA with Tukey HSD correction, n = 3 wells per experiment). DOI: http://dx.doi.org/10.7554/eLife.07004.022

Similar articles

Cited by

References

    1. Abel EL, Angel JM, Kiguchi K, DiGiovanni J. Multi-stage chemical carcinogenesis in mouse skin: fundamentals and applications. Nature Protocols. 2009;4:1350–1362. doi: 10.1038/nprot.2009.120. - DOI - PMC - PubMed
    1. Agrawal N, Frederick MJ, Pickering CR, Bettegowda C, Chang K, Li RJ, Fakhry C, Xie TX, Zhang J, Wang J, Zhang N, El-Naggar AK, Jasser SA, Weinstein JN, Treviño L, Drummond JA, Muzny DM, Wu Y, Wood LD, Hruban RH, Westra WH, Koch WM, Califano JA, Gibbs RA, Sidransky D, Vogelstein B, Velculescu VE, Papadopoulos N, Wheeler DA, Kinzler KW, Myers JN. Exome sequencing of head and neck squamous cell carcinoma reveals inactivating mutations in NOTCH1. Science. 2011;333:1154–1157. doi: 10.1126/science.1206923. - DOI - PMC - PubMed
    1. Bartel DP. MicroRNAs: target recognition and regulatory functions. Cell. 2009;136:215–233. doi: 10.1016/j.cell.2009.01.002. - DOI - PMC - PubMed
    1. Beck B, Blanpain C. Unravelling cancer stem cell potential. Nature Reviews. Cancer. 2013;13:727–738. doi: 10.1038/nrc3597. - DOI - PubMed
    1. Benaich N, Woodhouse S, Goldie SJ, Mishra A, Quist SR, Watt FM. Rewiring of an epithelial differentiation factor, miR-203, to inhibit human squamous cell carcinoma metastasis. Cell Reports. 2014;9:104–117. doi: 10.1016/j.celrep.2014.08.062. - DOI - PMC - PubMed

Publication types