Human NK cell repertoire diversity reflects immune experience and correlates with viral susceptibility
- PMID: 26203083
- PMCID: PMC4547537
- DOI: 10.1126/scitranslmed.aac5722
Human NK cell repertoire diversity reflects immune experience and correlates with viral susceptibility
Abstract
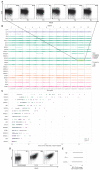
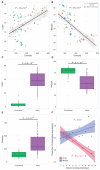
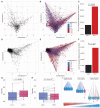
Innate natural killer (NK) cells are diverse at the single-cell level because of variegated expressions of activating and inhibitory receptors, yet the developmental roots and functional consequences of this diversity remain unknown. Because NK cells are critical for antiviral and antitumor responses, a better understanding of their diversity could lead to an improved ability to harness them therapeutically. We found that NK diversity is lower at birth than in adults. During an antiviral response to either HIV-1 or West Nile virus, NK diversity increases, resulting in terminal differentiation and cytokine production at the cost of cell division and degranulation. In African women matched for HIV-1 exposure risk, high NK diversity is associated with increased risk of HIV-1 acquisition. Existing diversity may therefore decrease the flexibility of the antiviral response. Collectively, the data reveal that human NK diversity is a previously undefined metric of immune history and function that may be clinically useful in forecasting the outcomes of infection and malignancy.
Copyright © 2015, American Association for the Advancement of Science.
Figures


Comment in
-
The downside of human natural killer cell diversity in viral infection revealed by mass cytometry.Ann Transl Med. 2016 Dec;4(24):546. doi: 10.21037/atm.2016.12.02. Ann Transl Med. 2016. PMID: 28149907 Free PMC article. No abstract available.
Similar articles
-
NK cell function in HIV-1 infection.Curr Mol Med. 2006 Sep;6(6):621-9. doi: 10.2174/156652406778195035. Curr Mol Med. 2006. PMID: 17022732 Review.
-
HIV escape from natural killer cytotoxicity: nef inhibits NKp44L expression on CD4+ T cells.AIDS. 2009 Jun 1;23(9):1077-87. doi: 10.1097/QAD.0b013e32832cb26b. AIDS. 2009. PMID: 19424050
-
Natural killer cells, dendritic cells, and the alarmin high-mobility group box 1 protein: a dangerous trio in HIV-1 infection?Curr Opin HIV AIDS. 2011 Sep;6(5):364-72. doi: 10.1097/COH.0b013e328349b089. Curr Opin HIV AIDS. 2011. PMID: 21825870 Review.
-
Virologically suppressed HIV patients show activation of NK cells and persistent innate immune activation.J Immunol. 2012 Aug 1;189(3):1491-9. doi: 10.4049/jimmunol.1200458. Epub 2012 Jun 27. J Immunol. 2012. PMID: 22745371
-
Natural killer cell responses to dendritic cells infected by the ANRS HIV-1 vaccine candidate, MVAHIV.Vaccine. 2014 Sep 29;32(43):5577-84. doi: 10.1016/j.vaccine.2014.07.094. Epub 2014 Aug 13. Vaccine. 2014. PMID: 25131736
Cited by
-
Natural killer cell responses to emerging viruses of zoonotic origin.Curr Opin Virol. 2020 Oct;44:97-111. doi: 10.1016/j.coviro.2020.07.003. Epub 2020 Aug 9. Curr Opin Virol. 2020. PMID: 32784125 Free PMC article. Review.
-
Increased Proinflammatory Responses of Monocytes and Plasmacytoid Dendritic Cells to Influenza A Virus Infection During Pregnancy.J Infect Dis. 2016 Dec 1;214(11):1666-1671. doi: 10.1093/infdis/jiw448. Epub 2016 Sep 21. J Infect Dis. 2016. PMID: 27655870 Free PMC article.
-
Age-related alterations in immune responses to West Nile virus infection.Clin Exp Immunol. 2017 Jan;187(1):26-34. doi: 10.1111/cei.12863. Epub 2016 Oct 17. Clin Exp Immunol. 2017. PMID: 27612657 Free PMC article. Review.
-
Immune monitoring using mass cytometry and related high-dimensional imaging approaches.Nat Rev Rheumatol. 2020 Feb;16(2):87-99. doi: 10.1038/s41584-019-0338-z. Epub 2019 Dec 31. Nat Rev Rheumatol. 2020. PMID: 31892734 Free PMC article. Review.
-
Differential Induction of IFN-α and Modulation of CD112 and CD54 Expression Govern the Magnitude of NK Cell IFN-γ Response to Influenza A Viruses.J Immunol. 2018 Oct 1;201(7):2117-2131. doi: 10.4049/jimmunol.1800161. Epub 2018 Aug 24. J Immunol. 2018. PMID: 30143589 Free PMC article.
References
-
- Rechavi Ea., Lev A, Lee YN, Simon AJ, Yinon Y, Lipitz S, Amariglio N, Weisz B, Notarangelo LD, Somech R. Timely and spatially regulated maturation of B and T cell repertoire during human fetal development. Sci. Transl. Med. 2015;7:276ra25. - PubMed
-
- Garderet L, Dulphy N, Douay C, Chalumeau N, Schaeffer V, Zilber M-T, Lim A, Even J, Mooney N, Gelin C, Gluckman E, Charron D, Toubert A. The umbilical cord blood αβ T-cell repertoire: Characteristics of a polyclonal and naive but completely formed repertoire. Blood. 1998;91:340–346. - PubMed
-
- Shiokawa S, Mortari F, Lima JO, Nuñez C, Bertrand FE, III, Kirkham PM, Zhu S, Dasanayake AP, Schroeder HW. IgM heavy chain complementarity-determining region 3 diversity is constrained by genetic and somatic mechanisms until two months after birth. J. Immunol. 1999;162:6060–6070. - PubMed
-
- Schroeder HW, Jr., Zhang L, Philips JB., III Slow, programmed maturation of the immunoglobulin HCDR3 repertoire during the third trimester of fetal life. Blood. 2001;98:2745–2751. - PubMed
-
- Horowitz A, Strauss-Albee DM, Leipold M, Kubo J, Nemat-Gorgani N, Dogan OC, Dekker CL, Mackey S, Maecker H, Swan GE, Davis MM, Norman PJ, Guethlein LA, Desai M, Parham P, Blish CA. Genetic and environmental determinants of human NK cell diversity revealed by mass cytometry. Sci. Transl. Med. 2013;5:208ra145. - PMC - PubMed
Publication types
MeSH terms
Substances
Grants and funding
LinkOut - more resources
Full Text Sources
Other Literature Sources

