Distinct brain transcriptome profiles in C9orf72-associated and sporadic ALS
- PMID: 26192745
- PMCID: PMC4830686
- DOI: 10.1038/nn.4065
Distinct brain transcriptome profiles in C9orf72-associated and sporadic ALS
Abstract
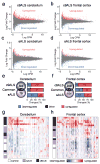
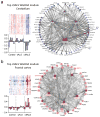
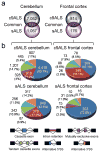
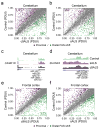
Increasing evidence suggests that defective RNA processing contributes to the development of amyotrophic lateral sclerosis (ALS). This may be especially true for ALS caused by a repeat expansion in C9orf72 (c9ALS), in which the accumulation of RNA foci and dipeptide-repeat proteins are expected to modify RNA metabolism. We report extensive alternative splicing (AS) and alternative polyadenylation (APA) defects in the cerebellum of c9ALS subjects (8,224 AS and 1,437 APA), including changes in ALS-associated genes (for example, ATXN2 and FUS), and in subjects with sporadic ALS (sALS; 2,229 AS and 716 APA). Furthermore, heterogeneous nuclear ribonucleoprotein H (hnRNPH) and other RNA-binding proteins are predicted to be potential regulators of cassette exon AS events in both c9ALS and sALS. Co-expression and gene-association network analyses of gene expression and AS data revealed divergent pathways associated with c9ALS and sALS.
Figures

Comment in
-
The RNAs of ALS.Nat Neurosci. 2015 Aug;18(8):1066. doi: 10.1038/nn0815-1066. Nat Neurosci. 2015. PMID: 26216462 No abstract available.
-
Motor neuron disease: Brain transcriptome profiling reveals involvement of divergent pathways in C9orf72-associated and sporadic ALS.Nat Rev Neurol. 2015 Sep;11(9):484. doi: 10.1038/nrneurol.2015.141. Epub 2015 Aug 4. Nat Rev Neurol. 2015. PMID: 26240037 No abstract available.
Similar articles
-
Motor neuron disease: Brain transcriptome profiling reveals involvement of divergent pathways in C9orf72-associated and sporadic ALS.Nat Rev Neurol. 2015 Sep;11(9):484. doi: 10.1038/nrneurol.2015.141. Epub 2015 Aug 4. Nat Rev Neurol. 2015. PMID: 26240037 No abstract available.
-
Conserved DNA methylation combined with differential frontal cortex and cerebellar expression distinguishes C9orf72-associated and sporadic ALS, and implicates SERPINA1 in disease.Acta Neuropathol. 2017 Nov;134(5):715-728. doi: 10.1007/s00401-017-1760-4. Epub 2017 Aug 14. Acta Neuropathol. 2017. PMID: 28808785 Free PMC article.
-
The RNAs of ALS.Nat Neurosci. 2015 Aug;18(8):1066. doi: 10.1038/nn0815-1066. Nat Neurosci. 2015. PMID: 26216462 No abstract available.
-
Unconventional features of C9ORF72 expanded repeat in amyotrophic lateral sclerosis and frontotemporal lobar degeneration.Neurobiol Aging. 2014 Oct;35(10):2421.e1-2421.e12. doi: 10.1016/j.neurobiolaging.2014.04.015. Epub 2014 Apr 19. Neurobiol Aging. 2014. PMID: 24836899 Review.
-
Dissection of genetic factors associated with amyotrophic lateral sclerosis.Exp Neurol. 2014 Dec;262 Pt B:91-101. doi: 10.1016/j.expneurol.2014.04.013. Epub 2014 Apr 26. Exp Neurol. 2014. PMID: 24780888 Review.
Cited by
-
Chronic endoplasmic reticulum stress in myotonic dystrophy type 2 promotes autoimmunity via mitochondrial DNA release.Nat Commun. 2024 Feb 20;15(1):1534. doi: 10.1038/s41467-024-45535-1. Nat Commun. 2024. PMID: 38378748 Free PMC article.
-
Widespread intron retention impairs protein homeostasis in C9orf72 ALS brains.Genome Res. 2020 Dec;30(12):1705-1715. doi: 10.1101/gr.265298.120. Epub 2020 Oct 14. Genome Res. 2020. PMID: 33055097 Free PMC article.
-
The Emerging Role of DNA Damage in the Pathogenesis of the C9orf72 Repeat Expansion in Amyotrophic Lateral Sclerosis.Int J Mol Sci. 2018 Oct 12;19(10):3137. doi: 10.3390/ijms19103137. Int J Mol Sci. 2018. PMID: 30322030 Free PMC article. Review.
-
Towards Understanding the Relationship Between ER Stress and Unfolded Protein Response in Amyotrophic Lateral Sclerosis.Front Aging Neurosci. 2022 Jun 15;14:892518. doi: 10.3389/fnagi.2022.892518. eCollection 2022. Front Aging Neurosci. 2022. PMID: 35783140 Free PMC article. Review.
-
Human ALS/FTD brain organoid slice cultures display distinct early astrocyte and targetable neuronal pathology.Nat Neurosci. 2021 Nov;24(11):1542-1554. doi: 10.1038/s41593-021-00923-4. Epub 2021 Oct 21. Nat Neurosci. 2021. PMID: 34675437 Free PMC article.
References
-
- Geser F, et al. Evidence of multisystem disorder in whole-brain map of pathological TDP-43 in amyotrophic lateral sclerosis. Archives of Neurology. 2008;65:636–641. - PubMed
Publication types
MeSH terms
Substances
Supplementary concepts
Associated data
- Actions
Grants and funding
- R01NS077402/NS/NINDS NIH HHS/United States
- R21 NS089979/NS/NINDS NIH HHS/United States
- R21NS089979/NS/NINDS NIH HHS/United States
- P50 AG016574/AG/NIA NIH HHS/United States
- P50AG016574/AG/NIA NIH HHS/United States
- R01ES20395/ES/NIEHS NIH HHS/United States
- R01 NS063964/NS/NINDS NIH HHS/United States
- R01NS063964/NS/NINDS NIH HHS/United States
- Canadian Institutes of Health Research/Canada
- R01 NS088689/NS/NINDS NIH HHS/United States
- R01NS088689/NS/NINDS NIH HHS/United States
- R01AG026251/AG/NIA NIH HHS/United States
- P01 NS084974/NS/NINDS NIH HHS/United States
- R21 NS084528/NS/NINDS NIH HHS/United States
- P01NS084974/NS/NINDS NIH HHS/United States
- R01 ES020395/ES/NIEHS NIH HHS/United States
- R01 AG026251/AG/NIA NIH HHS/United States
- R01 NS077402/NS/NINDS NIH HHS/United States
- T32 GM072474/GM/NIGMS NIH HHS/United States
- R21NS084528/NS/NINDS NIH HHS/United States
LinkOut - more resources
Full Text Sources
Other Literature Sources
Medical
Molecular Biology Databases
Research Materials
Miscellaneous

