

Cultured Human Adipose Tissue Pericytes and Mesenchymal Stromal Cells Display a Very Similar Gene Expression Profile
- PMID: 26192741
- PMCID: PMC4653823
- DOI: 10.1089/scd.2015.0153
Cultured Human Adipose Tissue Pericytes and Mesenchymal Stromal Cells Display a Very Similar Gene Expression Profile
Abstract
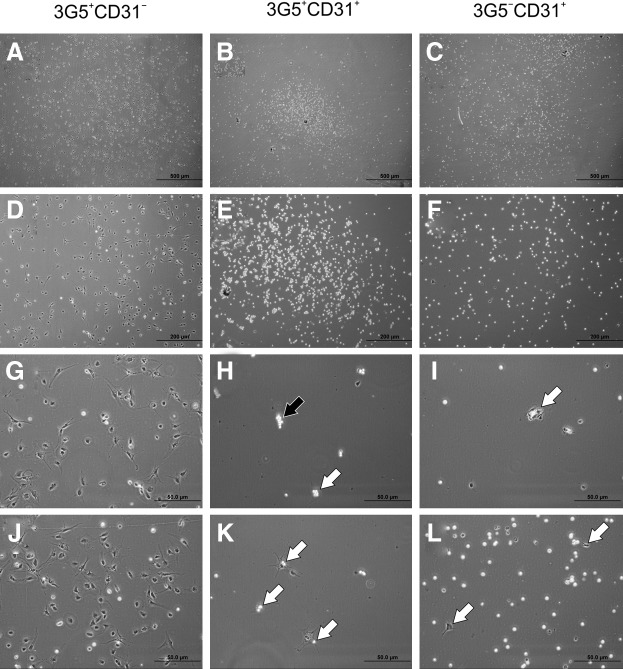
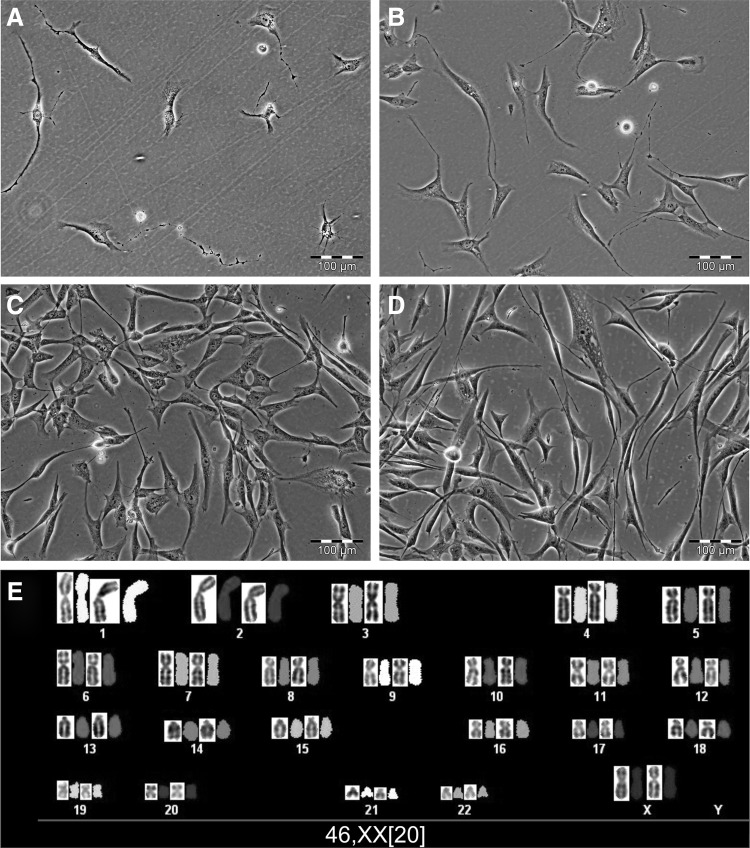
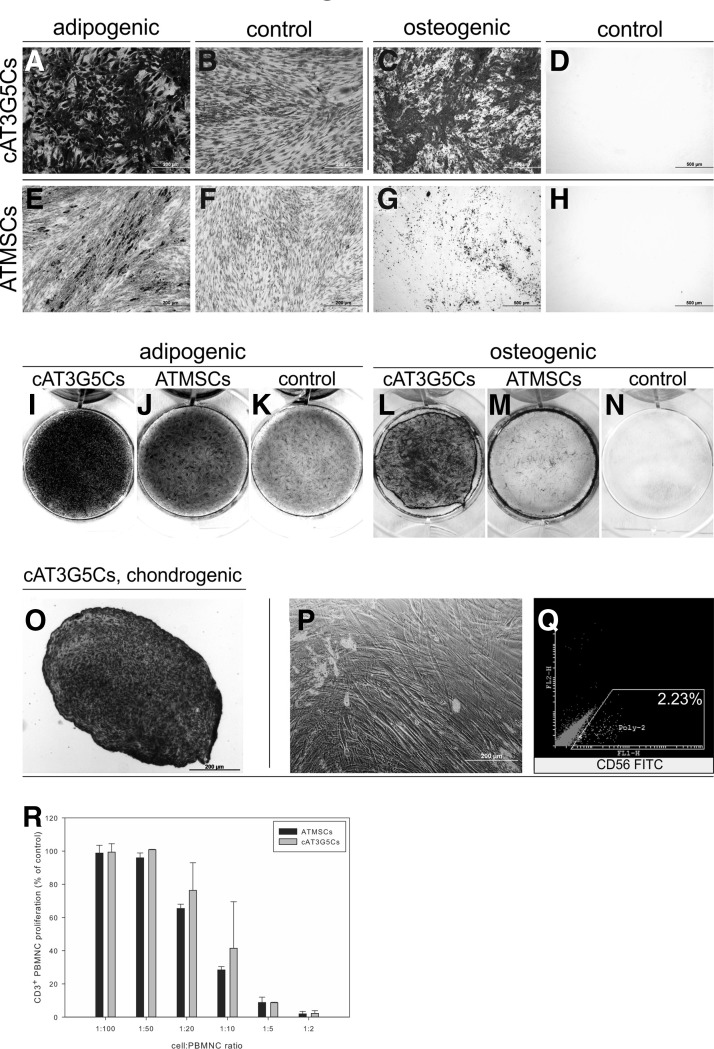
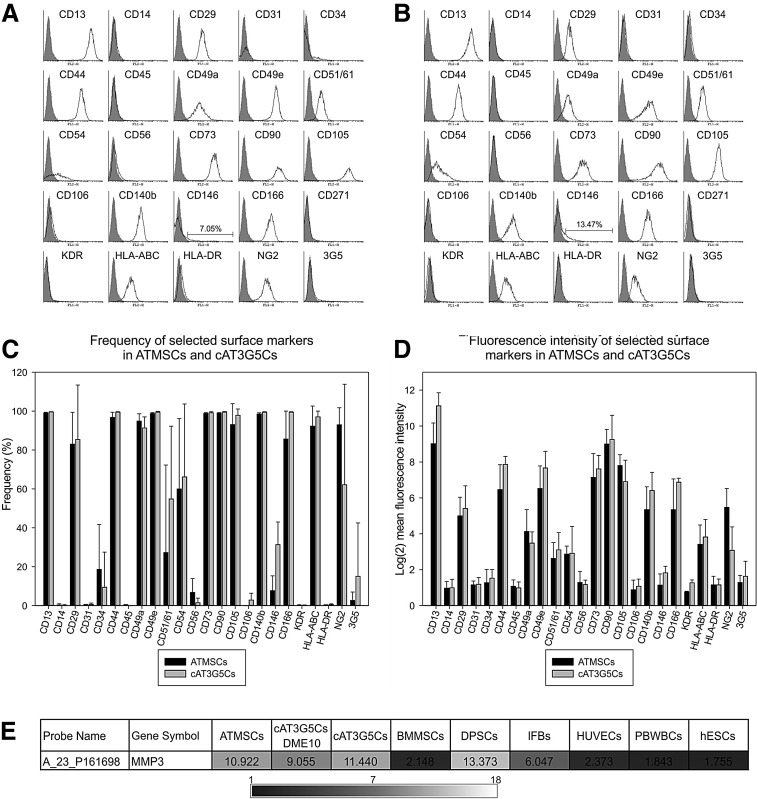
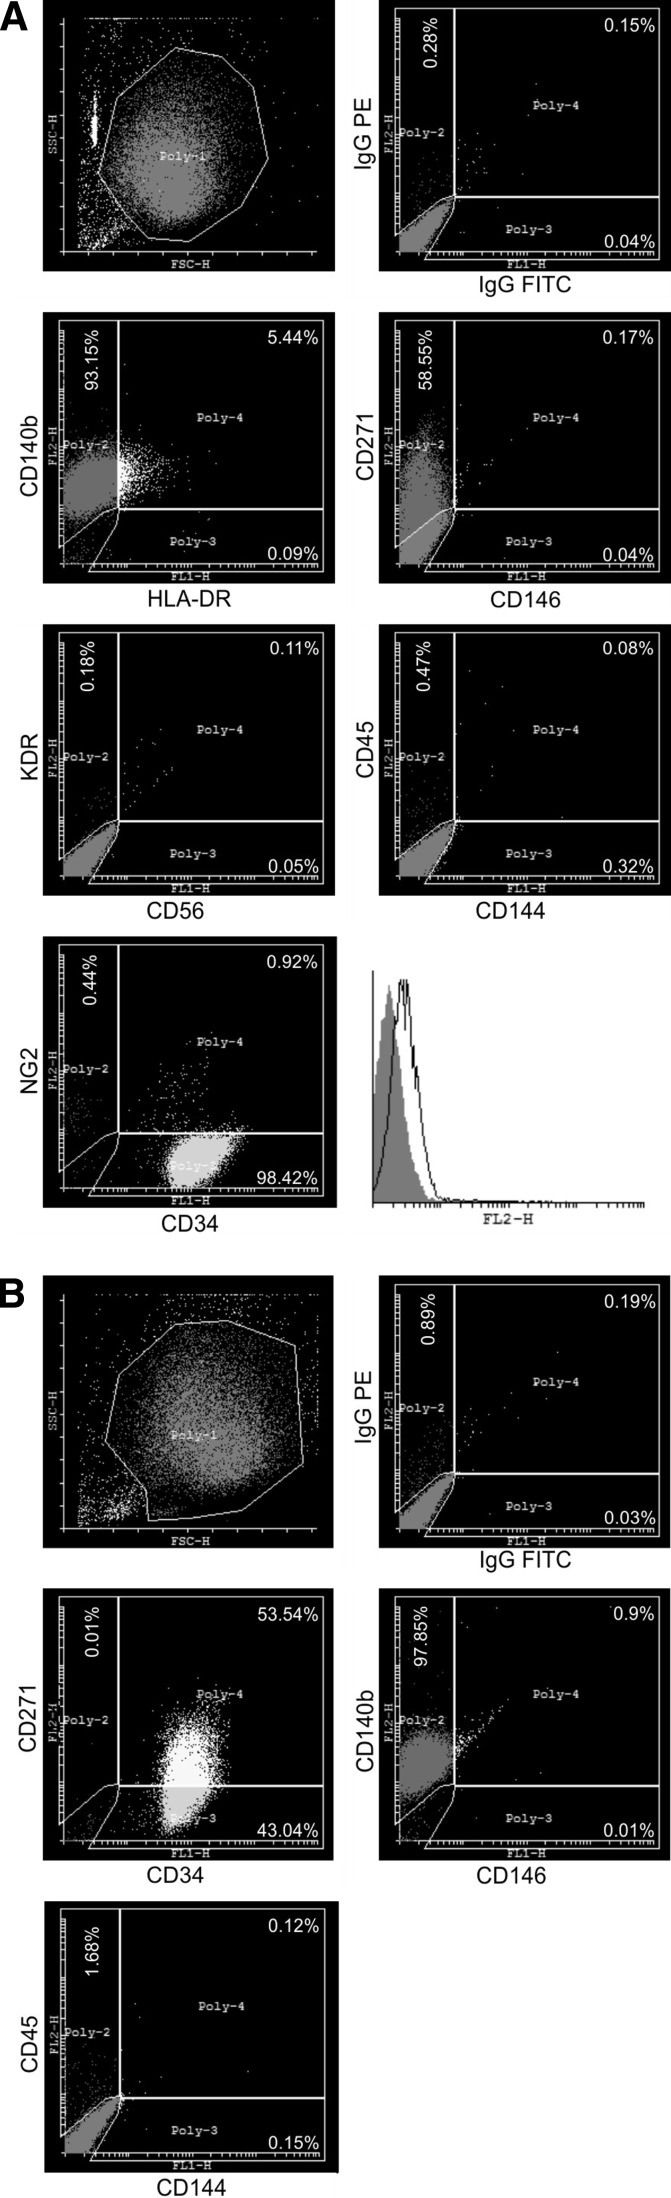
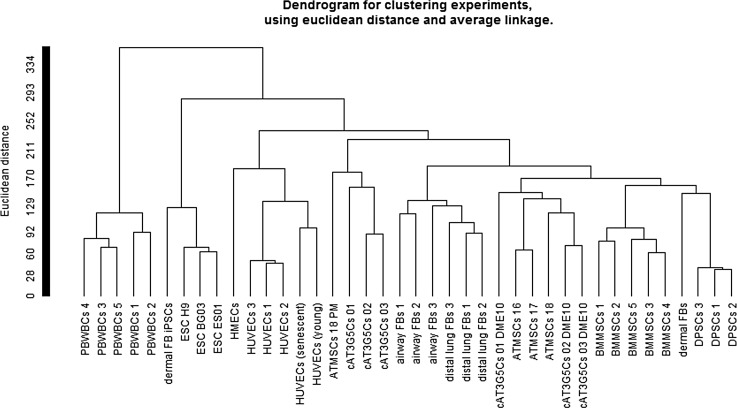
Mesenchymal stromal cells (MSCs) are cultured cells that can give rise to mature mesenchymal cells under appropriate conditions and secrete a number of biologically relevant molecules that may play an important role in regenerative medicine. Evidence indicates that pericytes (PCs) correspond to mesenchymal stem cells in vivo and can give rise to MSCs when cultured, but a comparison between the gene expression profiles of cultured PCs (cPCs) and MSCs is lacking. We have devised a novel methodology to isolate PCs from human adipose tissue and compared cPCs to MSCs obtained through traditional methods. Freshly isolated PCs expressed CD34, CD140b, and CD271 on their surface, but not CD146. Both MSCs and cPCs were able to differentiate along mesenchymal pathways in vitro, displayed an essentially identical surface immunophenotype, and exhibited the ability to suppress CD3(+) lymphocyte proliferation in vitro. Microarray expression data of cPCs and MSCs formed a single cluster among other cell types. Further analyses showed that the gene expression profiles of cPCs and MSCs are extremely similar, although MSCs differentially expressed endothelial cell (EC)-specific transcripts. These results confirm, using the power of transcriptomic analysis, that PCs give rise to MSCs and suggest that low levels of ECs may persist in MSC cultures established using traditional protocols.
Figures
Similar articles
-
The gene expression profile of non-cultured, highly purified human adipose tissue pericytes: Transcriptomic evidence that pericytes are stem cells in human adipose tissue.Exp Cell Res. 2016 Dec 10;349(2):239-254. doi: 10.1016/j.yexcr.2016.10.017. Epub 2016 Oct 24. Exp Cell Res. 2016. PMID: 27789253
-
Concerted regulation of CD34 and CD105 accompanies mesenchymal stromal cell derivation from human adventitial stromal cell.Stem Cells Dev. 2013 Mar 1;22(5):815-27. doi: 10.1089/scd.2012.0263. Epub 2012 Nov 21. Stem Cells Dev. 2013. PMID: 23072708
-
Multipotent mesenchymal stromal cells obtained from diverse human tissues share functional properties and gene-expression profile with CD146+ perivascular cells and fibroblasts.Exp Hematol. 2008 May;36(5):642-54. doi: 10.1016/j.exphem.2007.12.015. Epub 2008 Mar 4. Exp Hematol. 2008. PMID: 18295964
-
Adipose Tissue-Derived Pericytes for Cartilage Tissue Engineering.Curr Stem Cell Res Ther. 2017;12(6):513-521. doi: 10.2174/1574888X12666170321111211. Curr Stem Cell Res Ther. 2017. PMID: 28325151 Review.
-
Concise review: the surface markers and identity of human mesenchymal stem cells.Stem Cells. 2014 Jun;32(6):1408-19. doi: 10.1002/stem.1681. Stem Cells. 2014. PMID: 24578244 Review.
Cited by
-
Analyses of the pericyte transcriptome in ischemic skeletal muscles.Stem Cell Res Ther. 2021 Mar 16;12(1):183. doi: 10.1186/s13287-021-02247-3. Stem Cell Res Ther. 2021. PMID: 33726849 Free PMC article.
-
Pro-angiogenic Activity Discriminates Human Adipose-Derived Stromal Cells From Retinal Pericytes: Considerations for Cell-Based Therapy of Diabetic Retinopathy.Front Cell Dev Biol. 2020 Jun 9;8:387. doi: 10.3389/fcell.2020.00387. eCollection 2020. Front Cell Dev Biol. 2020. PMID: 32582693 Free PMC article.
-
Isolation of CD146+ Resident Lung Mesenchymal Stromal Cells from Rat Lungs.J Vis Exp. 2016 Jun 17;(112):53782. doi: 10.3791/53782. J Vis Exp. 2016. PMID: 27340891 Free PMC article.
-
Prevascularization of natural nanofibrous extracellular matrix for engineering completely biological three-dimensional prevascularized tissues for diverse applications.J Tissue Eng Regen Med. 2018 Mar;12(3):e1325-e1336. doi: 10.1002/term.2512. Epub 2017 Nov 27. J Tissue Eng Regen Med. 2018. PMID: 28714140 Free PMC article.
-
Mesenchymal Stem Cells: Time to Change the Name!Stem Cells Transl Med. 2017 Jun;6(6):1445-1451. doi: 10.1002/sctm.17-0051. Epub 2017 Apr 28. Stem Cells Transl Med. 2017. PMID: 28452204 Free PMC article.
References
-
- Caplan AI. (1991). Mesenchymal stem cells. J Orthop Res 9:641–650 - PubMed
-
- Dominici M, Le Blanc K, Mueller I, Slaper-Cortenbach I, Marini F, Krause D, Deans R, Keating A, Prockop D. and Horwitz E. (2006). Minimal criteria for defining multipotent mesenchymal stromal cells. The International Society for Cellular Therapy position statement. Cytotherapy 8:315–317 - PubMed
-
- Caplan AI. and Bruder SP. (2001). Mesenchymal stem cells: building blocks for molecular medicine in the 21st century. Trends Mol Med 7:259–264 - PubMed
-
- Meirelles Lda S, Fontes AM, Covas DT. and Caplan AI. (2009). Mechanisms involved in the therapeutic properties of mesenchymal stem cells. Cytokine Growth Factor Rev 20:419–427 - PubMed
-
- da Silva Meirelles L, Caplan AI. and Nardi NB. (2008). In search of the in vivo identity of mesenchymal stem cells. Stem Cells 26:2287–2299 - PubMed
Publication types
MeSH terms
Substances
LinkOut - more resources
Full Text Sources
Other Literature Sources
Molecular Biology Databases
