. 2015 Aug 1;75(15):3054-64.
doi: 10.1158/0008-5472.CAN-15-0205. Epub 2015 Jul 16.

Tristetraprolin Limits Inflammatory Cytokine Production in Tumor-Associated Macrophages in an mRNA Decay-Independent Manner

Affiliations

Tristetraprolin Limits Inflammatory Cytokine Production in Tumor-Associated Macrophages in an mRNA Decay-Independent Manner

Franz Kratochvill et al. Cancer Res. .

Abstract

Tristetraprolin (TTP) is an inducible zinc finger AU-rich RNA-binding protein essential for enforcing degradation of mRNAs encoding inflammatory chemokines and cytokines. Most studies on TTP center on the connection between mRNA half-life and inflammatory output, because loss of TTP amplifies inflammation by increasing the stability of AU-rich mRNAs. Here, we focused on how TTP controls cytokine and chemokine production in the nonresolving inflammation of cancer using tissue-specific approaches. In contrast with model in vitro macrophage systems, we found constitutive TTP expression in late-stage tumor-associated macrophages (TAM). However, TTP's effects on AU-rich mRNA stability were negligible and limited by constitutive p38α MAPK activity, which was the main driver of proinflammatory cytokine production in TAMs at the posttranscriptional level. Instead, elimination of TTP caused excessive protein production of inflammatory mediators, suggesting TTP-dependent translational suppression of AU-rich mRNAs. Manipulation of the p38α-TTP axis in macrophages has significant effects on the growth of tumors and therefore represents a means to manipulate inflammation in the tumor microenvironment.


Conflict of interest statement

The authors disclose no potential conflicts of interest.

Conflict of Interest

The authors declare that they have no conflict of interest.

Figures

Figure 1
Figure 1. NRI associated macrophages share a common mode of development and express pro-inflammatory cytokines
A and B, flow cytometry plots of CD11b+Ly6G myeloid cells isolated from EG7 thymomas (A) or zymosan induced peritonitis (B) at different timepoints as indicated. Plots are representative for at least 2 experiments. Gates A, B, C and D indicate tumor-associated macrophage (TAM) or peritonitis-associated macrophage (PAM) populations used for sorting experiments or to measure cytokine production by intracellular flow cytometry. C, quantitative analysis of EG7 TAM populations A and C (gated as in A) over time. Data are values from 1 out of 2 independent experiments (n ≥ 4). Error bars, SEM. D, quantitative analysis of cytokine production by flow cytometry of EG7 TAM populations A, B and C gated as shown in 1A. Values from individual mice are either depicted as percent positive cells (left panels) or Median Fluorescence Intensity (MFI, middle panel) of TNF or IL-1α positive (TNF+, IL-1α+) compared to negative (TNF, IL-1α) macrophages with in population A, B and C. Example plots are shown (right panel) indicating the gating strategy for cells considered positive and negative. Unstained control is shown in grey. Data represent the mean +/− SEM of 2 independent experiments (n ≥ 2).
Figure 2
Figure 2. TTP is highly expressed in selected TAM populations
A, immunoblot analysis of TTP expression in neuroblastoma (N), osteosarcoma (O) and EG7 thymoma (T) TAMs compared to 1 hour LPS stimulated BMDMs. Blot was reprobed with anti-GRB2 to test for equal loading and represents 1 out of 3 experiments. B, TTP qRT-PCR of EG7 TAMs sorted for the indicated populations as in Figure 1A. Data from individual mice are expression values from 4 experiments (n ≥ 6). All values were first normalized to the corresponding GAPDH and then to the mean of TAM-C within each experiment. Data were analyzed by One-way Anova followed by Bonferroni Post Test. The mean per group is shown as black line. Error bars, SEM. C, qRT-PCR analysis of TTP in TAMs or BMDMs left untreated (ns) or stimulated with LPS + IFNγ over time. Data were normalized to the corresponding GAPDH for each value and represent the mean +/− SEM (n ≥ 3). D, microarray analysis of TAMs isolated from Neuroblastomas (N-TAM), EG7 Thymomas (T-TAM) and Gliomas (G-TAM) showing average signal intensities of selected AU-rich element binding proteins (ARE-BPs, n = 3 per TAM type). The right panel shows the rank of different ARE-BPs in N-TAMs together with the rank as percentage among all 45038 probe sets, respectively. The full microarray dataset has been submitted (GEO accession number GSE59047).
Figure 3
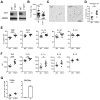
Figure 3. Myeloid TTP counteracts inflammation and supports tumor growth
A, immunoblot analysis using anti-TTP antibody of whole cell lysates of EG7 TAMs isolated from WT, TTPΔM or TTP−/− tumor bearing animals. Blots were re-probed using anti-GRB2 antibody to confirm equal loading and represent 1 out of at least 2 independent experiments (Note: the brighter band detected in TTPKO TAMs is as it appears on the blot and has not been manipulated). B, tumor mass of EG7 thymomas grown in WT (Zfp36flox/flox) and TTPΔM mice for 13 days. Data from individual mice from 3 independent experiments (n ≥ 23) are shown together with the mean and SEM. C, active Caspase 3 staining of representative EG7 tumors isolated from WT and TTPΔM animals. n = 3 animals per genotype. D, flow cytomery analysis of Annexin V+ cells in EG7 thymomas grown in WT and TTPΔM mice. Data represent values from individual mice as percent of total cells from 1 out of 3 experiments (n ≥ 6). E and F, cytokine production in EG7 TAMs (gated on CD11b+) measured by intracellular flow cytometry in WT (Zfp36flox/flox) or TTPΔM animals. Data are % positive cells of CD11b+ (E) or Median Fluorescence Intensity (MFI) of cytokine+CD11b+ cells (F) from individual mice from 1 out of 2–5 experiments (n ≥ 6). The mean is depicted as black line. Error bars, SEM. G, TNF cytokine production detected by ELISA in the supernatants of WT and TTPΔM TAMs after 6 hrs (right panel) or resting or 3 hrs LPS stimulated BMDMs (left panel). The mean is depicted as black line. Error bars, SEM. Values represent TAMs from individual mice (n ≥ 2) from 1 out of 2 experiments.
Figure 4
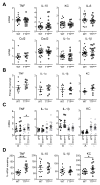
Figure 4. TTP-dependent mRNA decay is limited in TAMs
A, qRT-PCR analysis of EG7 TAMs isolated from WT and TTPΔM mice. Data from at least 3 experiments were combined and values from individual mice (n ≥ 8) were normalized to the corresponding GAPDH followed by the mean WT within each experiment. The mean per group is shown as black line. Error bars, SEM. B, qRT-PCR analysis of primary transcripts of inflammatory mRNAs in WT and TTPΔM TAMs. Values from individual mice (n ≥ 7) were normalized to GAPDH and mean WT within each experiment and are combined from 2 experiments. Identical samples from each tumor were processed in the absence of reverse transcriptase to serve as controls for genomic DNA contamination. The mean per group is shown as black line. Error bars, SEM. C, qRT-PCR analysis of TTP target mRNAs in EG7 TAM population A and C isolated from WT and TTPΔM mice. Data represent the expression values of individual mice (n ≥ 7) combined from 2–4 experiments. Values were normalized to the corresponding GAPDH and subsequently to the mean of WT TAM-C within each experiment. Mean is shown as black line. Error bars, SEM. D, mRNA stability measured by qRT-PCR by comparing cells before and 90 minutes after transcriptional blockade by Actinomycin D in EG7 TAMs from WT and TTPΔM mice. Values were normalized to GAPDH and represent % cytokine mRNA remaining after Actinomycin D treatment as mean and SEM. Data are expression values from individual mice combined from 2–3 experiments (n ≥ 8). Mean is indicated by a black line. Error bars, SEM.
Figure 5
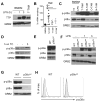
Figure 5. Reduced TTP-dependent mRNA decay coincides with chronic p38α activation in TAMs and PAMs
A, TTP expression analyzed by immunoblotting of whole cell lysates of EG7 TAMs and resting or LPS treated BMDMs. Blots were re-probed using anti-GRB2 antibody to confirm equal loading and represent 1 out of 3 experiments. B, TNF mRNA stability determined by qRT-PCR by comparing cells before and 90 minutes after transcriptional blockade by Actinomycin D in BMDMs and TAMs isolated from EG7 thymomas (T-TAM), neuroblastomas (N-TAM) or osteosarcomas (O-TAM). Values were normalized to GAPDH and represent % TNF mRNA remaining after Actinomycin D treatment as mean and SEM of at least 2 experiments (n ≥ 2). C, immunoblot analysis of total cell lysates of non-stimulated (ns) or 1hr LPS stimulated (LPS) BMDMs as well as TAMs isolated from different tumor models as in B, probed with anti-phospho-p38, anti-p38 or anti-GRB2 as loading control. The blot represents 1 out of 3 experiments. D, p38 phosphorylation analyzed by immunoblotting of whole EG7 TAM lysates from WT TAMs directly after isolation (−) or after resting them on tissue culture dishes (TC) for 3 hrs. E and F, immunoblot analysis of whole EG7 TAM lysates (E) or BMDMs left untreated or stimulated with LPS for 1 and 3 hrs (F) isolated from WT or p38αΔM animals. Blots represent 1 out of 2 experiments. G, Whole EG7 TAM lysates from WT or p38αΔH animals as in (E) analyzed for p38 and p-p38 protein expression by immunoblotting (n = 2). H, flow cytometry analysis of p-p38 in CD11b+ EG7 TAMs isolated from WT or p38αΔH animals (n ≥ 4). Representative plots are shown with unstained control as grey line.
Figure 6
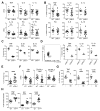
Figure 6. p38α regulates TTP expression and activity in TAMs
A, EG7 TAM RNA from WT or p38αΔH tumor bearing mice was analyzed by qRT-PCR. Expression values from individual mice combined from 3 experiments (n ≥ 13) were normalized to GAPDH and the mean WT within each experiment and are depicted as mean indicated by black lines. Error bars, SEM. B and G, mRNA stability measured by qRT-PCR as in Figure 4Din EG7 TAMs from WT (Mapk14flox/flox) and p38αΔH animals (B) and in unstimulated (−) or SB203580 (SB) treated WT EG7 TAMs (G). SB treatment was started concomitant to Actinomycin D imposed transcriptional blockade. Data represent values from individual mice normalized to GAPDH from either 3–5 (n ≥ 10, B) or 1 out of 2 (n ≥ 7, G) experiments, respectively. Black lines indicate the mean per group. Error bars, SEM. C, cytokine expression analyzed by flow cytometry of EG7 TAMs (gated on CD11b+) isolated from WT or p38αΔH mice. Values from individual mice are percent of CD11b+ cells (n = 6) representing 1 out of 2 experiments with the mean depicted as black line. Error bars, SEM. D, cytokine production evaluated by intracellular flow cytometry in lethally irradiated mice reconstituted with a mixture of WT (CD45.1) and p38αΔH (CD45.2) bone marrow (n = 4). Depicted values represent % positive cells of CD11b+ TAMs gated for CD45.1 or CD45.2 as shown (left panel). Error bars, SEM. E, EG7 tumor mass 12days post transplantation of EG7 cells into WT or p38αΔH animals. Values from individual mice combined from 3 experiments are shown with the black line representing the mean. Error bars, SEM. F, qRT-PCR analysis of TTP and TTP family members in EG7 TAMs from WT and p38αΔH mice. Data represent expression values from individual mice (n ≥ 14) normalized to GAPDH and the corresponding mean WT from 3 independent experiments. The mean is shown as black line. Error bars, SEM. H, mRNA decay measured in WT and TTPΔM EG7 TAMs with and without SB treatment as in G. Values of individual mice are depicted as % of mRNA stability after SB treatment relative to the corresponding stability in untreated WT or TTPΔM TAMs. Values were normalized to GAPDH and the corresponding untreated TAM sample (n ≥ 9) and were combined from 2 experiments. The black line represents the mean. Error bars, SEM.

Similar articles

Cited by

References

    1. Nathan C, Ding A. Nonresolving inflammation. Cell. 2010;140(6):871–82. - PubMed
    1. Gabrilovich DI, Ostrand-Rosenberg S, Bronte V. Coordinated regulation of myeloid cells by tumours. Nature reviews Immunology. 2012;12(4):253–68. - PMC - PubMed
    1. Hargreaves DC, Horng T, Medzhitov R. Control of inducible gene expression by signal-dependent transcriptional elongation. Cell. 2009;138(1):129–45. - PMC - PubMed
    1. Danko CG, Hah N, Luo X, Martins AL, Core L, Lis JT, et al. Signaling pathways differentially affect RNA polymerase II initiation, pausing, and elongation rate in cells. Molecular cell. 2013;50(2):212–22. - PMC - PubMed
    1. Bhatt DM, Pandya-Jones A, Tong AJ, Barozzi I, Lissner MM, Natoli G, et al. Transcript dynamics of proinflammatory genes revealed by sequence analysis of subcellular RNA fractions. Cell. 2012;150(2):279–90. - PMC - PubMed

Publication types

MeSH terms