. 2015 Jul 15;35(28):10252-67.
doi: 10.1523/JNEUROSCI.5272-14.2015.

Pten Mutations Alter Brain Growth Trajectory and Allocation of Cell Types through Elevated β-Catenin Signaling

Affiliations

Pten Mutations Alter Brain Growth Trajectory and Allocation of Cell Types through Elevated β-Catenin Signaling

Youjun Chen et al. J Neurosci. .

Abstract

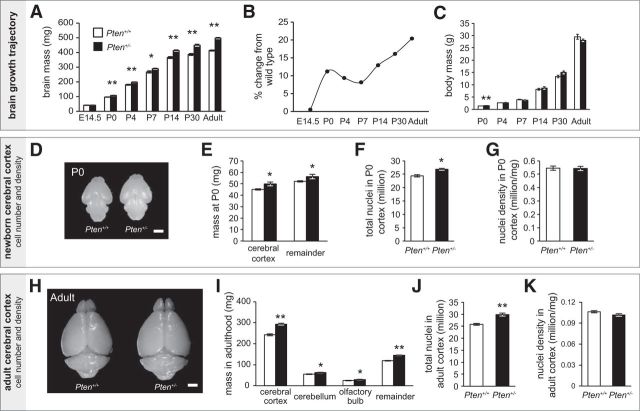
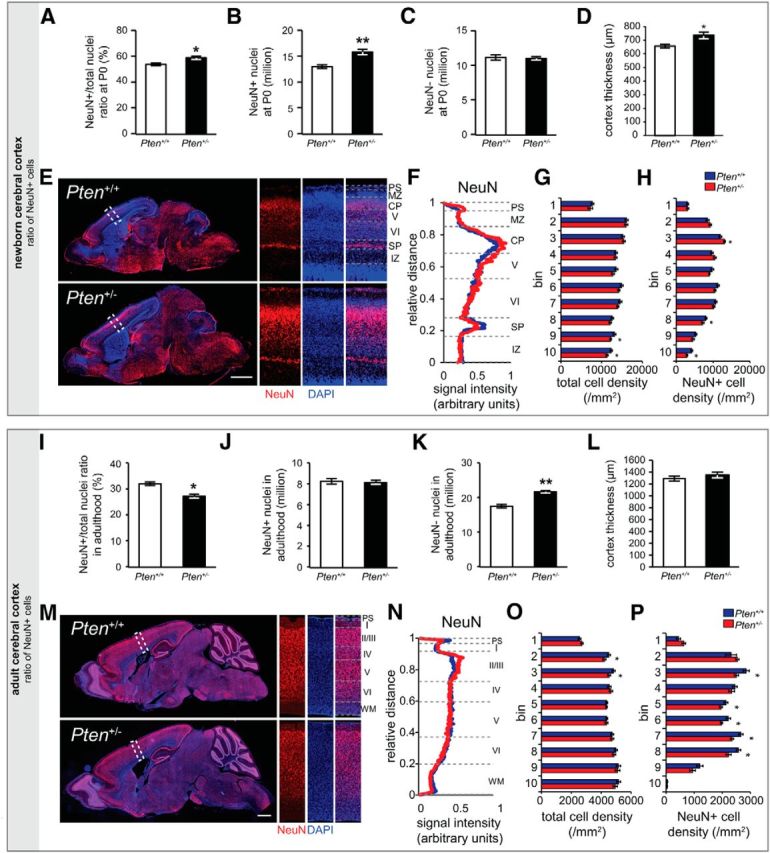
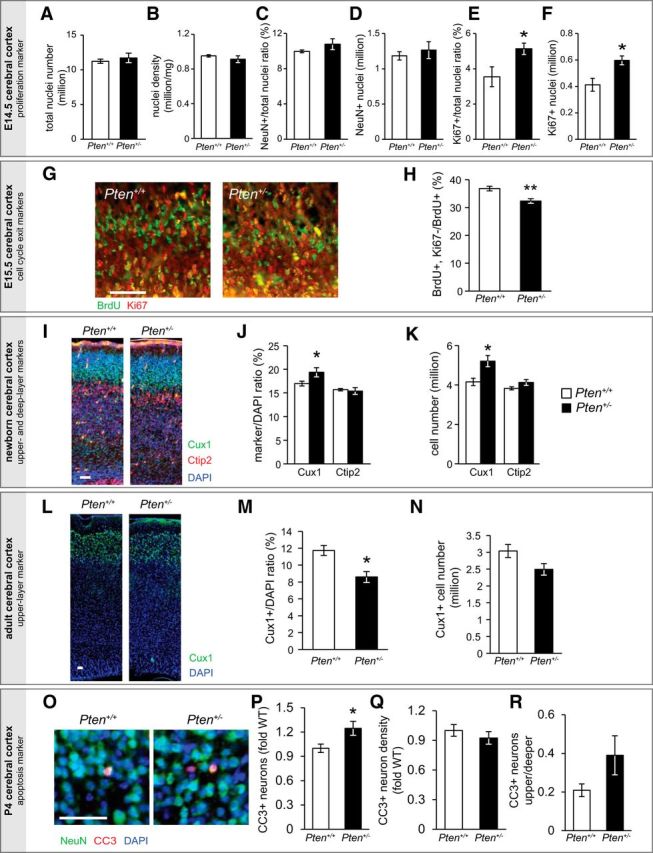
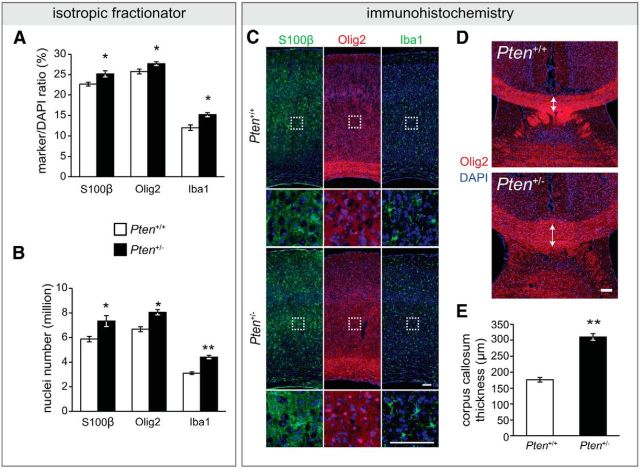
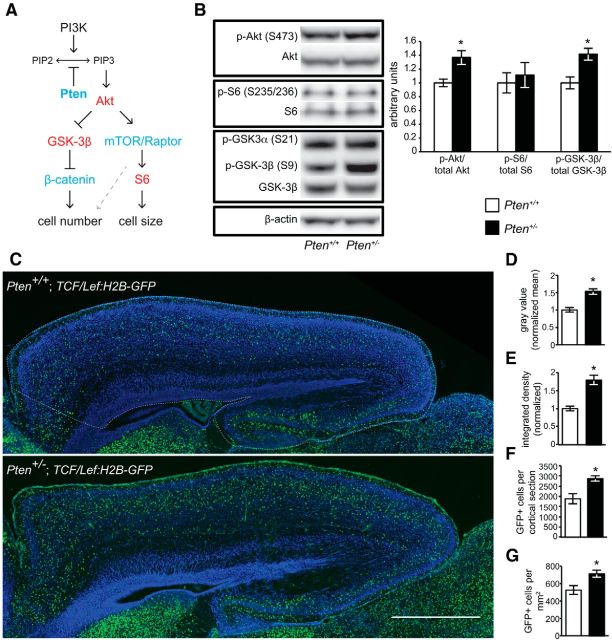
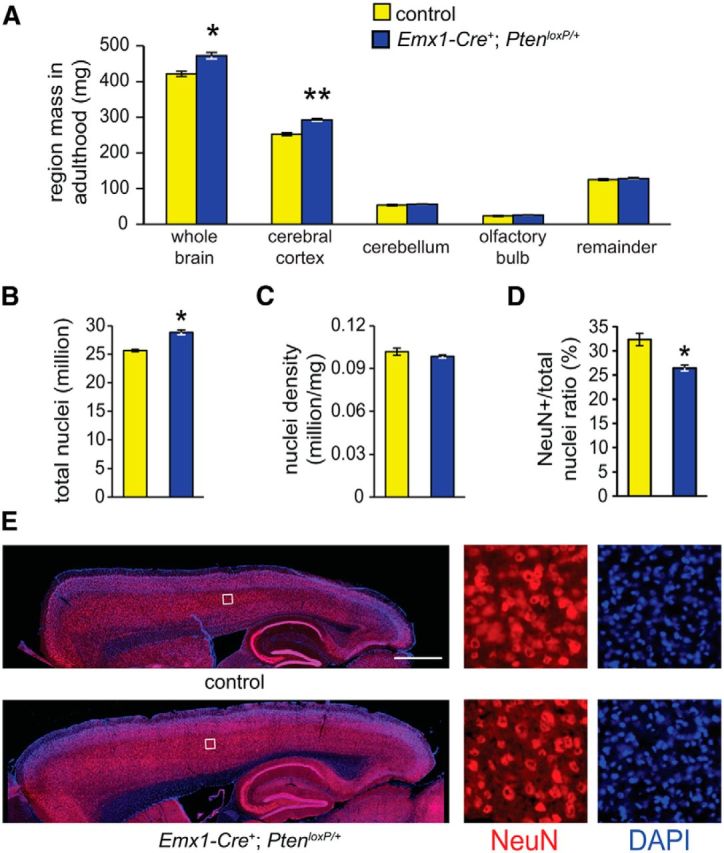
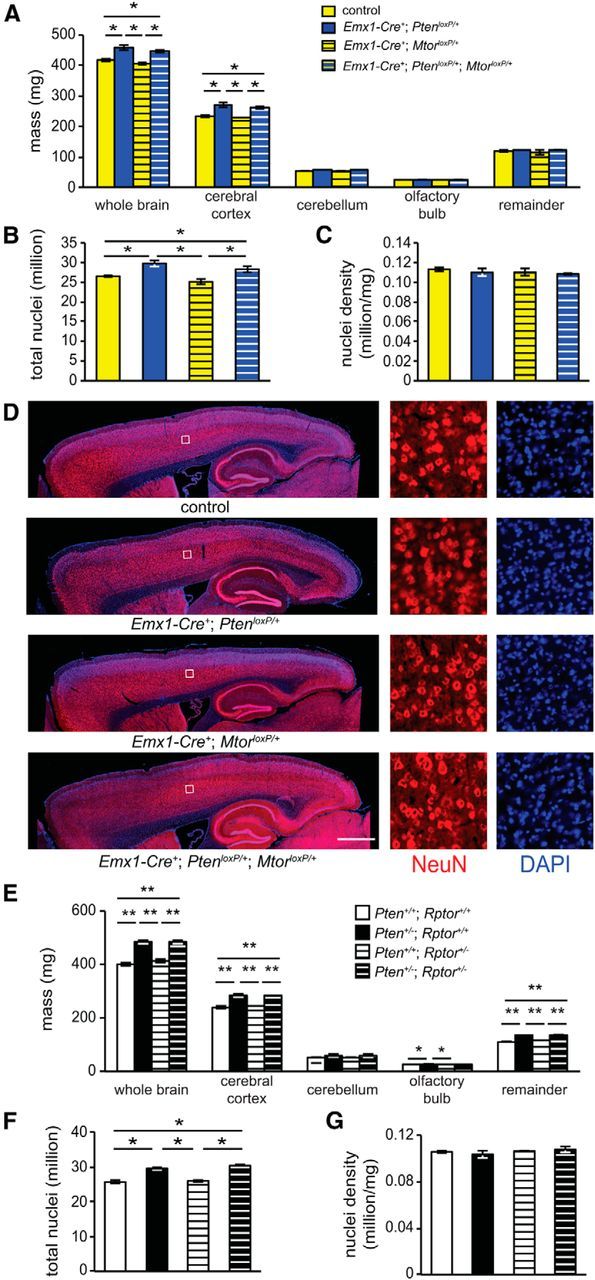
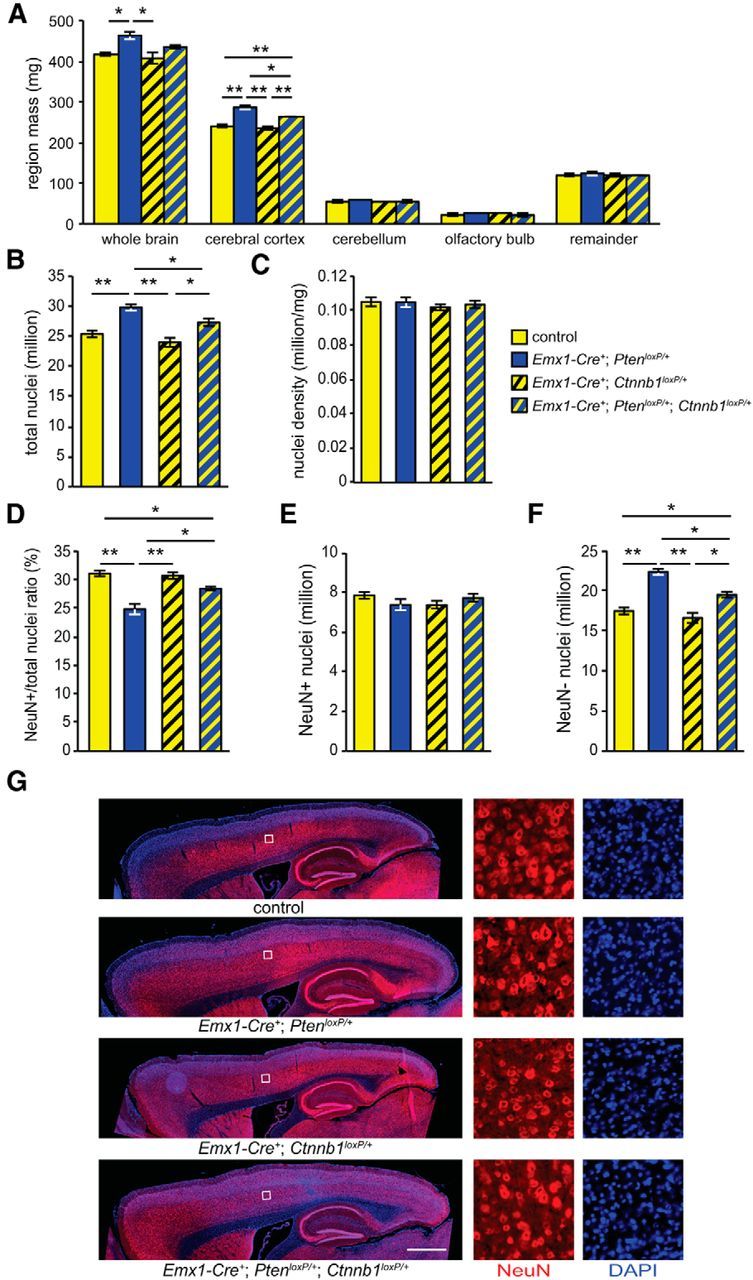
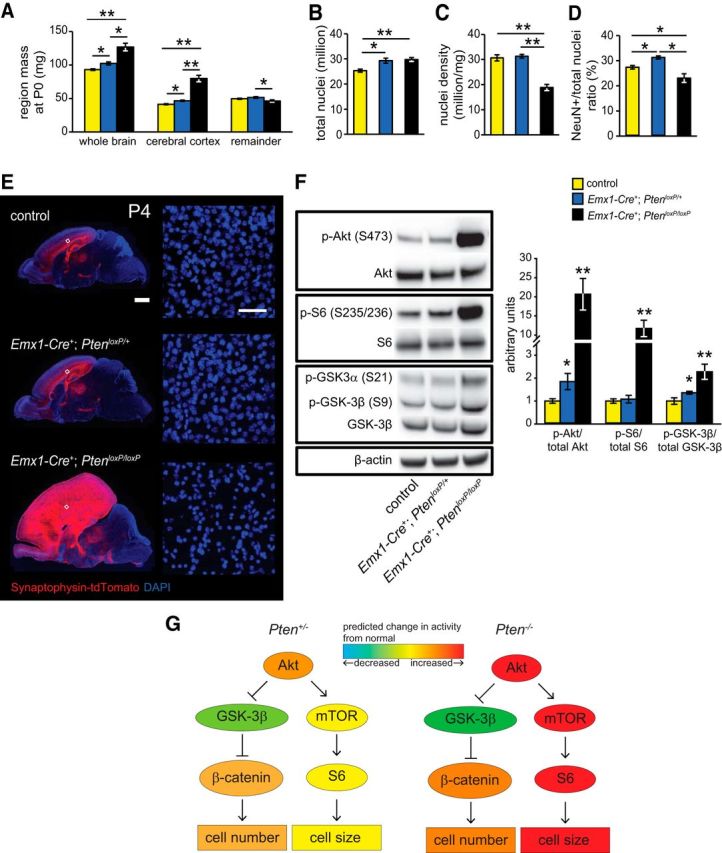
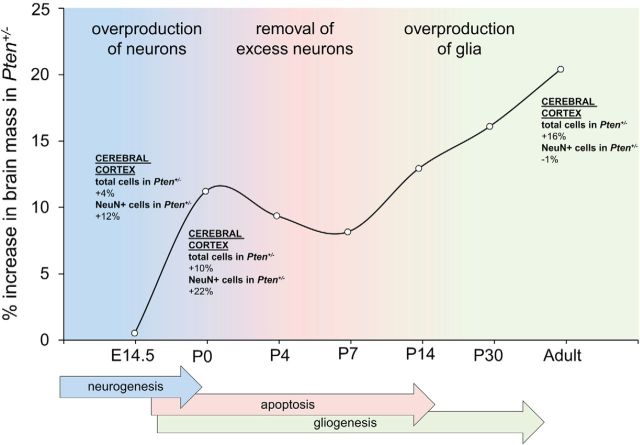
Abnormal patterns of head and brain growth are a replicated finding in a subset of individuals with autism spectrum disorder (ASD). It is not known whether risk factors associated with ASD and abnormal brain growth (both overgrowth and undergrowth) converge on common biological pathways and cellular mechanisms in the developing brain. Heterozygous mutations in PTEN (PTEN(+/-)), which encodes a negative regulator of the PI3K-Akt-mTOR pathway, are a risk factor for ASD and macrocephaly. Here we use the developing cerebral cortex of Pten(+/-) mice to investigate the trajectory of brain overgrowth and underlying cellular mechanisms. We find that overgrowth is detectable from birth to adulthood, is driven by hyperplasia, and coincides with excess neurons at birth and excess glia in adulthood. β-Catenin signaling is elevated in the developing Pten(+/-) cortex, and a heterozygous mutation in Ctnnb1 (encoding β-catenin), itself a candidate gene for ASD and microcephaly, can suppress Pten(+/-) cortical overgrowth. Thus, a balance of Pten and β-catenin signaling regulates normal brain growth trajectory by controlling cell number, and imbalance in this relationship can result in abnormal brain growth.

Significance statement: We report that Pten haploinsufficiency leads to a dynamic trajectory of brain overgrowth during development and altered scaling of neuronal and glial cell populations. β-catenin signaling is elevated in the developing cerebral cortex of Pten haploinsufficient mice, and a heterozygous mutation in β-catenin, itself a candidate gene for ASD and microcephaly, suppresses Pten(+/-) cortical overgrowth. This leads to the new insight that Pten and β-catenin signaling act in a common pathway to regulate normal brain growth trajectory by controlling cell number, and disruption of this pathway can result in abnormal brain growth.

Keywords: Pten; autism; brain growth; cell types; macrocephaly; β-catenin.


Conflict of interest statement

The authors declare no competing financial interests.

Figures

Figure 1.
Figure 1.
Germline Pten+/− mice show brain overgrowth and hyperplasia of the cerebral cortex from birth. A, Developmental trajectory of brain growth. Brains of Pten+/− mice are heavier than those of WT (Pten+/+) mice from postnatal day 0 (P0) to adulthood. B, Difference from WT of Pten+/− brain mass calculated by the following: (Pten+/− brain mass − WT brain mass)/WT brain mass × 100. C, Body mass at different ages. Pten+/− mice are heavier than WT mice at P0, but not at other stages. D, H, Representative WT and Pten+/− brains at P0 (D) and adulthood (H). Scale bars, 2 mm. E, I, Brain region mass at P0 (E) and adulthood (I). All anatomical regions are heavier in Pten+/− compared with WT mice. F, J, Total nuclei number is increased within Pten+/− cerebral cortex at both P0 (F) and adulthood (J), as determined by isotropic fractionator. G, K, Nuclei density within cerebral cortex at P0 (G) and adulthood (K). No significant difference is observed between WT and Pten+/−, as determined by isotropic fractionator. E15.5, Embryonic day 15.5; P0, postnatal day 0. *p < 0.05. **p < 0.001. A–C, E14.5: Pten+/+, n = 12; Pten+/−, n = 10. P0: Pten+/+, n = 29; Pten+/−, n = 21. P4: Pten+/+, n = 17; Pten+/−, n = 13. P7: Pten+/+, n = 9; Pten+/−, n = 10. P14: Pten+/+, n = 10; Pten+/−, n = 4. P30: Pten+/+, n = 4; Pten+/−, n = 5. Adult: Pten+/+, n = 13; Pten+/−, n = 12. E–G, Pten+/+, n = 10; Pten+/−, n = 6. I–K, Pten+/+, n = 7; Pten+/−, n = 7. Data are mean ± SEM.
Figure 2.
Figure 2.
Neuron number is increased in the cerebral cortex of germline Pten+/− mice at birth but not in adulthood. A, I, Ratio of nuclei positive for NeuN (neuronal marker, NeuN+) to total nuclei (DAPI+). NeuN+/DAPI+ ratio is increased in Pten+/− cortex at P0 (A) and decreased in adulthood (I). B, J, Number of NeuN+ nuclei in the cortex. NeuN+ nuclei number is increased Pten+/− cortex at P0 (B) but is similar to that of WT cortex in adulthood (J). C, K, Number of NeuN (non-neuronal) nuclei in the cortex. The number of NeuN nuclei is similar between Pten+/− and WT cortices at P0 (C) and higher in adult Pten+/− cortex (K). D, L, The thickness of the cerebral cortex (somatosensory cortex, measured from ventricle to pial surface) is greater than WT in Pten+/− brain at P0 (D) but not in adulthood (L). E, M, Sagittal brain sections immunostained with anti-NeuN antibody (red) and DAPI (nuclear marker; blue) at P0 (E) and in adulthood (M). Top left panel, WT (Pten+/+) brain section. Bottom left panel, Pten+/− brain section. Right panels, Enlarged views of cerebral cortex from the inset of the left panels. Scale bars, 1 mm. PS, Pial surface; MZ, marginal zone; CP, cortical plate; I, layer I; II/III, layer II/III; V, layer V; VI, layer VI; SP, subplate; IZ, intermediate zone; WM, white matter. F, N, Laminar plot analysis of anti-NeuN immunostaining indicates that Pten haploinsufficiency does not alter gross cortical organization at P0 (F) or in adulthood (N). G, O, Count of DAPI+ cell density in WT and Pten+/− somatosensory cortex at P0 (G) and in adulthood (O). H, P, Count of NeuN+ cell density in WT and Pten+/− somatosensory cortex at P0 (H) or in adulthood (P). *p < 0.05. **p < 0.001. A–C, WT, n = 8; Pten+/−, n = 6. I–K, WT, n = 7; Pten+/−, n = 7. D, G, H, L, O, P, n = 3 per genotype. Scale bars: E, M, 1 mm. Data are mean ± SEM.
Figure 3.
Figure 3.
Markers of proliferation, lamination, and apoptosis in the cerebral cortex of germline Pten+/− mice. A–F, Data obtained using isotropic fractionator at E14.5. A, Total nuclei number is not significantly changed within Pten+/− cerebral cortex. B, Nuclei density within cerebral cortex. No significant difference is observed between WT and Pten+/−. C, Ratio of nuclei positive for NeuN (neuronal marker, NeuN+) to total nuclei (DAPI+) is not changed in Pten+/− cortex. D, Number of NeuN+ nuclei in the Pten+/− cortex is similar to that of WT cortex. E, Ratio of Ki67+ to total nuclei is increased in Pten+/− cortex. F, Number of Ki67+ nuclei is increased in Pten+/− cortex. G, Representative images showing BrdU (green, BrdU delivered at E14.5) and Ki67 (red) immunostaining in E15.5 cortex. H, Quantification of the ratio of BrdU+ cells exiting cell cycle measured via immunohistochemistry at E15.5. There is a significant decrease in the percentage of cells exiting the cell cycle (BrdU+, Ki67/BrdU+) in Pten+/− cortex. A single pulse of BrdU was injected at E14.5. I, Representative images showing P0 WT and Pten+/− cortex labeled with Cux1 (green, upper-layer marker), Ctip2 (red, deep-layer marker), and DAPI (blue). Ratio (Cux1+/DAPI+) (J) and number (K) of Cux1+ neurons are increased, whereas ratio of Ctip2+ neurons is not changed in Pten+/− cortex at P0, as determined by isotropic fractionator. The total number of Ctip2+ neurons in Pten+/− cortex displays a trend toward an increase (p = 0.07). L, Representative images showing adult WT and Pten+/− cortex labeled with Cux1 (green) and DAPI (blue). M, Ratio (Cux1+/DAPI+) of Cux1+ neurons is decreased, whereas (N) the total number of Cux1+ neurons is not changed in Pten+/− cortex in adulthood, as determined by isotropic fractionator. O, Images showing CC3 immunostaining within the cerebral cortex at P4. P, Number of CC3+ neurons is increased, whereas (Q) the density of CC3+ neurons is not changed in Pten+/− cortex at P4. Data are shown as the fold change from WT and are obtained through counting CC3+ neurons in the cortex of images acquired after immunohistochemistry. R, The ratio of upper-layer (II-IV)/deep-layer (V, VI, and subplate) CC3+ neurons displays a trend toward an increase in Pten+/− cortex relative to Pten+/+ cortex (p = 0.06). *p < 0.05. **p < 0.001. A–F, WT, n = 5; Pten+/−, n = 5. E, P, H, WT, n = 3; Pten+/−, n = 3. J, K, WT, n = 10; Pten+/−, n = 6. M, N, WT, n = 4; Pten+/−, n = 4. Scale bars, 50 μm. Data are mean ± SEM.
Figure 4.
Figure 4.
Increased number of glia in adult germline Pten+/− cerebral cortex. A, Ratios of nuclei immunoreactive for S100β (astrocyte marker), Olig2 (oligodendrocyte marker), and Iba1 (microglia marker) to total nuclei (DAPI+) are increased in adult Pten+/− cortex, as measured using isotropic fractionator. B, Numbers of S100β+, Olig2+, and Iba1+ nuclei are increased in adult Pten+/− cortex. C, Representative images of adult WT and Pten+/− cortex immunostained with anti-S100β (green, left), anti-Olig2 (red, middle), or anti-Iba1 (green, right), and DAPI (blue) showing that the signals of all three glial cell type markers are elevated in Pten+/− cortex. Scale bars, 100 μm. D, Representative images of adult WT and Pten+/− corpus callosum immunostained with anti-Olig2 (red) and DAPI (blue). Scale bars, 100 μm. E, The corpus callosum is thicker in adult Pten+/− mice than WT. *p < 0.05. **p < 0.001. A, B, WT, n = 4; Pten+/−, n = 4. C–E, WT, n = 3; Pten+/−, n = 3. Data are mean ± SEM.
Figure 5.
Figure 5.
Markers of β-catenin activity are elevated in the cerebral cortex of germline Pten+/− mice at birth. A, Hypothetical model of Pten and downstream signaling pathways. In this highly simplified schema, Pten negatively regulates the PI3K-Akt pathway to control cell number through GSK-3β-β-catenin signaling and cell size through mTOR-S6 signaling. Red represents pathway components probed in this study by Western blot. Blue represents those tested by genetic manipulations. Dashed line connecting mTOR/Raptor/S6 signaling to cell number indicates that these processes have been linked in previous studies. B, p-Akt and p-GSK-3β are increased in Pten+/− cortex as determined by Western blot analysis. n = 5 for both WT and Pten+/−. C–G, Increased expression of a reporter (TCF/Lef:H2B-GFP) for β-catenin activity in Pten+/− cortex at P0. WT: n = 4; Pten+/−: n = 3. C, Representative images of WT (top) and Pten+/− (bottom) cortex showing reporter activity (nuclear-localized GFP) in green and DAPI in blue. Scale bar, 1 mm. Density of GFP signal (D), total GFP signal (E), total number of GFP-positive cells (F), and density of GFP-positive cells (G) are increased in Pten+/− cortex. *p < 0.05. Data are mean ± SEM.
Figure 6.
Figure 6.
Pten conditional haploinsufficiency in cerebral cortex recapitulates overgrowth in adulthood. A, Brain and anatomical region mass: total brain mass and cortex mass are increased in Emx1-Cre+; PtenloxP/+ mice. B, Total number of nuclei is increased in Emx1-Cre+; PtenloxP/+ cortex. C, Nuclei density is similar between control and Emx1-Cre+; PtenloxP/+ cortex. D, NeuN+/DAPI+ ratio is significantly decreased in Emx1-Cre+; PtenloxP/+ cortex. n = 6 for both control and Emx1-Cre+; PtenloxP/+. *p < 0.05. **p < 0.001. E, Representative images of immunostained control (top) and Emx1-Cre+; PtenloxP/+ (bottom) cortex, with magnified insets on the right. Red represents NeuN. Blue represents DAPI. Scale bar, 1 mm. All mice included in this figure are adults. Data are mean ± SEM.
Figure 7.
Figure 7.
Genetic reduction of Mtor or Rptor does not modify overgrowth of Pten+/− cerebral cortex in adulthood. A, Whole brain and region mass. No significant change is detected between Emx1-Cre+; PtenloxP/+; MtorloxP/+ and Emx1-Cre+; PtenloxP/+ mice. B, Total nuclei number in the cortex, measured using isotropic fractionator. No significant difference between Emx1-Cre+; PtenloxP/+; MtorloxP/+ and Emx1-Cre+; PtenloxP/+ cortex. C, Nuclei density is similar across all genotypes. Control: n = 5; Emx1-Cre+; PtenloxP/+: n = 4; Emx1-Cre+; MtorloxP/+: n = 5; Emx1-Cre+; PtenloxP/+; MtorloxP/+: n = 3. D, Representative images of immunostained control, Emx1-Cre+; PtenloxP/+, Emx1-Cre+; MtorloxP/+, and Emx1-Cre+; PtenloxP/+; MtorloxP/+ cortices (left panels), with magnified insets on the right. Red represents NeuN. Blue represents DAPI. Scale bar, 1 mm. E–G, Germline Rptor haploinsufficiency does not modify overgrowth or hyperplasia in cerebral cortex of germline Pten+/− mice. E, Brain and brain region mass, (F) total nuclei number in the cortex, and (G) nuclei density are similar across all genotypes. n = 4 for all genotypes. All mice included in this figure are adults. *p < 0.05. **p < 0.001. Data are mean ± SEM.
Figure 8.
Figure 8.
Genetic reduction of β-catenin suppresses overgrowth of conditional Pten+/− cerebral cortex in adulthood. A, Brain and anatomical region mass. Emx1-Cre+; PtenloxP/+; Ctnnb1loxP/+ cortex mass is significantly less than Emx1-Cre+; PtenloxP/+ cortex. B, Total nuclei number in the cortex, measured using isotropic fractionator. Emx1-Cre+; PtenloxP/+; Ctnnb1loxP/+ has significantly fewer than Emx1-Cre+; PtenloxP/+ cortex. C, Nuclei density in the cortex is similar among all groups. D, Ratio of nuclei positive for NeuN (neuronal marker) to total nuclei (DAPI+). The ratio in Emx1-Cre+; PtenloxP/+; Ctnnb1loxP/+ cortex is significantly higher than that of Emx1-Cre+; PtenloxP/+ cortex. E, Number of NeuN+ nuclei in the cortex is similar across all genotypes. F, Number of NeuN (non-neuronal) nuclei in the Emx1-Cre+; PtenloxP/+; Ctnnb1loxP/+ cortex is significantly less than that of Emx1-Cre+; PtenloxP/+ cortex. Control: n = 6; Emx1-Cre+; PtenloxP/+: n = 5; Emx1-Cre+; Ctnnb1loxP/+: n = 4; Emx1-Cre+; PtenloxP/+; Ctnnb1loxP/+: n = 6. All mice included in this figure are adults. *p < 0.05. **p < 0.001. Data are mean ± SEM. G, Representative images of immunostained control, Emx1-Cre+; PtenloxP/+, Emx1-Cre+; Ctnnb1loxP/+, and Emx1-Cre+; PtenloxP/+; Ctnnb1loxP/+ cortices (left panels), with magnified insets on the right. Red represents NeuN. Blue represents DAPI. Scale bar, 1 mm.
Figure 9.
Figure 9.
Effects of homozygous versus heterozygous conditional Pten mutations on cell number, density, neuronal ratio, and downstream signaling in the newborn cerebral cortex. A–D, Conditional deletion of Pten in the cortex leads to cortex overgrowth, increased cell number, and altered neuronal ratio at postnatal day 0 (P0). Control: n = 7; Emx1-Cre+; PtenloxP/+: n = 5; Emx1-Cre+; PtenloxP/loxP: n = 5. A, Brain and anatomical region mass. Pten dosage has nonlinear effects on whole brain, cortex, and remainder mass. B, Total nuclei number is increased in Emx1-Cre+; PtenloxP/+ and Emx1-Cre+; PtenloxP/loxP cortex compared with control, as measured using isotropic fractionator. No significant difference was observed between Emx1-Cre+; PtenloxP/+ and Emx1-Cre+; PtenloxP/loxP cortices. C, Nuclei density is significantly reduced in Emx1-Cre+; PtenloxP/loxP cortex compared with control or Emx1-Cre+; PtenloxP/+. No significant difference was observed between control and Emx1-Cre+; PtenloxP/+ cortex. D, NeuN+/DAPI+ ratio is significantly increased in Emx1-Cre+; PtenloxP/+ cortex, and it is significantly decreased in Emx1-Cre+; PtenloxP/loxP cortex, compared with control. E, Representative sagittal sections of control (top), Emx1-Cre+; PtenloxP/+ (middle), and Emx1-Cre+; PtenloxP/loxP (bottom) brains at P4. Right panels, Magnified images of the insets on the left panels. A floxed synaptophysin:tdTomato reporter (Ai34) is shown in red to visualize the pattern of Emx1-Cre-mediated recombination; blue represents DAPI staining. Scale bar, 1 mm. Scale bar, insets, 50 μm. F, p-Akt, p-GSK-3β, and p-S6 in Emx1-Cre+; PtenloxP/+ and Emx1-Cre+; PtenloxP/loxP cortices as determined by Western blot analysis. In Emx1-Cre+; PtenloxP/loxP cortex, levels of p-Akt, p-S6, and p-GSK-3β are increased relative to control cortex. In Emx1-Cre+; PtenloxP/+ cortex, p-Akt and p-GSK-3β, but not p-S6, are increased relative to controls. n = 5 for control, Emx1-Cre+; PtenloxP/+, and Emx1-Cre+; PtenloxP/loxP. *p < 0.05. **p < 0.001. Data are mean ± SEM. G, Simplified model of effects of homozygous versus heterozygous Pten mutations on mTOR-S6 signaling and cellular growth in the developing cortex.
Figure 10.
Figure 10.
Model of the impact of Pten haploinsufficiency on the trajectory of corticogenesis. In this model, Pten haploinsufficiency leads to an exaggeration of the normal processes of neurogenesis, neuronal apoptosis, and gliogenesis that occur during cerebral cortical development. During embryonic neurogenesis, excess neurons are produced throughout the cortex, with a relative increase in upper layers. Apoptosis during early postnatal life removes excess neurons, and excess glia are produced during postnatal gliogenesis. These cellular events may help explain why the magnitude of overgrowth in the Pten+/− brain is dynamic over development.

Similar articles

Cited by

References

    1. Aberle H, Bauer A, Stappert J, Kispert A, Kemler R. β-Catenin is a target for the ubiquitin-proteasome pathway. EMBO J. 1997;16:3797–3804. doi: 10.1093/emboj/16.13.3797. - DOI - PMC - PubMed
    1. Arnett HA, Fancy SP, Alberta JA, Zhao C, Plant SR, Kaing S, Raine CS, Rowitch DH, Franklin RJ, Stiles CD. bHLH transcription factor Olig1 is required to repair demyelinated lesions in the CNS. Science. 2004;306:2111–2115. doi: 10.1126/science.1103709. - DOI - PubMed
    1. Backman SA, Stambolic V, Suzuki A, Haight J, Elia A, Pretorius J, Tsao MS, Shannon P, Bolon B, Ivy GO, Mak TW. Deletion of Pten in mouse brain causes seizures, ataxia and defects in soma size resembling Lhermitte-Duclos disease. Nat Genet. 2001;29:396–403. doi: 10.1038/ng782. - DOI - PubMed
    1. Bonaguidi MA, Wheeler MA, Shapiro JS, Stadel RP, Sun GJ, Ming GL, Song H. In vivo clonal analysis reveals self-renewing and multipotent adult neural stem cell characteristics. Cell. 2011;145:1142–1155. doi: 10.1016/j.cell.2011.05.024. - DOI - PMC - PubMed
    1. Boylan CB, Blue ME, Hohmann CF. Modeling early cortical serotonergic deficits in autism. Behav Brain Res. 2007;176:94–108. doi: 10.1016/j.bbr.2006.08.026. - DOI - PMC - PubMed

Publication types

MeSH terms