. 2015 Oct 1;593(19):4453-69.
doi: 10.1113/JP270822. Epub 2015 Aug 19.

μ opioid receptor activation hyperpolarizes respiratory-controlling Kölliker-Fuse neurons and suppresses post-inspiratory drive

Affiliations

μ opioid receptor activation hyperpolarizes respiratory-controlling Kölliker-Fuse neurons and suppresses post-inspiratory drive

Erica S Levitt et al. J Physiol. .

Abstract

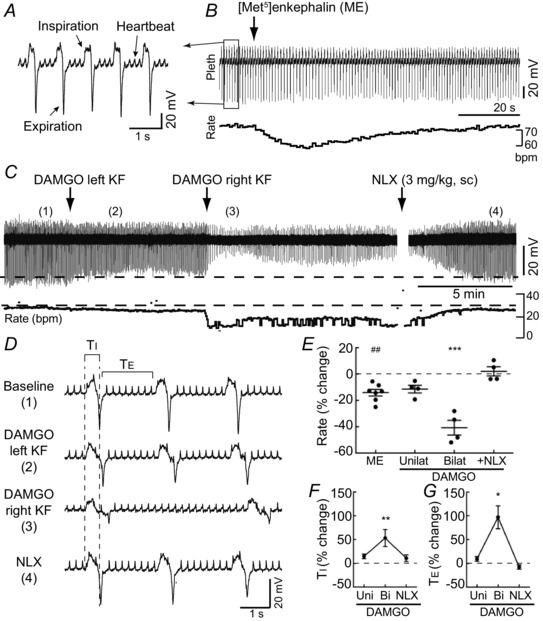
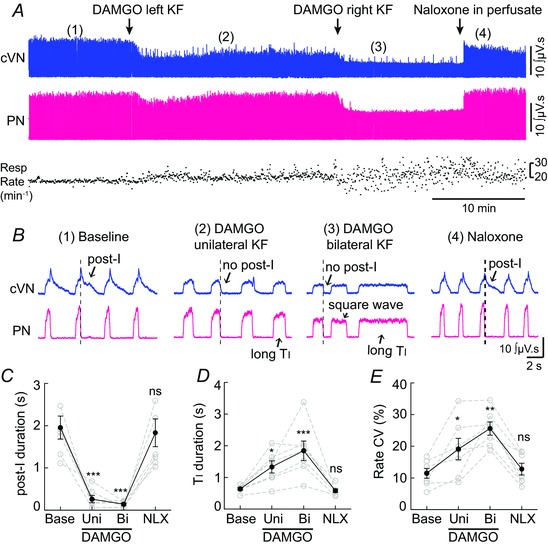
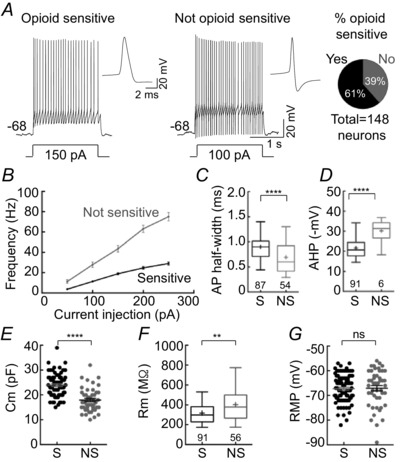
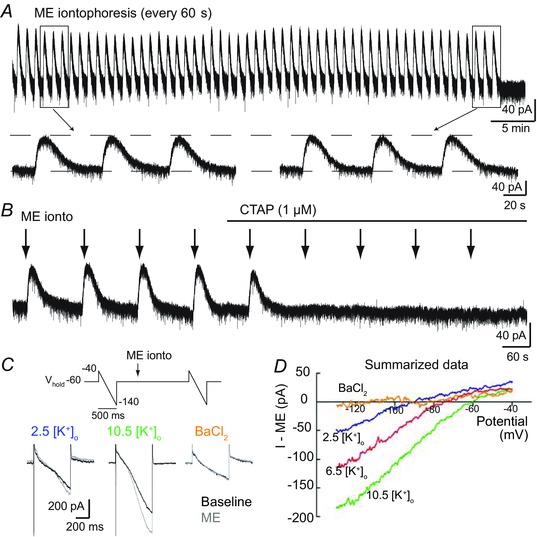
Key points: In addition to reductions in respiratory rate, opioids also cause aspiration and difficulty swallowing, indicating impairment of the upper airways. The Kölliker-Fuse (KF) maintains upper airway patency and a normal respiratory pattern. In this study, activation of μ opioid receptors in the KF reduced respiratory frequency and tidal volume in anaesthetized rats. Nerve recordings in an in situ preparation showed that activation of μ opioid receptors in the KF eliminated the post-inspiration phase of the respiratory cycle. In brain slices, μ opioid agonists hyperpolarized a distinct population (61%) of KF neurons by activation of an inwardly rectifying potassium conductance. These results suggest that KF neurons that are hyperpolarized by opioids could contribute to opioid-induced respiratory disturbances, particularly the impairment of upper airways.

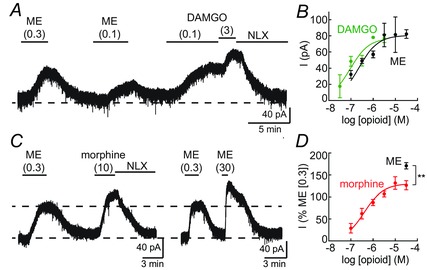
Abstract: Opioid-induced respiratory effects include aspiration and difficulty swallowing, suggesting impairment of the upper airways. The pontine Kölliker-Fuse nucleus (KF) controls upper airway patency and regulates respiration, in particular the inspiratory/expiratory phase transition. Given the importance of the KF in coordinating respiratory pattern, the mechanisms of μ opioid receptor activation in this nucleus were investigated at the systems and cellular level. In anaesthetized, vagi-intact rats, injection of opioid agonists DAMGO or [Met(5) ]enkephalin (ME) into the KF reduced respiratory frequency and amplitude. The μ opioid agonist DAMGO applied directly into the KF of the in situ arterially perfused working heart-brainstem preparation of rat resulted in robust apneusis (lengthened low amplitude inspiration due to loss of post-inspiratory drive) that was rapidly reversed by the opioid antagonist naloxone. In brain slice preparations, activation of μ opioid receptors on KF neurons hyperpolarized a distinct population (61%) of neurons. As expected, the opioid-induced hyperpolarization reduced the excitability of the neuron in response to either current injection or local application of glutamate. In voltage-clamp recordings the outward current produced by the opioid agonist ME was concentration dependent, reversed at the potassium equilibrium potential and was blocked by BaCl2 , characteristics of a G protein-coupled inwardly rectifying potassium (GIRK) conductance. The clinically used drug morphine produced an outward current in KF neurons with similar potency to morphine-mediated currents in locus coeruleus brain slice preparations. Thus, the population of KF neurons that are hyperpolarized by μ opioid agonists are likely mediators of the opioid-induced loss of post-inspiration and induction of apneusis.


Figures

Figure 1
Figure 1. Opioid injection into KF depressed respiratory rate in anaesthetized rats
Respiration was monitored in anaesthetized rats by inductance plethysmography. A, respiratory inductance plethysmography recording from boxed area in B. Changes in abdominal cavity volume during inspiration and expiration were detected for each breath. B, injection of opioid agonist ME (300 pmol) into the KF transiently reduced respiratory rate. Respiratory rate (below) was calculated from the plethysmography (Pleth) recording (above). bpm, breaths min−1. C, injection of peptidase‐resistant μ opioid agonist DAMGO (60 pmol) into KF (left, then right side) produced long‐lasting reduction of respiratory amplitude and rate. Opioid antagonist naloxone (NLX; 3 mg kg−1, s.c.) reversed the effects of DAMGO. Instantaneous respiratory rate (below) was determined from the plethysmography recording (above). D, sections of the plethysmography recording in C (location indicated by numbers in parentheses) shown on an expanded time‐scale. Bilateral DAMGO (3) increased inspiratory time (T I) and expiratory time (T E). E, summary of the change in respiratory rate from baseline (% change) induced by ME (unilateral) or DAMGO (unilateral and bilateral) injections into the KF. Naloxone (NLX) was administered (3 mg kg−1, s.c.) after bilateral DAMGO injection. Each data point represents an individual injection; line and error bar represent mean ± SEM. F and G, summary of the change in T I (F) and T E (G) from baseline (% change) induced by DAMGO injections (unilateral and bilateral) into KF and subsequent NLX (3 mg kg−1, s.c.). For ME injections, n = 7 unilateral injections (5 rats). For DAMGO injections, n = 4 rats. ## P < 0.01 compared to baseline by paired t test. *P < 0.05, **P < 0.01, ***P < 0.001 compared to baseline by repeated measures one‐way ANOVA and Bonferroni's post‐test. Statistics were performed on raw data, but illustrated as normalized data for clarity.
Figure 2
Figure 2. Opioid injection into KF produced apneusis
Recordings from central vagus nerve (cVN) and phrenic nerve (PN) were made using an in situ preparation of rat (see Methods). A, continuous recording of integrated cVN (top) and PN (bottom) activity. Instantaneous respiratory rate (min−1) is shown below. Injection of μ opioid agonist DAMGO (60 pmol) into KF (left, then right side) rapidly produced sustained alteration in cVN and PN activity. Addition of opioid antagonist naloxone (1 μm) to the reperfusion solution rapidly reversed the effects of DAMGO. B, expanded time scale of integrated cVN and PN activity during the experiment shown in A (location of sweep indicated by numbers in parentheses). (1) Baseline, a eupnoea‐like respiratory rhythm was observed with augmenting PN discharge and post‐inspiratory (post‐I) cVN activity. (2) Unilateral injection of DAMGO (60 pmol) into the KF reduced post‐I and increased inspiratory time (T I). (3) Bilateral injection of DAMGO (60 pmol) eliminated post‐I, further increased T I, reduced PN amplitude and caused a square wave PN burst, consistent with apneusis. (4) After naloxone (1 μm) was added to the perfusate, post‐I cVN activity, augmenting PN discharge and T I returned to baseline. C–E, post‐inspiratory duration, inspiratory (T I) duration, and coefficient of variation (CV) of respiratory rate were calculated for at least 50 respiratory cycles for each condition per rat. Grey symbols are the average for each individual rat; black symbols are group means ± SEM, n = 7 rats. *P < 0.05, **P < 0.01, ***P < 0.001, ns = not significant by repeated measures one‐way ANOVA and Bonferroni's post‐test of raw data.
Figure 3
Figure 3. KF neurons were identified in coronal and horizontal slices
A, image of a horizontal slice containing FluoSpheres 505/515 (10%) from a correctly placed KF injection of ME in vivo (left side) and a missed injection (right side). D, image of a coronal slice containing FluoSpheres (10%) from a correctly placed KF injection of DAMGO. B, E and F, semi‐schematic drawings of horizontal (B) and coronal (E and F) slices through rat pons containing KF area. Each drawing is half of a slice with midline at the right edge. Locations of KF injections are mapped by experiment. ME injections (orange; n = 7 injections in 5 rats) and missed ME injections (black; n = 6 injections) in anaesthetized rat experiments were identified in horizontal slices. DAMGO injections in anaesthetized rats (green) were identified in horizontal and coronal slices (n = 4 rats). DAMGO injections in the in situ preparation (pink) were identified in coronal slices (n = 7 rats). Bilateral DAMGO injections are mapped on the same side; pairs of injections are identified numerically. Brain slice recordings were made from KF neurons in the functionally identified locations. C and G, KF neurons in coronal and horizontal slices were filled with Neurobiotin (0.1% in the recording pipette) and visualized by confocal microscopy. Locations of the filled cells are indicated above (B and F). Neurons extended projections similarly in both slice orientations (coronal n = 7 cells/3 slices/2 rats; horizontal n = 9 cells/5 slices/2 rats). Scale bar = 50 μm. KF, Kölliker–Fuse; scp, superior cerebellar peduncle; lpb, lateral parabrachial area; mpb, medial parabrachial area; exl, external lateral parabrachial area; mcp, middle cerebellar peduncle; me5, mesencephalic 5 nucleus; IC, inferior colliculus; Pr5, principal sensory 5 nucleus; VLL, ventral lateral lemniscus; 4 V, fourth ventricle; +, location of LC in more dorsal slice.
Figure 4
Figure 4. Opioids hyperpolarized and reduced the excitability of KF neurons
Whole cell recordings were made from KF neurons contained in rat brain slices. A, bath perfusion of opioid agonist ME (1 μm) produced an outward current in voltage‐clamp recordings (top) and a corresponding hyperpolarization in current‐clamp recordings (bottom). Resting membrane potential (RMP) of this cell was –60 mV. B, current‐clamp recording of KF neuron (RMP = −65 mV). Iontophoretic application of glutamate (50 ms) produced action potentials. Bath perfusion of ME (3 μm) hyperpolarized the cell and prevented glutamate‐induced firing of action potentials. Depolarization and firing was blocked by perfusion of AMPA and NMDA antagonists DNQX (10 μm) and MK801 (10 μm). C, summary of the number of glutamate‐induced action potentials (APs) fired at baseline, in ME (3 μm) and after wash. Data from individual experiments are plotted, n = 6–7. *P < 0.05, ***P < 0.001, ns = not significant by repeated measures one‐way ANOVA and Bonferroni's post‐test. D, injection of current (250 pA) caused firing that decremented in frequency, but persisted for the duration of the current step (2 s). Perfusion of ME (3 μm) hyperpolarized the cell and prevented firing, which reversed when ME was washed from the slice. E, summary of firing frequency (average for entire step excluding initial burst of 2–5 APs) by current injection (50–250 pA). Data are means ± SEM, n = 4–5. Bath perfusion of ME (0.3 μm) reduced firing frequency (##, two‐way ANOVA, F (4,23) = 4.418, P < 0.01). Perfusion of ME (3 μm) nearly eliminated firing (###, two‐way ANOVA, F (4,28) = 20.15, P < 0.0001). Firing rate after ME wash was not different from baseline (two‐way ANOVA, F (4,23) = 1.615, P = 0.20).
Figure 5
Figure 5. Population of opioid‐sensitive KF neurons
Whole cell recordings from KF neurons in brain slice. KF neurons were divided into two populations based on opioid sensitivity as determined by the presence (or absence) of an opioid‐mediated hyperpolarizing current (sensitive (S) or not sensitive (NS)). The proportion of KF neurons that were opioid sensitive was 61%. A, action potentials recorded during current injection in opioid sensitive (left) or not sensitive neuron (right). Insets, averaged action potential for each neuron during 50, 100 and 150 pA current steps (left = 25 APs; right = 33 APs). B, summary of firing frequency by current injection. Data are means ± SEM, n = 56–86. Opioid‐sensitive neurons fired significantly slower than not sensitive neurons (two‐way ANOVA, F (1681) = 409.5, P < 0.0001). C and D, box and whiskers plot of the action potential half‐width and after‐hyperpolarization of sensitive (S) and not sensitive (NS) KF neurons. Boxes are median and interquartile range (‘+’ at mean); whiskers are 5–95 percentile; n = 56–87. E, F and G, capacitance, resistance and resting membrane potential of sensitive and not sensitive KF neurons. Data are plotted as individual data points with mean ± SEM (line and error) or as box and whiskers (as above); n = 45–92. **P < 0.01, ****P < 0.0001 by Mann–Whitney test (C, D and F) or unpaired t test (E), ns = not significant by unpaired t test. S, opioid sensitive; NS, not opioid sensitive.
Figure 6
Figure 6. μ opioid receptors on KF neurons activate GIRK
Whole cell voltage‐clamp recordings from opioid‐sensitive KF neurons. A, ME was applied by iontophoresis (7–20 nA, 2–3 s) once every 60 s, which produced a transient, reproducible outward current for up to 1 h. Boxed areas from the beginning and end of the recording are shown on an expanded time scale below. B, the ME‐induced current was eliminated by perfusion of the selective μ opioid receptor antagonist CTAP (1 μm); n = 3. C, top, protocol for voltage ramps (−100 mV, 500 ms) applied before and at the peak of ME iontophoresis. Below are representative superimposed traces at baseline (black) and during ME iontophoresis (grey) in normal extracellular potassium (2.5 mm), elevated extracellular potassium (10.5 mm) or with the potassium channel blocker BaCl2 (100 μm). D, summary graph of the ME‐induced current–voltage relationship in the presence of various extracellular potassium concentrations (mm) or BaCl2 (100 μm). Data are plotted as means; n = 4–5 cells.
Figure 7
Figure 7. Sensitivity to agonists
Whole cell voltage‐clamp recordings from opioid‐sensitive KF neurons. A, bath perfusion of various concentrations of opioid agonists ME, DAMGO and morphine (μm) were used to determine concentration–response relationships. ME readily washed from the slice. The currents produced by DAMGO and morphine were reversed by the opioid antagonist naloxone (NLX, 1 μm). B, concentration–response curves for ME and DAMGO. Data are means ± SEM, n = 3–54 per concentration. EC50 of ME = 226 nm (95% CI: 142–362 nm); EC50 of DAMGO = 90 nm (95% CI: 42–192 nm). C, example recordings of currents produced by saturating concentrations of morphine (10 μm) and ME (30 μm) compared to a low concentration of ME (0.3 μm). D, morphine concentration–response curve. The current amplitude produced by morphine (0.1–30 μm) or ME (30 μm) was normalized to the amplitude of the current produced by ME (0.3 μm). Data are means ± SEM, n = 3–11 per concentration. EC50 of morphine = 406 nm (95% CI: 200–820 nm). **P < 0.01 by unpaired t test.

Similar articles

Cited by

References

    1. Bagley EE, Chieng BCH, Christie MJ & Connor M (2005). Opioid tolerance in periaqueductal gray neurons isolated from mice chronically treated with morphine. Br J Pharmacol 146, 68–76. - PMC - PubMed
    1. Bautista TG & Dutschmann M (2014. a). Inhibition of the pontine Kölliker‐Fuse nucleus abolishes eupneic inspiratory hypoglossal motor discharge in rat. Neuroscience 267, 22–29. - PubMed
    1. Bautista TG & Dutschmann M (2014. b). Ponto‐medullary nuclei involved in the generation of sequential pharyngeal swallowing and concomitant protective laryngeal adduction in situ . J Physiol 592, 2605–2623. - PMC - PubMed
    1. Burke PGR, Abbott SBG, McMullan S, Goodchild AK & Pilowsky PM (2010). Somatostatin selectively ablates post‐inspiratory activity after injection into the Bötzinger complex. Neuroscience 167, 528–539. - PubMed
    1. Chakravarthy B, Shah S & Lotfipour S (2012). Prescription drug monitoring programs and other interventions to combat prescription opioid abuse. West J Emerg Med 13, 422–425. - PMC - PubMed

Publication types