

Huntingtin proteolysis releases non-polyQ fragments that cause toxicity through dynamin 1 dysregulation
- PMID: 26165689
- PMCID: PMC4585462
- DOI: 10.15252/embj.201490808
Huntingtin proteolysis releases non-polyQ fragments that cause toxicity through dynamin 1 dysregulation
Abstract
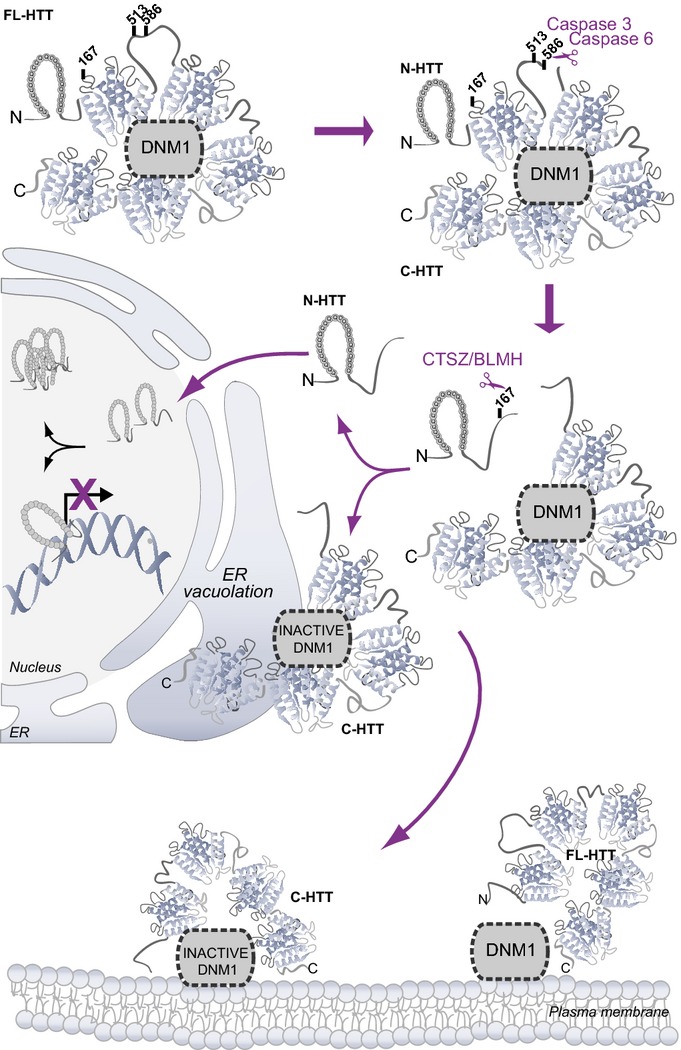
Cleavage of mutant huntingtin (HTT) is an essential process in Huntington's disease (HD), an inherited neurodegenerative disorder. Cleavage generates N-ter fragments that contain the polyQ stretch and whose nuclear toxicity is well established. However, the functional defects induced by cleavage of full-length HTT remain elusive. Moreover, the contribution of non-polyQ C-terminal fragments is unknown. Using time- and site-specific control of full-length HTT proteolysis, we show that specific cleavages are required to disrupt intramolecular interactions within HTT and to cause toxicity in cells and flies. Surprisingly, in addition to the canonical pathogenic N-ter fragments, the C-ter fragments generated, that do not contain the polyQ stretch, induced toxicity via dilation of the endoplasmic reticulum (ER) and increased ER stress. C-ter HTT bound to dynamin 1 and subsequently impaired its activity at ER membranes. Our findings support a role for HTT on dynamin 1 function and ER homoeostasis. Proteolysis-induced alteration of this function may be relevant to disease.
Keywords: Drosophila; ER dilation; Huntington's disease; TEV proteolysis; endoplasmic reticulum.
© 2015 The Authors.
Figures
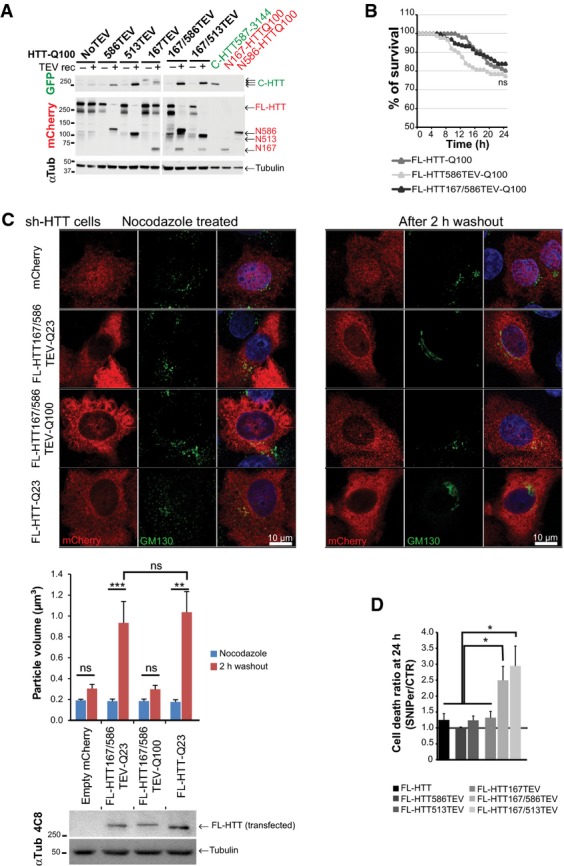
Immunoblotting analyses of HTT N-ter and C-ter fragments generated after cleavage of the indicated constructs expressed in HEK293T cells and using recombinant TEV system. “no TEV” referred to FL-HTT-Q100 constructs, without TEVrcs.
Survival curves of striatal cells expressing FL-HTT constructs containing no TEV, one or two TEVrcs. Toxicity is expressed as the percentage of survival over time.
FL-HTT constructs with TEV sequence insertions at positions 167 and 586 are as functional as FL-HTT on the dynein-dependent Golgi reassembly assay. Upper panels show representative HeLa cells stably silenced for endogenous HTT and that re-express FL-HTT167/586TEV-Q23, HTT167/586TEV-Q100 or FL-HTT-Q23 and treated with nocodazole for 2 h (left panels) and after 2-h washout (right panels). Western blotting shows the expression level of transfected FL-HTT in sh-HTT cell line.
Graph summarising cell death ratio at 24 h of FL-HTTTEV-Q100 analysed in Fig1D. HTT proteolysis-induced toxicity is shown as a ratio of the percentage of cell death obtained in SNIPer-TEV condition over pcDNA condition.
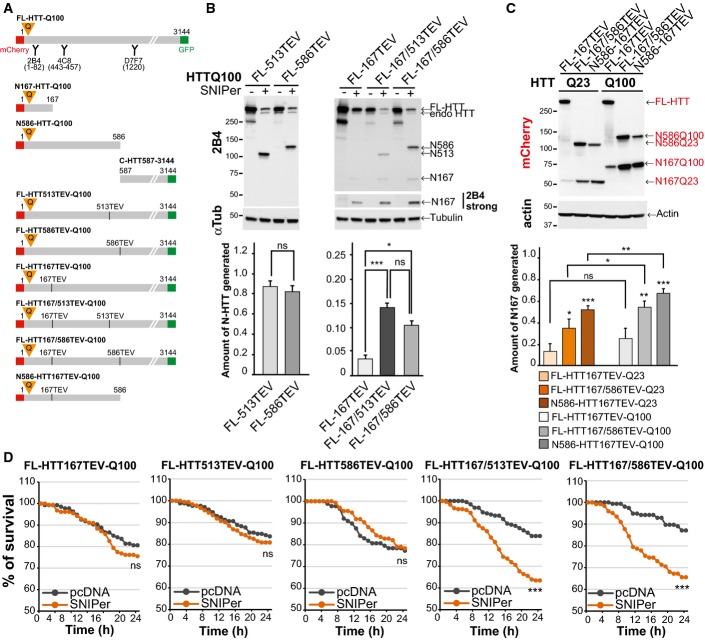
Schematic representations of N-ter, C-ter or full-length polyQ-HTT constructs used and location of antibody epitopes and tags.
Analyses of HTT N-ter fragments generated after cleavage of the indicated HTT-TEV-Q100 constructs by the SNIPer-TEV in HEK293T cells at 24 h.
Analyses of HTT N167 fragments generated upon cleavage of wild-type and mutant HTT (24 h) in striatal cells.
Survival of striatal cells upon SNIPer-TEV-induced cleavage of FL-HTT-TEV-Q100.
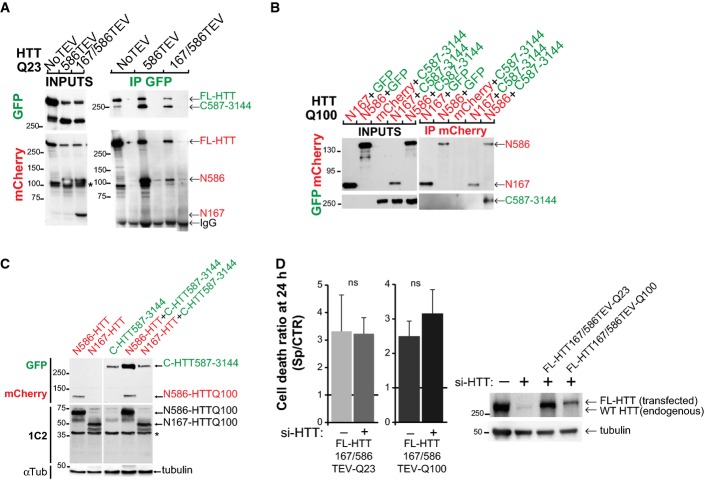
Immunoprecipitations upon cleavage of FL-HTT-TEV-Q23 by the SNIPer-TEV performed in HEK293T cell. * indicates a non-specific band.
Immunoprecipitations of HeLa cell extracts expressing mCherry-N-HTTQ100 constructs or mCherry and C-HTT587-3144-GFP or GFP using anti-mCherry antibody.
Immunoblotting analysis of the expression level of N- and C-HTT alone or in combination with striatal cells. * indicates a non-specific band.
Toxicity in striatal cells transfected with FL-HTT167/586TEV-Q23 and FL-HTT167/586TEV-Q100 and siRNA targeted against endogenous HTT (si-HTT). Graph summarising cell death ratio at 24 h of proteolysis-induced toxicity is shown as a ratio of the percentage of cell death obtained in SNIPer-TEV condition over pcDNA condition. Downregulation of HTT expression was assessed by immunoblotting (right). The bar graphs (mean ± SEM) display pooled data from two to four independent experiments. Total number of cells is as follows: FL-HTT167/586TEV-Q23 without si-HTT: 399 cells; with si-HTT: 230 cells; FL-HTT167/586TEV-Q100 without si-HTT: 430 cells; with si-HTT: 199 cells. Statistics were done by unpaired t-test. ns: non-significant.
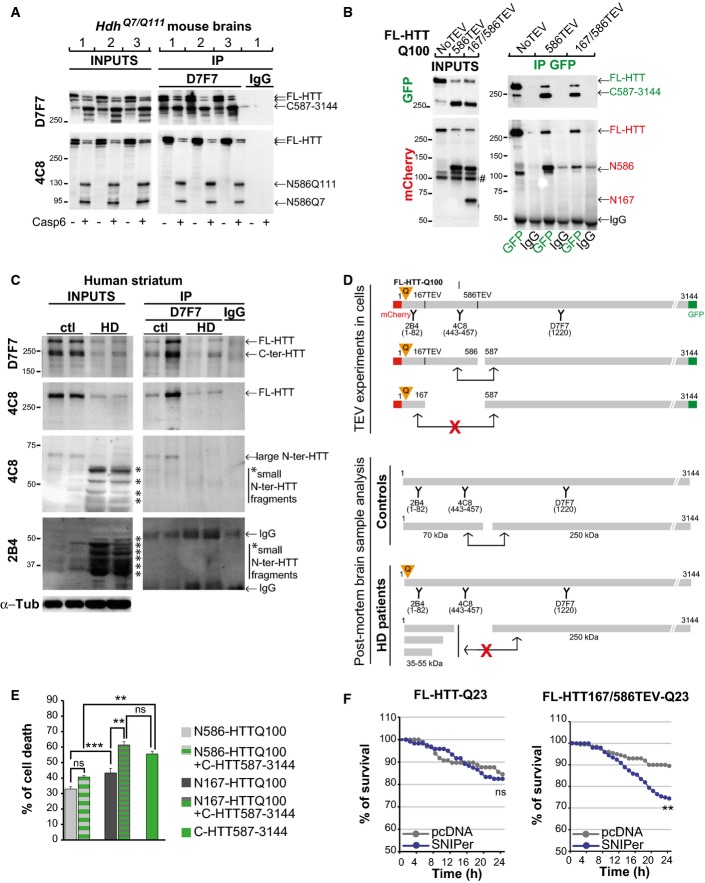
Protein lysates from HdhQ7/Q111 mouse brains were cleaved with recombinant caspase-6, and generated N-ter and C-ter fragments were subjected to immunoprecipitation.
Immunoprecipitation performed in HeLa cells upon cleavage of FL-HTT-TEV-Q100. # indicates a non-specific band.
Immunoblotting analysis of HTT proteolysis and co-immunoprecipitation of HTT C-ter and N-ter fragments in post-mortem control and HD human striatum samples. Asterisks indicate the position of small N-ter fragments.
Schematic representation of antibody epitope locations and interactions between various HTT fragments generated in cells and in human brain samples.
Cell death induced by the indicated HTT constructs in transfected striatal cells.
Survival curves of striatal cells upon cleavage of FL-HTT-TEV-Q23.
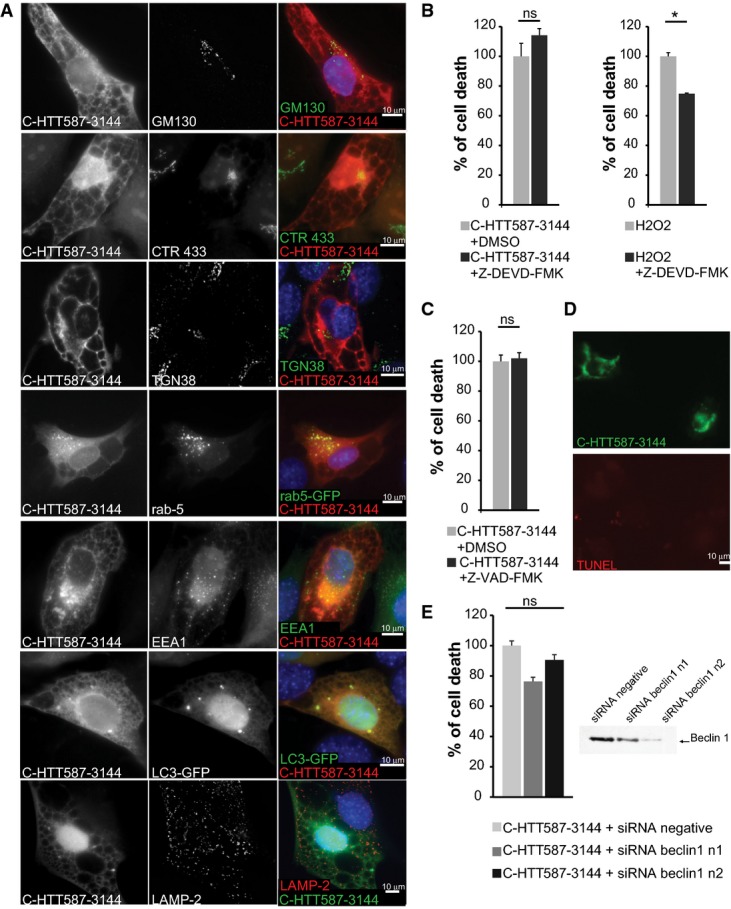
Immunostainings of striatal cells transfected with mCherry-tagged C-HTT587-3144 fragment. Golgi apparatus compartments were immunostained with anti-GM130 (cis-Golgi), anti-CTR433 (medial-Golgi) and anti-TGN38 (trans-Golgi) antibodies. Early endosomes were either stained with anti-EEA1 or labelled with Rab5-GFP-expressing constructs. LC3-GFP-labelled autophagosomes and lysosomes were immunostained with anti-LAMP2.
Left: Striatal cells transfected with C-HTT587-3144 were treated with Z-DEVD-FMK, a caspase-3 inhibitor and analysed for cell death. Right: Non-transfected cells were treated for 2 h with 1 mM of H2O2 and Z-DEVD-FMK.
Toxicity in striatal cells transfected with C-HTT587-3144 and treated with Z-VAD-FMK.
Assessment of DNA fragmentation in C-HTT587-3144-expressing striatal cells using a TUNEL assay.
Toxicity in striatal cells transfected with C-HTT587-3144 fragment and siRNA targeted against Beclin-1 (two independent siRNA n1 & n2). Downregulation of Beclin-1 expression was assessed by immunoblotting.
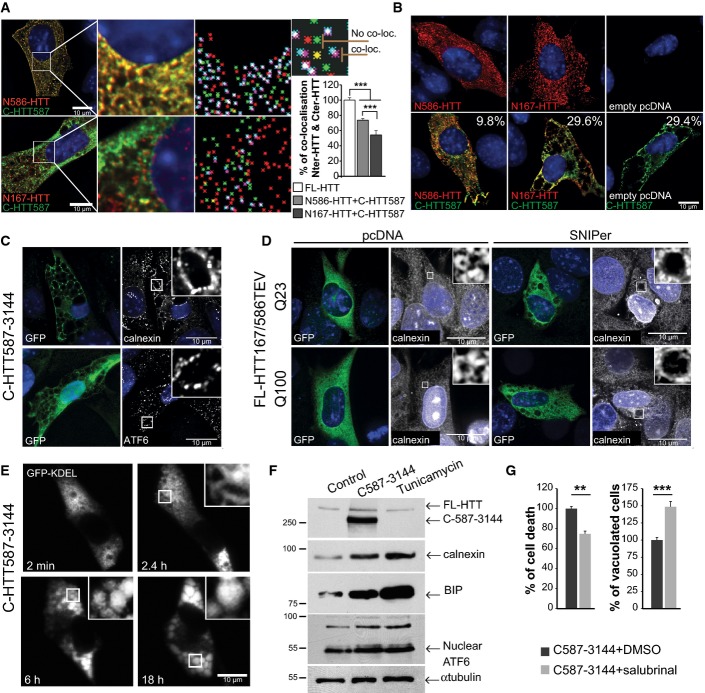
Immunostaining of striatal cells transfected with C-HTT587-3144 (GFP) and N-HTTQ100 constructs (mCherry). Co-localisation was measured using the JACoP plugin (ImageJ, see Appendix Supplementary Materials and Methods). Maps illustrating the mass centre of particles from the two fluorophores are shown in the right column. Loc stands for localisation. Graph indicates the mean percentage of co-localisation between fragments. mCherry- and GFP-tagged FL-HTT are used as reference (100%).
Immunostaining of striatal cells expressing the indicated constructs. Values indicate the percentage of cells undergoing cytoplasmic vacuolation.
C-HTT587-3144-expressing striatal cells immunostained with anti-calnexin and anti-ATF6 antibodies.
Immunostaining of calnexin shows ER dilation upon cleavage of HTT167/586TEV-Q100 or Q23 (anti-GFP) in striatal cells.
Time-lapse imaging of luminal ER marker (GFP-KDEL) in a C-HTT587-3114-expressing striatal cells.
ER stress chaperones are upregulated in C-HTT587-3144-GFP striatal cells. Tunicamycin was used as a control for ER stress.
Cell death and vacuolation after treatment with salubrinal, an ER stress inhibitor in striatal cells.
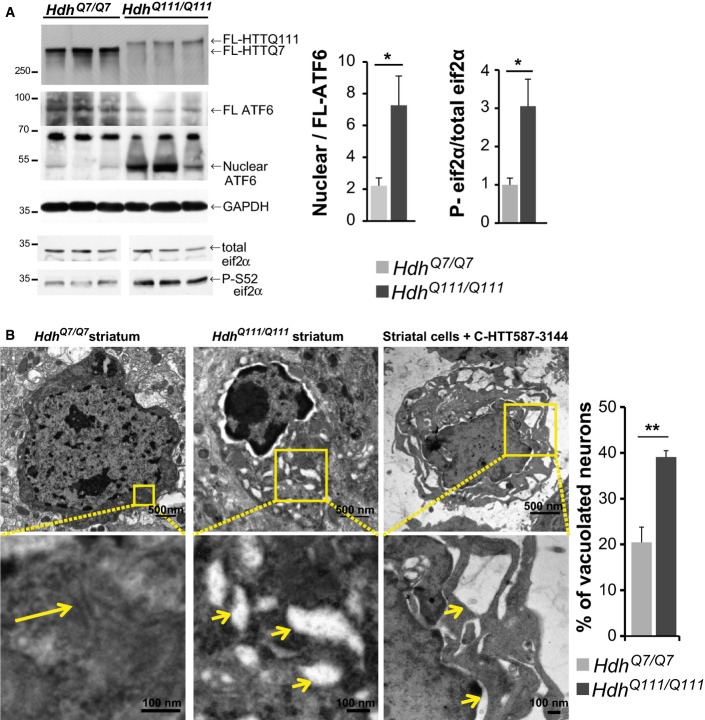
Activation of ER stress in HdhQ111/Q111 knock-in HD mouse model compared to wild-type HdhQ7/Q7 mice.
Electron microscopy analysis of striatal sections from 20-month-old HdhQ7/Q7 (left), HdhQ111/Q111 mice (middle) and striatal cells expressing the C-HTT587-3144 construct (right). The long arrow indicates ER, and the small ones depict vacuolated ER.
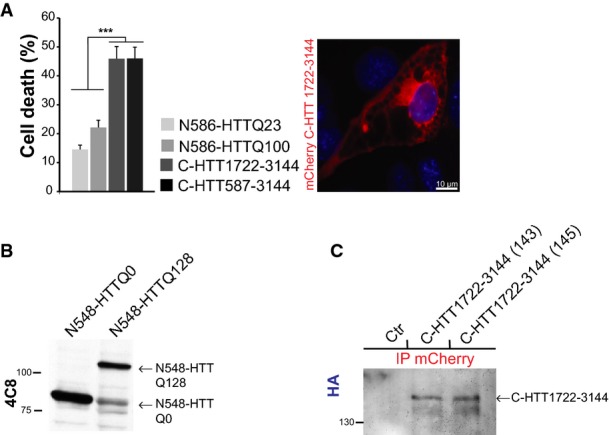
Analysis of C-HTT1722–3144 toxicity in striatal cells (left) and representative image of vacuolation in C-HTT1722–3144-expressing cells (right). The graph (mean ± SEM) displays pooled data from three independent experiments in duplicate. Total number of cells is as follows: N586-HTTQ23: 2285, N586-HTTQ100: 1698, C-HTT1722–3144: 483, C-HTT587-3144: 708. Statistics were done by one-way ANOVA with Bonferroni’s multiple comparison test, ***P < 0.001.
Assessment of N548-HTT transgene expression on total brain lysates of adult flies (4 days of age) by immunoblotting.
Detection of C-HTT1722–3144 transgenes in two independent fly strains (143, 145) by immunoprecipitation. Control flies (ctr) are W1118 flies.
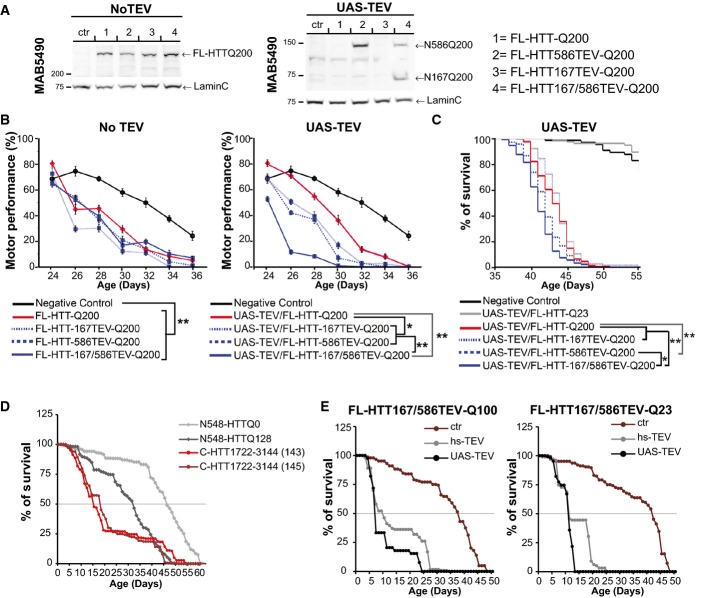
A Expression analysis of FL-HTT-TEV-Q200 in Drosophila.
B Charts showing motor performance in climbing tests as a function of age.
C–E Kaplan–Meier chart depicts survivorship in flies. Expression of the TEV was under an UAS or heat-shock (hs) promoter.
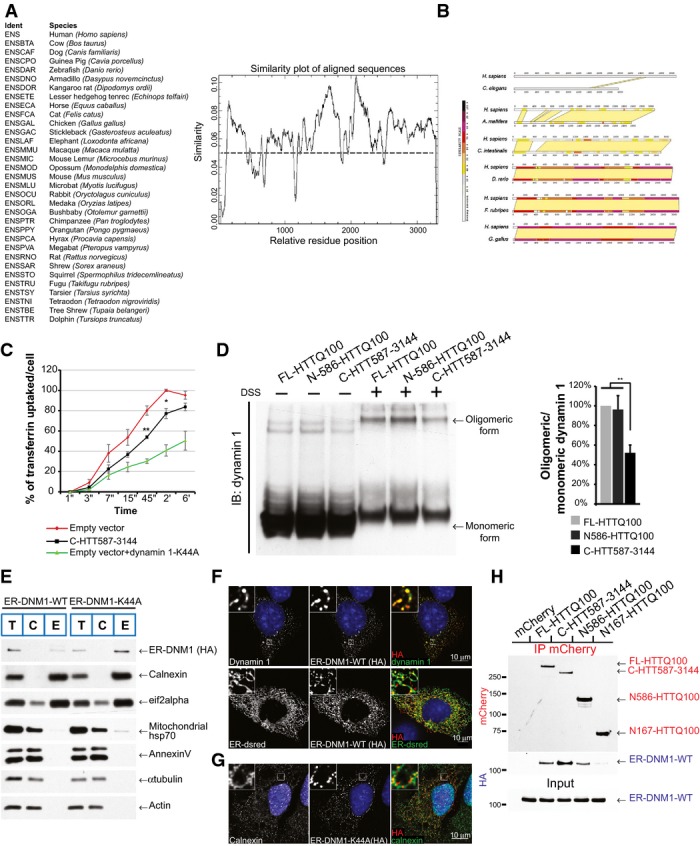
A Identification of conserved regions in huntingtin. Search of primary sequence of HTT orthologues for highly conserved regions. Analysis of 32 orthologous sequences and generation of a residue conservation plot using the EMBOSS package tool “plocon”. Smoothing was applied to the results revealing regions with higher degrees of identity.
B Pairwise comparison of human HTT versus C. elegans, A. mellifera, C. intestinalis, D. rerio, F. rubripes or G. gallus Htt. Very N-ter part of HTT (residues 170–400) and regions starting from 1200 to 3144 showed high similarity between the different species.
C Assessment of dynamin 1 activity by transferrin uptake in striatal cells. GFP-tagged dynamin 1-K44A construct was used as a positive control for endocytosis inhibition. The curves indicate the percentage of transferrin uptake over time in s (‘‘) and min (‘).
D Dynamin 1 oligomeric profile in HTT-expressing cells treated or not with DSS, a non-cleavable cross-linker. HEK293T cells were transfected with the indicated HTT fragments and dynamin 1. Endogenous HTT was downregulated using siRNA which do not target the HTT constructs.
E Localisation of engineered ER-targeted dynamin 1 (ER-DNM1-WT or ER-DNM1-K44A) constructs at ER by cellular fractionation in striatal cells. Total (T), cytosolic (C) and ER membrane (E) fractions. ER-DNM1 was detected using anti-HA.
F, G Analysis of localisation of engineered ER-targeted dynamin 1 (ER-DNM1-WT or ER-DNM1-K44A) using anti-HA immunostaining in striatal cells. Note the artificial high co-localisation on ER network as shown by immunostaining with ER-dsRed and calnexin.
H Striatal cells expressing the indicated mCherry-tagged HTT fragments and ER-DNM1-WT were subjected to immunoprecipitation and analysed by immunoblotting.
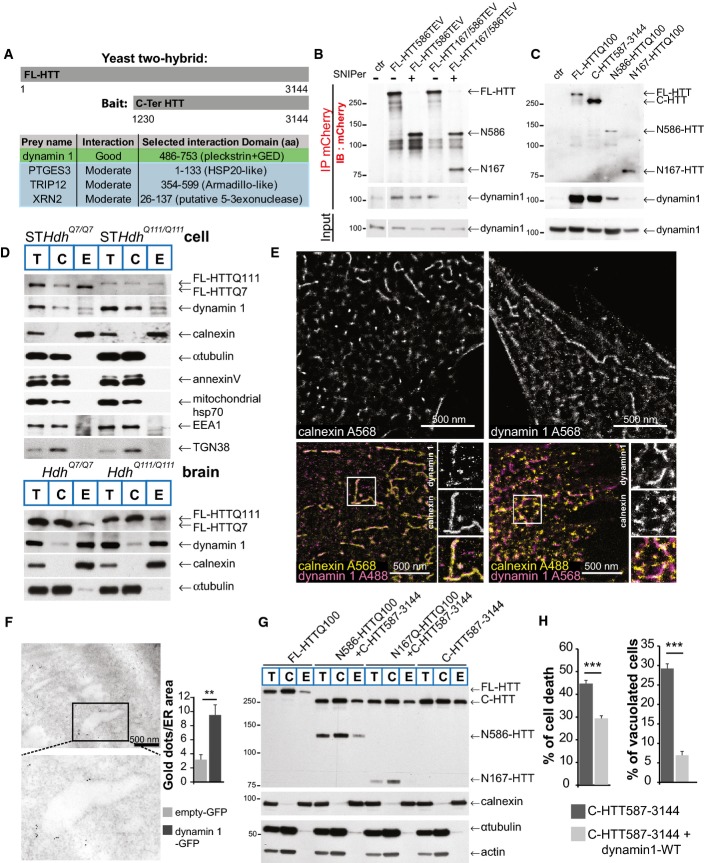
A Schematic representation of the bait used in the yeast two-hybrid screen and list of the four confident interactors with their HTT-interacting domains.
B, C HeLa cells expressing HTT-TEV (B) or HTT fragments (C) with dynamin 1 were subjected to immunoprecipitation and immunoblotting analyses.
D Cellular fractionation analysis of striatal cells or Hdh mice model. Total (T), cytosolic (C) and ER membrane (E) fractions.
E Localisation of dynamin 1 at ER membranes (calnexin immunostaining) using dSTORM method in striatal cells.
F Immuno-electron microscopy analyses of dynamin 1 at ER in striatal cells. Enlargement indicates an ER tubule.
G Cellular fractionation and ER localisation of HTT fragments expressed in striatal cells.
H Cell death (left) and vacuolation (right) analysis in C-HTT587-3144 cells co-expressing WT-dynamin 1 in striatal cells.
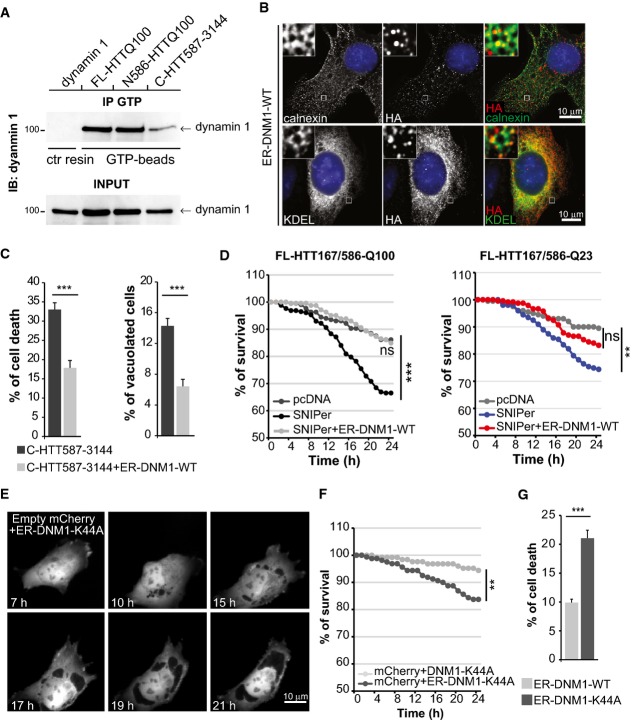
GTP-bound dynamin 1 levels were analysed in ER-enriched membranes from HEK293T cells expressing the indicated HTT constructs.
Immunostaining of engineered artificially ER-targeted DNM1-WT (anti-HA) and ER network (calnexin and GFP-KDEL markers) expressed in striatal cells.
Analysis of toxicity and vacuolation of striatal cells expressing C-HTT587-3144 fragment and ER-DNM1-WT.
Survival curves upon cleavage of FL-HTT167/586TEV co-expressing ER-DNM1-WT in striatal cells.
Time-lapse analysis by fluorescence live microscopy of striatal cells co-expressing an empty mCherry vector with ER-DNM1-K44A vector.
Survival curves of striatal cells expressing empty mCherry vector and DNM1-K44A or ER-DNM1-K44A.
Quantification of cell death induced by ER-targeted wild-type and mutant dynamin 1 in striatal cells
Comment in
-
Huntington's disease--the sting in the tail.EMBO J. 2015 Sep 2;34(17):2215-6. doi: 10.15252/embj.201592467. Epub 2015 Jul 28. EMBO J. 2015. PMID: 26224597 Free PMC article.
Similar articles
-
Huntington's disease--the sting in the tail.EMBO J. 2015 Sep 2;34(17):2215-6. doi: 10.15252/embj.201592467. Epub 2015 Jul 28. EMBO J. 2015. PMID: 26224597 Free PMC article.
-
Caspase 3-cleaved N-terminal fragments of wild-type and mutant huntingtin are present in normal and Huntington's disease brains, associate with membranes, and undergo calpain-dependent proteolysis.Proc Natl Acad Sci U S A. 2001 Oct 23;98(22):12784-9. doi: 10.1073/pnas.221451398. Proc Natl Acad Sci U S A. 2001. PMID: 11675509 Free PMC article.
-
Cdk5 phosphorylation of huntingtin reduces its cleavage by caspases: implications for mutant huntingtin toxicity.J Cell Biol. 2005 May 23;169(4):647-56. doi: 10.1083/jcb.200412071. J Cell Biol. 2005. PMID: 15911879 Free PMC article.
-
The emerging role of the first 17 amino acids of huntingtin in Huntington's disease.Biomol Concepts. 2015 Mar;6(1):33-46. doi: 10.1515/bmc-2015-0001. Biomol Concepts. 2015. PMID: 25741791 Free PMC article. Review.
-
The Biology of Huntingtin.Neuron. 2016 Mar 2;89(5):910-26. doi: 10.1016/j.neuron.2016.02.003. Neuron. 2016. PMID: 26938440 Review.
Cited by
-
Effects of flanking sequences and cellular context on subcellular behavior and pathology of mutant HTT.Hum Mol Genet. 2020 Mar 13;29(4):674-688. doi: 10.1093/hmg/ddaa001. Hum Mol Genet. 2020. PMID: 31943010 Free PMC article.
-
Huntington's Disease-An Outlook on the Interplay of the HTT Protein, Microtubules and Actin Cytoskeletal Components.Cells. 2020 Jun 22;9(6):1514. doi: 10.3390/cells9061514. Cells. 2020. PMID: 32580314 Free PMC article. Review.
-
Site-Specific Phosphorylation of Huntingtin Exon 1 Recombinant Proteins Enabled by the Discovery of Novel Kinases.Chembiochem. 2021 Jan 5;22(1):217-231. doi: 10.1002/cbic.202000508. Epub 2020 Oct 13. Chembiochem. 2021. PMID: 32805086 Free PMC article.
-
Effect of post-mortem delay on N-terminal huntingtin protein fragments in human control and Huntington disease brain lysates.PLoS One. 2017 Jun 1;12(6):e0178556. doi: 10.1371/journal.pone.0178556. eCollection 2017. PLoS One. 2017. PMID: 28570578 Free PMC article.
-
ER stress and the unfolded protein response in neurodegeneration.Nat Rev Neurol. 2017 Aug;13(8):477-491. doi: 10.1038/nrneurol.2017.99. Epub 2017 Jul 21. Nat Rev Neurol. 2017. PMID: 28731040 Review.
References
-
- Atwal RS, Xia J, Pinchev D, Taylor J, Epand RM, Truant R. Huntingtin has a membrane association signal that can modulate huntingtin aggregation, nuclear entry and toxicity. Hum Mol Genet. 2007;16:2600–2615. - PubMed
-
- Cattaneo E, Zuccato C, Tartari M. Normal huntingtin function: an alternative approach to Huntington’s disease. Nat Rev Neurosci. 2005;6:919–930. - PubMed
Publication types
MeSH terms
Substances
LinkOut - more resources
Full Text Sources
Other Literature Sources
Medical
Molecular Biology Databases
