. 2015 Jul 9;13(7):e1002191.
doi: 10.1371/journal.pbio.1002191. eCollection 2015 Jul.

Biofilm Formation As a Response to Ecological Competition

Affiliations

Biofilm Formation As a Response to Ecological Competition

Nuno M Oliveira et al. PLoS Biol. .

Erratum in

Abstract

Bacteria form dense surface-associated communities known as biofilms that are central to their persistence and how they affect us. Biofilm formation is commonly viewed as a cooperative enterprise, where strains and species work together for a common goal. Here we explore an alternative model: biofilm formation is a response to ecological competition. We co-cultured a diverse collection of natural isolates of the opportunistic pathogen Pseudomonas aeruginosa and studied the effect on biofilm formation. We show that strain mixing reliably increases biofilm formation compared to unmixed conditions. Importantly, strain mixing leads to strong competition: one strain dominates and largely excludes the other from the biofilm. Furthermore, we show that pyocins, narrow-spectrum antibiotics made by other P. aeruginosa strains, can stimulate biofilm formation by increasing the attachment of cells. Side-by-side comparisons using microfluidic assays suggest that the increase in biofilm occurs due to a general response to cellular damage: a comparable biofilm response occurs for pyocins that disrupt membranes as for commercial antibiotics that damage DNA, inhibit protein synthesis or transcription. Our data show that bacteria increase biofilm formation in response to ecological competition that is detected by antibiotic stress. This is inconsistent with the idea that sub-lethal concentrations of antibiotics are cooperative signals that coordinate microbial communities, as is often concluded. Instead, our work is consistent with competition sensing where low-levels of antibiotics are used to detect and respond to the competing genotypes that produce them.


Conflict of interest statement

The authors have declared that no competing interests exist.

Figures

Fig 1
Fig 1. Effect of clinical antibiotics and strain mixing on biofilm formation of P. aeruginosa.
A) Increasing concentrations of three antibiotics from different classes, ciprofloxacin (Cip), rifampicin (Rif), and tetracycline (Tet), reduce the optical density of strain PAO1 shaking cultures. B) Under static conditions, sub-lethal concentrations of antibiotics induce biofilm formation. C) Mixing different natural isolates of P. aeruginosa induces biofilm formation in an assay with increasing numbers of strains. The y-axis of box plots represents the biofilm index of each strain and mixtures, which is the ratio of biofilm to planktonic cell density (A595/A600). This measure controls for the large variability in overall growth between the strains and is a way to assess biofilm relative to the amount of planktonic cells [49]. The biofilm index increases with the more strains present (2-tailed Spearman rank correlation, non-normal data, n = 52, ρ = 0.305, p = 0.025). D) Mixing increases biofilm formation in two pairwise combinations of strains (1 + 4 and 4 + 69) in which the initial proportion of each strain was varied. Panels A, B, and D show means and 95% confidence intervals. Error bars are too small to see in some cases, particularly for the planktonic data. Find numerical values in S1 Data.
Fig 2
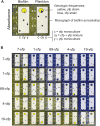
Fig 2. Round-robin tournament among natural isolates of P. aeruginosa showing strong competitive effects upon strain mixing.
Five isolates were mixed together in all pairwise combinations and data from each mixture are shown in a corresponding panel. A) Example data from strains 4 and 1 illustrating the different measures in a given mixture. In this example, mixing the two strains increases biofilm, decreases planktonic cells, and strain 1 (yfp-labeled) strain strongly outcompetes strain 4 (cfp-labeled) strain. B) All data from the round-robin tournament. As in panel A, the backdrop to each panel is an epifluorescence image of the coculture biofilm from a coverslip. All other data shown are from 96-well microtiter experiments. Specifically, the left-hand side graph in each panel shows information about the biofilm. Here, the plotted points show biofilm formation in the crystal violet assay by the cfp-labeled strain alone, both strains together, and the yfp-labeled strain alone, from left to right. The pie chart on the left shows frequencies of the two strains in the biofilm. The right-hand side of each panel—graph and pie chart—shows the planktonic cell data from the same experiments as the biofilms measurements. cfp and yfp stand for cyan and yellow fluorescent protein, respectively. Plotted data show means and 95% confidence intervals. Find numerical values in S1 Data.
Fig 3
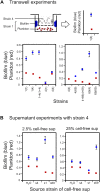
Fig 3. Increased biofilm in co-cultures is not dependent on cellular contact between strains.
A) Membrane-separated growth using Transwell plates (see Methods). Top diagram shows experimental design (left) and how results are plotted (right). On the axes, the first number refers to the responder strain for which the data are shown, while the number in parentheses is the inducer strain that is grown above, across the membrane. B) Increased biofilm due to cell-free culture supernatants. Data are for strain 4 growing in the presence of various supernatants (“H2O” is water in place of the supernatant, and “s4,” “s1,” and “s69” indicate the supernatant from strains 4, 1, and 69, respectively). Two concentrations of the supernatant are shown: 2.5% (left) and 25% (right). Data show means and 95% confidence intervals. Find numerical values in S1 Data.
Fig 4
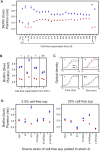
Fig 4. Pyocins are drivers of biofilm formation in co-cultures.
A) Size-based separation of the cell-free culture supernatant from strain 69 isolates fractions that induce biofilm formation at low concentrations and growth inhibition at high concentrations. Adding the unfractionated supernatant (“full sup”) induces biofilm in strain 4, which is comparable to direct mixtures of strains 4 and 69 (here labeled as “4 + 69”). Mass spectrometry analysis of fraction C9 (arrow) identified three proteins that are homologous to R and F pyocins in strain PA14. Compared to manufacturer size standards for the column, fraction C9 is expected to be >600 kDa. B) Cell-free culture supernatant at 2.5% in tryptone broth from PA14 (“+”) causes increased biofilm formation in strain 4 relative to tryptone broth with the same amount of water added (“-”), but this effect is not seen for strains 1, 7, or 69. C) The supernatant from PA14 is toxic to only strain 4, causing a strong population growth lag. This suggests that some degree of cell damage is needed for the biofilm response. Supernatant from a PA14 pyocin-null mutant (PA14 prtR S153A) does not cause any growth lag in strain 4 (red curve), confirming that the toxicity to strain 4 is driven by pyocins. D) R pyocins, and F pyocins to a lesser degree, drive the biofilm response in strain 4. At 2.5%, the supernatant from both PA14 (“s14”) and F-pyocin-null mutant (“s14ΔFpyo”) elicit a strong biofilm response in strain 4, which is largely removed by mutating either a master regulator of pyocins (“s14Δpyo”) or R pyocins (“s14ΔRpyo”) in PA14 (left panel). At a higher concentration (25%), supernatant that contains R pyocins is strongly toxic to strain 4, and R pyocin free supernatant now induces biofilm formation, which is consistent with the effects of other pyocins. Data from biofilm assays are means and 95% confidence intervals. Growth curves are means of eight replicates. Find numerical values in S1 Data.
Fig 5
Fig 5. Strain mixing induces biofilm formation in P. aeruginosa in flow cells.
A) Schematic of the experimental design, which involves mixing genotypes, initial attachment in the absence of flow, and finally, growth and competition under constant flow. Grey arrows represent the flow of nutrient media (tryptone broth). B) PAO1 biofilm compared to a mixed biofilm of PAO1 (strain 1) and strain 4. Within each image panel are three representative 10x epifluorescence micrographs of the flow cell channel showing the individual and merged YFP and CFP signals, and one 40x confocal image (scale bar is 30 μm) showing only the numerically-dominant yfp strain (autofluorescence in the CFP channel leads to a poor confocal signal). The charts at the far right show the initial attachment and final volume of biofilm of strain 1-yfp in single strain cultures (S) where 1-yfp is mixed with 1-cfp and in mixed strain cultures (M) where 1-yfp is mixed with 4-cfp. In both mixed and single cultures, the two differently-colored strains were initially mixed at a 1:1 ratio, yfp:cfp. Strain 1-yfp shows increased biofilm accumulation when mixed with 4, but cellular attachment is identical between single strain and mixed strain cultures. C) Strain 4 biofilm compared to a mixed biofilm of strain 4 and strain 69. In both mixed and single strain conditions, two differently-colored strains were initially mixed at a 3:1 ratio, yfp:cfp. Strain 4-yfp attaches more and makes more biofilm when mixed with 69. Error bars are 95% confidence intervals of the mean from six replicates, which combines data from two different days. *, p < 0.05 and n.s., not significant in a t test. Find numerical values in S1 Data.
Fig 6
Fig 6. Antibiotic gradients drive biofilm formation.
A) Image of the double inlet flow cell. Growth medium flows through both inlets but one also contains the test compound, which generates a gradient of the compound in the main chamber. Arrows indicate the direction of the flow. A fluorescent dye (fluorescein) has been added in this particular example (white) to illustrate the gradient created, but this is not present in the experiments in which we study the response of cells to antibiotics and cell-free supernatant (a.u., arbitrary units). B) Images corresponding to the red boxes shown in panel A, captured using a 20x objective (epifluorescence microscopy) and a 40x objective (confocal microscopy), respectively. 20x images are 350 μm by 450 μm, and 40x are 182 μm by 182 μm. Identical image collection and processing settings were used in all images to illustrate that ciprofloxacin (“Cip”) and cell-free culture supernatant from strain PA14 (“s”) both enhance the yellow signal when compared to controls at 20x magnification (“sΔpyo” is cell-free supernatant from the pyocin-null mutant and “TB” is tryptone broth, the standard medium). The confocal microscopy shows that the increase in the YFP signal in the epifluorescence images is explained by an increase in both cell density and volume of the biofilm.

Comment in

Similar articles

Cited by

References

    1. Costerton JW (1995) Overview of microbial biofilms. J Ind Microbiol 15: 137–140. - PubMed
    1. Kolter R, Greenberg EP (2006) Microbial sciences—The superficial life of microbes. Nature 441: 300–302. - PubMed
    1. Monds RD, O'Toole GA (2009) The developmental model of microbial biofilms: ten years of a paradigm up for review. Trends in Microbiology 17: 73–87. 10.1016/j.tim.2008.11.001 - DOI - PubMed
    1. Nadell CD, Xavier JB, Foster KR (2009) The sociobiology of biofilms. FEMS Microbiol Rev 33: 206–224. 10.1111/j.1574-6976.2008.00150.x - DOI - PubMed
    1. Hall-Stoodley L, Costerton JW, Stoodley P (2004) Bacterial biofilms: From the natural environment to infectious diseases. Nature Reviews Microbiology 2: 95–108. - PubMed

Publication types