. 2015 Jul 21;112(29):E3826-35.
doi: 10.1073/pnas.1500272112. Epub 2015 Jul 6.

Biased Brownian motion as a mechanism to facilitate nanometer-scale exploration of the microtubule plus end by a kinesin-8

Affiliations

Biased Brownian motion as a mechanism to facilitate nanometer-scale exploration of the microtubule plus end by a kinesin-8

Yongdae Shin et al. Proc Natl Acad Sci U S A. .

Abstract

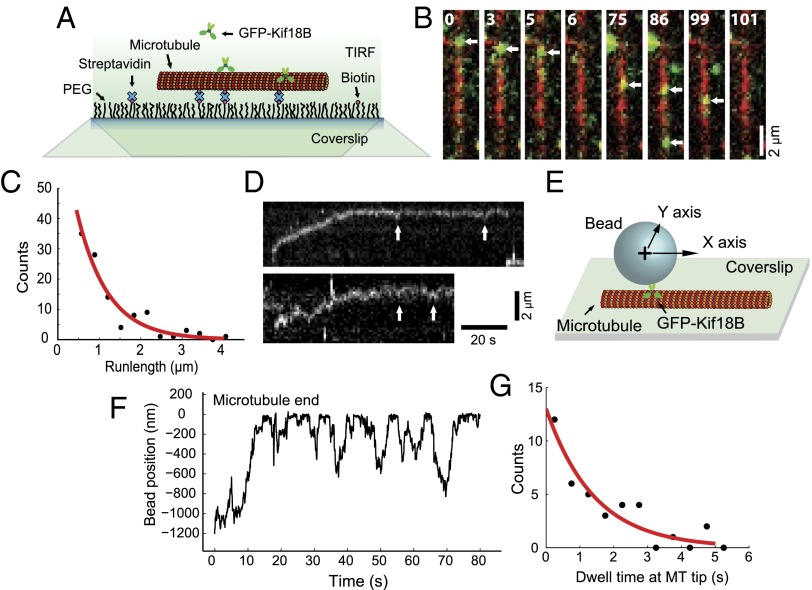
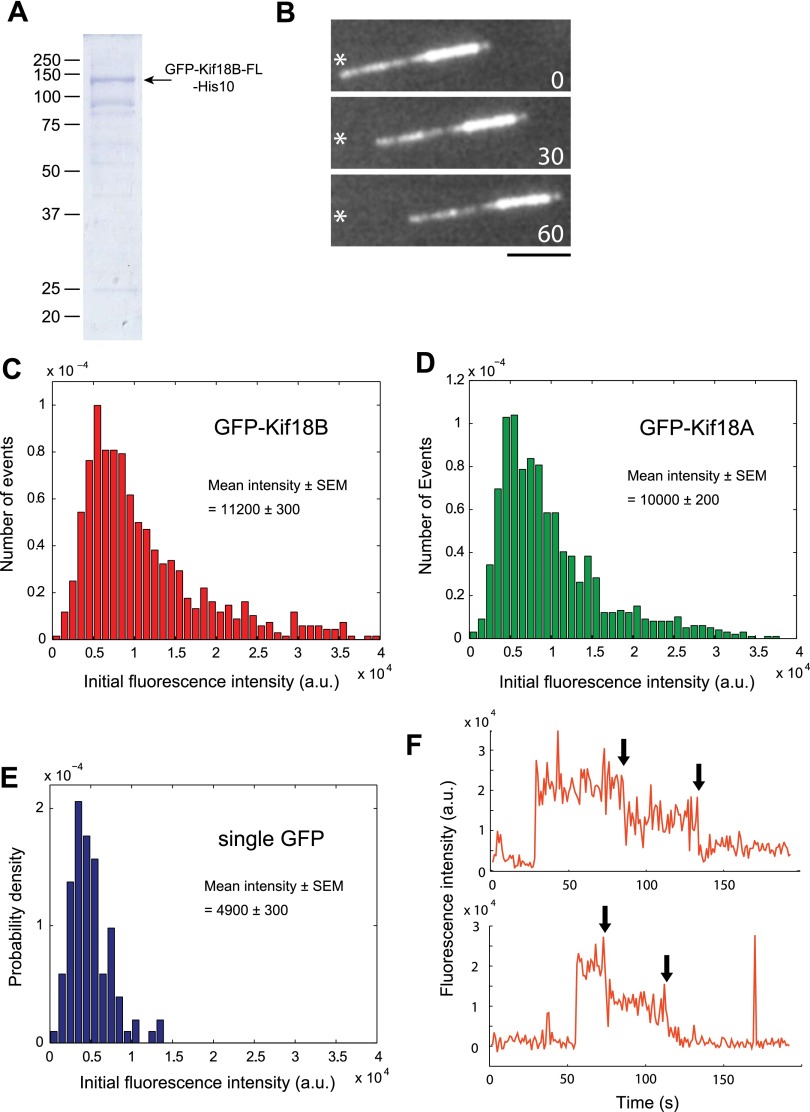
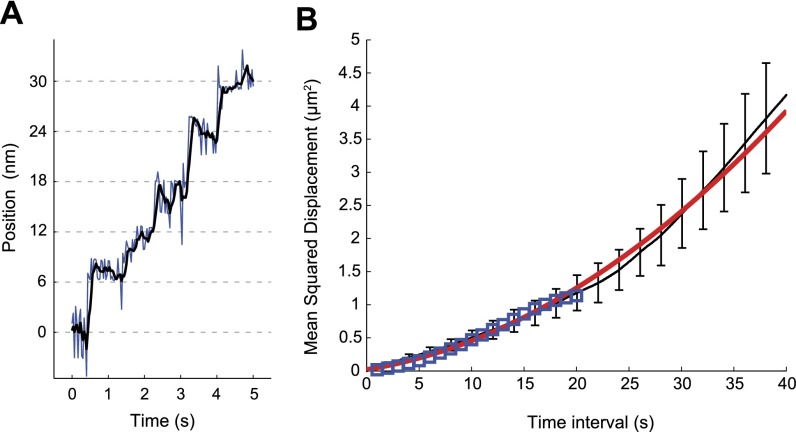
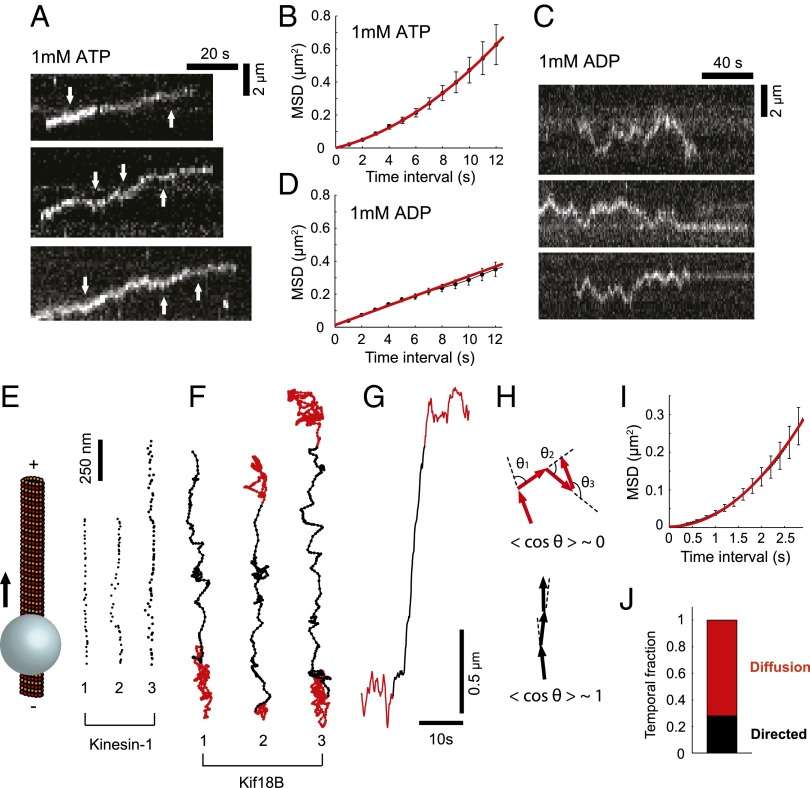
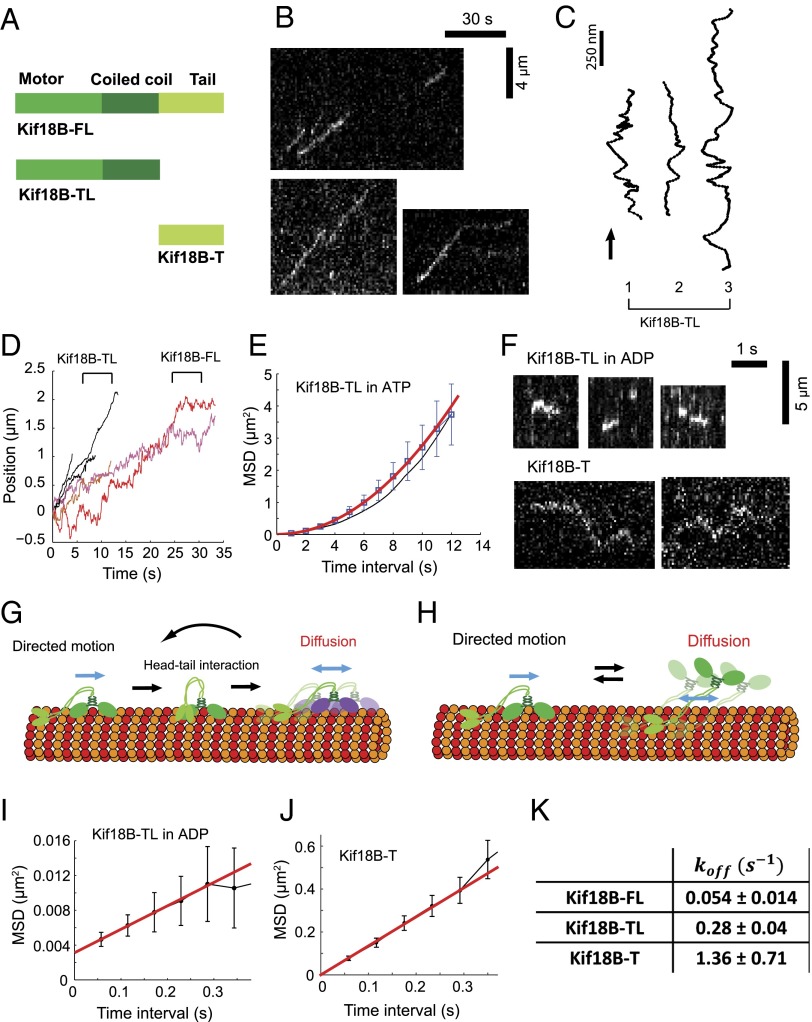
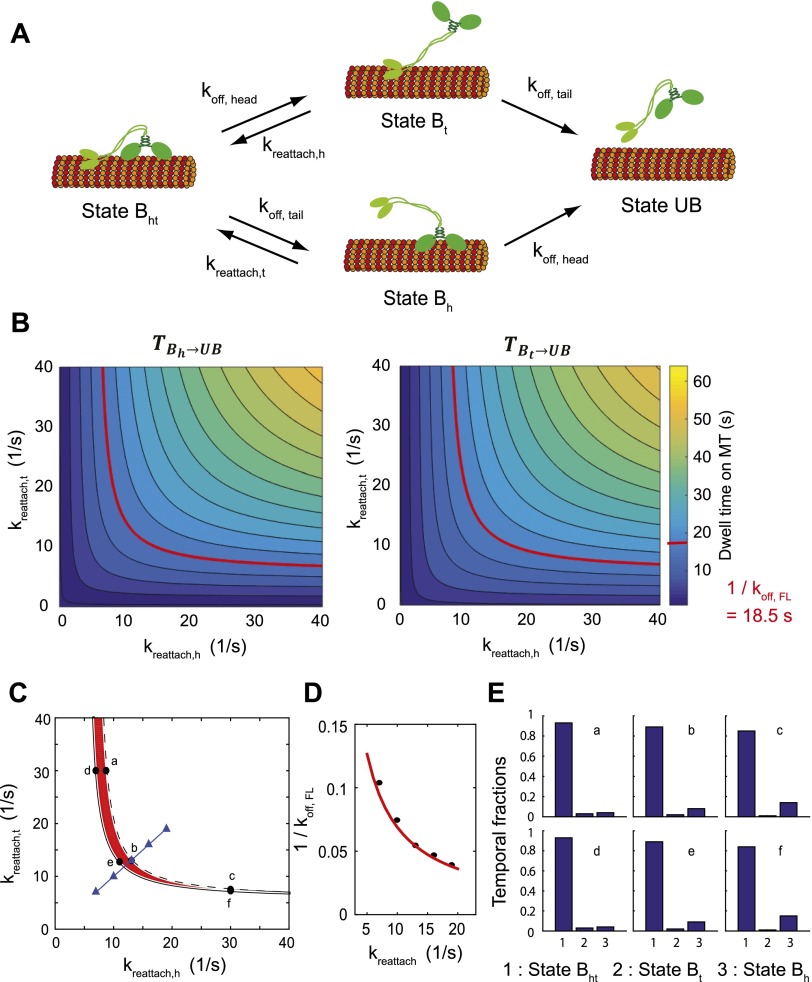
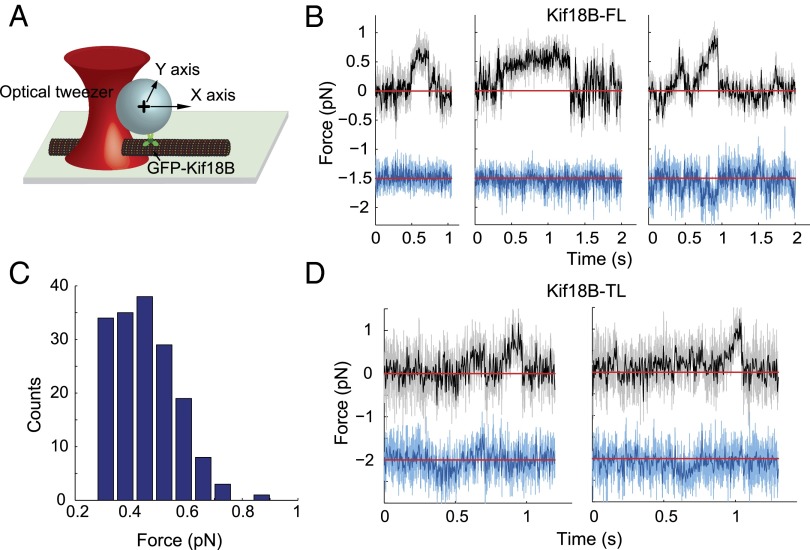
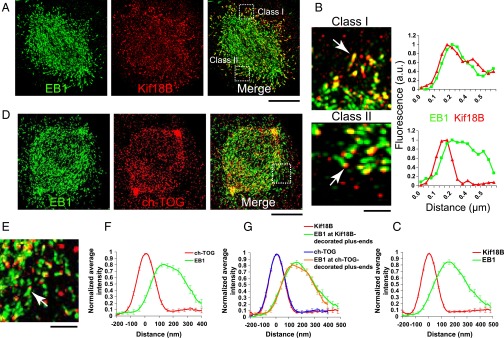
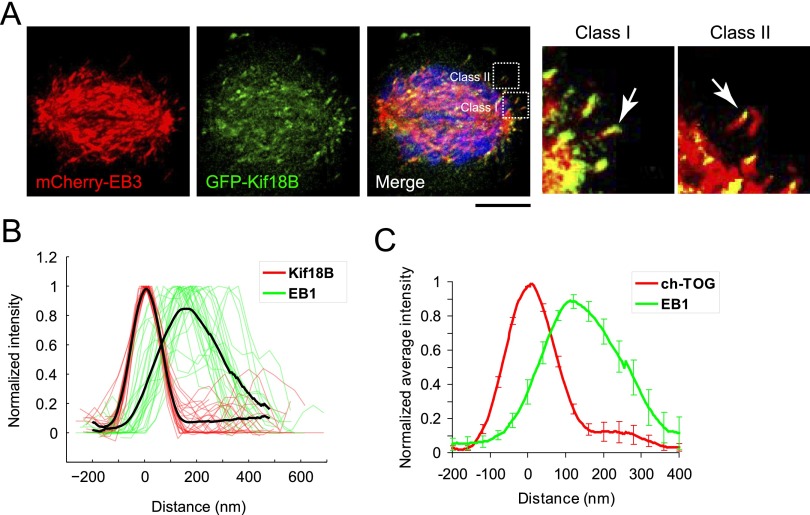
Kinesin-8s are plus-end-directed motors that negatively regulate microtubule (MT) length. Well-characterized members of this subfamily (Kip3, Kif18A) exhibit two important properties: (i) They are "ultraprocessive," a feature enabled by a second MT-binding site that tethers the motors to a MT track, and (ii) they dissociate infrequently from the plus end. Together, these characteristics combined with their plus-end motility cause Kip3 and Kif18A to enrich preferentially at the plus ends of long MTs, promoting MT catastrophes or pausing. Kif18B, an understudied human kinesin-8, also limits MT growth during mitosis. In contrast to Kif18A and Kip3, localization of Kif18B to plus ends relies on binding to the plus-end tracking protein EB1, making the relationship between its potential plus-end-directed motility and plus-end accumulation unclear. Using single-molecule assays, we show that Kif18B is only modestly processive and that the motor switches frequently between directed and diffusive modes of motility. Diffusion is promoted by the tail domain, which also contains a second MT-binding site that decreases the off rate of the motor from the MT lattice. In cells, Kif18B concentrates at the extreme tip of a subset of MTs, superseding EB1. Our data demonstrate that kinesin-8 motors use diverse design principles to target MT plus ends, which likely target them to the plus ends of distinct MT subpopulations in the mitotic spindle.

Keywords: EB1; Kif18B; kinesin-8; microtubule; mitosis.


Conflict of interest statement

The authors declare no conflict of interest.

Figures

Fig. 1.
Fig. 1.
Single-molecule analysis of Kif18B motility. (A) Single-molecule TIRF assay for Kif18B. Dilute GFP-Kif18B in solution is allowed to interact with a MT anchored to a glass coverslip via streptavidin–biotin linkages. TIRF microscopy is used to track individual molecules of GFP-Kif18B. (B) Sequential frames of a GFP-Kif18B-FL (green) video showing moderate processivity. Motility of single GFP-Kif18B-FL molecules on a MT (red) is marked by white arrows. Elapsed time is reported in seconds (s). (C) Run-length distribution of GFP-Kif18B-FL in 1 mM ATP. The red curve is a single exponential fit to the data with a fitting parameter, 0.74 ± 0.22 μm. n = 106. (D) Examples of kymographs showing back-and-forth movements of Kif18B at the MT end. Regions of such movements are marked by white arrows. (E) Video-tracking assay for Kif18B. GFP-Kif18B-FL is specifically linked to a bead using a pentahistidine antibody and the position of the bead is monitored using cross-correlation. (F) Example raw trace of a Kif18B-coated bead near the MT end. Frequent back-and-forth movements are evident. The zero position is an average of the 100 largest values observed in the trace. (G) Dwell time distribution of Kif18 at the MT end. The red curve is a single exponential fit to the data with a fitting parameter, 1.42 ± 0.57 s. n = 38.
Fig. S1.
Fig. S1.
Kif18B is a dimeric plus-end–directed motor. (A) Coomassie blue-stained gel showing 1 µg of GFP-Kif18B-FL purified from Sf9 cells. (B) Kif18B is a plus-end–directed motor. Shown are images from a time-lapse sequence of a Kif18B motility assay using bright/dim (minus-end/plus-end) GMPCPP MTs. Asterisks denote a fixed reference point. Time is indicated in seconds. (Scale bar, 5 μm.) (C–E) Single-molecule intensity histograms of GFP-Kif18B-FL (n = 682) (C), GFP-Kif18A-FL (n = 991) (D), and single GFP (n = 103) (E), respectively. The mean intensities of the initial three data points for each isolated fluorescent spot were used to generate histograms. The average and SE of each distribution is shown. (F) Representative intensity profiles with two-step fluorescence drops for GFP-Kif18B-FL moving on microtubules. Arrows indicate points of fluorescence drops. The second fluorescence drop can be either dissociation of Kif18B from the microtubule or photobleaching of the remaining GFP. The excitation laser was modulated at 1 Hz to extend the longevity of GFP, resulting in minimal simultaneous photobleaching of two GFP molecules.
Fig. S2.
Fig. S2.
Video tracking. (A) Piezo stage-driven 6-nm movements of a stuck bead were used to test the accuracy of DIC-based video tracking. (B) The MSD measured from video tracking of Kif18B-coated beads (black line; error bars are associated SEM) is consistent with that from single-molecule fluorescence tracking (blue open square). The red line is a fit to the video-tracked data with MSD = v2τ2 + 2 + offset, v = 0.045 ± 0.0002 μm/s, and D = 0.0105 ± 0.0004 μm2/s.
Fig. 2.
Fig. 2.
Kif18B exhibits directed and diffusive modes of movement. (A) Representative kymographs of GFP-Kif18B-FL depicting two modes of motility (diffusive and directed motion) in the presence of 1 mM ATP. Examples of backward motion are indicated by white arrows. (B) Mean-squared displacement (MSD) of GFP-Kif18B-FL in 1 mM ATP. The red curve is a fit to MSD = v2τ2 + 2 + offset, v = 0.052 ± 0.003 μm/s and D = 0.01 ± 0.001 μm2/s. Error bars represent the SEM of the squared displacement values. n = 98. (C) Representative kymographs of GFP-Kif18B-FL showing diffusive movements in 1 mM ADP. (D) MSD of GFP-Kif18B-FL in 1 mM ADP. The red line is a fit to MSD = 2 + offset, D = 0.015 ± 0.001 μm2/s. Error bars represent the SEM of the squared displacement values. n = 78. (E) Example 2D raw trajectories of Kinesin-1 on MT (Right) tracked with the video tracking. Traces are plotted on top–down view and the motility is upward (Left). (F) Example 2D trajectories of Kif18B obtained by video tracking. Data were 10-frame moving averaged. Different colors denote diffusion (red) and directed motion (black) detected using a computer algorithm (Materials and Methods). (G) Position vs. time curve for trace 3 in F. The instantaneous velocity is much higher than the average velocity. (H) Velocity vectors are highly correlated for directed motion (Lower, black) but uncorrelated for diffusion (Upper, red). Thus, angles (θ) between adjacent velocity vectors remain very small for directed motion along the trajectory but they are randomly distributed in the case of diffusion. (I) MSD calculated with transient directed phases. The red curve is a fit to MSD = v2τ2 + offset, v = 0.183 ± 0.002 μm/s. (J) Temporal fraction of Kif18B in each motility mode. Kif18B spends 72% of time in diffusion (red) while associating with the MT lattice.
Fig. S3.
Fig. S3.
MSD analysis. (A) Example traces with directed motion only (Left), pure diffusion (Center), and dual mode of motility switching between directed motion and diffusion (Right). Traces were generated using Monte Carlo simulations. (B) Corresponding MSDs (black line) calculated with traces in A. The red line is a fit to the model specified in each plot. The presence of diffusion in the dual mode of motility is evident as frequent backward motions in the position vs. time plot. The difference between pure diffusion and dual mode of motility is clear in MSD analysis where the directed motion gives rise to the quadratic increase in MSD.
Fig. S4.
Fig. S4.
Backward motions at the MT plus end are mediated by diffusion of Kif18B. (A) Example trace of a GFP-Kif18B-FL–coated bead with back-and-forth motions at the MT end (redrawn from Fig. 1F). Back-and-forth motions are highlighted by blue (backward) and red (forward) color. (B) MSD calculated using only backward motions (eight blue segments in A). The black line is a fit to MSD = 2 + offset, D = 0.0159 ± 0.0001 μm2/s. (C) MSD calculated using only forward motions (eight blue segments in A). The black line is a fit to MSD = 2 + offset, D = 0.016 ± 0.0002 μm2/s.
Fig. 3.
Fig. 3.
The tail domain permits the switching of motility mode in Kif18B. (A) Schematic diagrams of three Kif18B constructs used in this study. (B) Representative kymographs of tailless GFP-Kif18B showing the absence of diffusion in 1 mM ATP. (C) Example 2D “top–down” trajectories of GFP-Kif18B-TL coated beads from the video-tracking assay show only directed motions. Data were 10-frame moving averaged. Black arrow indicates the direction of motility. (D) Example raw distance vs. time plots of tailless GFP-Kif18B (black) and full-length GFP-Kif18B (other colors) acquired from video tracking. The tailless motor lacks diffusion and moves faster than the full-length motor. (E) MSD of GFP-Kif18B-TL in 1 mM ATP calculated from single-molecule fluorescence tracking (blue square) and video tracking (black line). The red curve is a fit to MSD from the single-molecule fluorescence data with MSD = v2τ2 + offset, v = 0.166 ± 0.001 μm/s. n = 37. (F) Representative kymographs of GFP-Kif18B-TL (Upper) in 1 mM ADP and mCh-Kif18B T (Lower). Diffusion of the tail domain is much faster than the tailless motor. (G and H) Two potential models to explain directed-to-diffusion movement transitions. In the first model (G), the motor head mediates both directed motions and diffusion. Stochastic interaction between the tail domain and the motor head leads to switching from directed motion to diffusion. In the second model (H), diffusion is mediated by interaction of the tail domain with the MT lattice when the motor heads release from the same track. Reattachment of the motor domain results in reversal of motility back to directed motion. Black and blue arrows indicate transitions between directed/diffusive modes of motility and movement directions, respectively. (I) MSD of GFP-Kif18B-TL in 1 mM ADP. The red line is a fit to MSD = 2 + offset, D = 0.014 ± 0.001 μm2/s. n = 37. (J) MSD of mCh-Kif18B-T. The red line is a fit to MSD = 2 + offset, D = 0.676 ± 0.060 μm2/s. n = 15. (K) Dissociation rate constants of three Kif18B variants from the MT lattice. All rates are corrected for photobleaching rates. Values of GFP-Kif18B-FL and GFP-Kif18B-TL are measured in 1 mM ATP.
Fig. S5.
Fig. S5.
Purification and characterization of Kif18B truncation mutants. (A) Coomassie blue-stained gel showing GFP-Kif18B-TL purified from Sf9 cells. (B) Coomassie blue-stained gel showing mCh-Kif18B-T purified from E. coli. (C) AU analysis of mCh-Kif18B-T. The S value and determined molecular mass are given for peak I and peak II. (D) The Kif18B tail bundle MTs in vitro. Alexa 488-labeled GMPCPP MTs (green) were incubated without or with mCh-Kif18B-T as indicated. (Scale bar, 10 μm.) (E) Probability density distribution of intensities from tracked single-molecule Kif18B tail on MTs (n = 24). Intensities were moving averaged every two points and then pooled to build the histogram. The distribution was fitted to a double-Gaussian fit (black solid line, sum of Gaussians; red solid line, individual Gaussians) with peaks located at 1,320 ± 150 and 2,460 ± 190. (F) Example intensity traces of single-molecule Kif18B tail on MTs. Red dashed lines represent intensity levels corresponding to two peaks of the double-Gaussian fit in E. Time axes are aligned so that initial bindings to MTs are located after 30 frames (∼1.8 s). Based on their intensity profiles, four molecules (three in Upper row and leftmost one in Lower row) are classified as dimers and other two molecules as monomers.
Fig. S6.
Fig. S6.
Kinetic analysis for Kif18B-FL binding to MTs. (A) Molecular configurations for the full-length Kif18B binding to MTs. Kif18B-FL can bind to MTs in three distinct states: (i) both head- and tail-bound state (state Bht) or (ii and iii) either (ii) head-only (state Bh) or (iii) tail-only bound state (state Bt). Transition rates between states are indicated along pathways. (B) Contour plots for theoretically determined mean dwell times of Kif18B-FL on MTs (Eqs. S1 and S2). Two initial states, the head bound (Left, TBhUB) or the tail bound (Right, TBtUB), were used to analytically compute mean dwell times as a function of rebinding rates. Red lines are contour lines for the experimentally determined MT dwell time of Kif18B-FL, 1/koff,FL (= 18.5 s) (Fig. 3K). (C) A solution space (red area) for rebinding rates of the head and tail domain. The black solid and dashed lines are contour lines (reproduced from red lines in B) for TBhUB=1/koff,FL and TBtUB=1/koff,FL, respectively. Blue triangles locate parameter sets used to compare results from simulations with theoretical values as shown in D. Black points (C, a–f) represent six different parameter sets used to compute temporal fractions of each binding configuration as shown in E. (D) Unbinding rates of Kif18B-FL calculated with theory (red line; Eqs. S1 and S2) and simulation (black circles). (E) Temporal fractions of Kif18B-FL in each molecular configuration during its association to MTs. Six distinct sets of rebinding rates (C, a–f) are used to simulate evolutions of each MT binding event.
Fig. 4.
Fig. 4.
Kif18B is a low-force motor. (A) Schematic diagram of the loaded stationary optical trap assay for Kif18B. As Kif18B walks along the MT, the force exerted on the motor increases, ultimately resulting in unbinding from the MT. (B) Representative records of Kif18B-FL–coated beads held in the optical trap along the MT axis [Upper, raw data (light gray), decimated to 300 Hz (black)] and the lateral axis [Lower, raw data (light blue), decimated to 300 Hz (blue)]. A red line indicates the trap center. Kif18B frequently moves sideway as evidenced by deviation in the lower lateral blue trajectories. (C) The distribution of maximal force for Kif18B-FL. The mean maximal force is 0.46 ± 0.01 pN. n = 170. (D) Representative records of tailless GFP-Kif18B–coated beads in the optical trap assay. Color codes are the same as in B.
Fig. 5.
Fig. 5.
Kif18B exhibits a complex distribution at the plus ends of spindle MTs. (A) Kif18B (red) and EB1 (green) distributions in a metaphase HeLa cell determined by structured illumination microscopy. The class I and class II regions are indicated and enlarged in B. (Scale bar, 5 μm.) (B) Kif18B exhibits two classes of localization at the MT plus end. The indicated comets (arrows) were used to generate linescans. (Scale bar, 1 μm.) (C) Average intensity profiles of Kif18B (red) and EB1 (green) during mitosis by SIM (n = 25 comets). Alignment of multiple comet profiles was performed with subpixel accuracy before being averaged (Fig. S7B) (Materials and Methods). The error bars are SEM. (D) ch-TOG (red) and EB1 (green) distributions in a metaphase HeLa cell. (Scale bar, 5 μm.) The indicated regions are enlarged in E. (E) An example comet for EB1 and ch-TOG is indicated with a white arrow. (Scale bar, 1 μm.) (F) Average intensity profiles of ch-TOG (red) and EB1 (green) during mitosis (n = 25 comets). The same method of alignment and averaging was used as in C. The error bars are SEM. (G) Display of C and F together: Kif18B in red, EB1 at the Kif18B-decorated plus ends in green, ch-TOG in blue, and EB1 at the ch-TOG–decorated plus ends in orange.
Fig. S7.
Fig. S7.
Distribution of Kif18B and ch-TOG at spindle MT plus ends. (A) A metaphase HeLa cell that transiently expressed GFP-Kif18B (green) and mCherry-EB3 (red). MTs decorated with Kif18B corresponding to class I and class II profiles are indicated and enlarged. (Scale bar, 5 μm.) (B) Procedure for aligning intensity profiles with subpixel accuracy and averaging (SI Text). Individual normalized intensity profiles for Kif18B (red) and EB1 (green) from comets in a mitotic cell were aligned based on the peak locations of the Kif18B population. Black lines are averaged intensities for each protein and identical to the intensity profiles in Fig. 5C. (C) Average intensity profiles of ch-TOG (red) and EB1 (green) from interphase cells (n = 10 comets). The error bars represent SEM. Note that the profiles are consistent with published work (33).

Similar articles

Cited by

References

    1. DeZwaan TM, Ellingson E, Pellman D, Roof DM. Kinesin-related KIP3 of Saccharomyces cerevisiae is required for a distinct step in nuclear migration. J Cell Biol. 1997;138(5):1023–1040. - PMC - PubMed
    1. Mayr MI, et al. The human kinesin Kif18A is a motile microtubule depolymerase essential for chromosome congression. Curr Biol. 2007;17(6):488–498. - PubMed
    1. Stumpff J, von Dassow G, Wagenbach M, Asbury C, Wordeman L. The kinesin-8 motor Kif18A suppresses kinetochore movements to control mitotic chromosome alignment. Dev Cell. 2008;14(2):252–262. - PMC - PubMed
    1. Zhu C, et al. Functional analysis of human microtubule-based motor proteins, the kinesins and dyneins, in mitosis/cytokinesis using RNA interference. Mol Biol Cell. 2005;16(7):3187–3199. - PMC - PubMed
    1. Niwa S, et al. KIF19A is a microtubule-depolymerizing kinesin for ciliary length control. Dev Cell. 2012;23(6):1167–1175. - PubMed

Publication types

LinkOut - more resources