. 2015 Sep 1;35(17):3083-102.
doi: 10.1128/MCB.00248-15. Epub 2015 Jun 29.

Analysis of the Role of the C-Terminal Tail in the Regulation of the Epidermal Growth Factor Receptor

Affiliations

Analysis of the Role of the C-Terminal Tail in the Regulation of the Epidermal Growth Factor Receptor

Erika Kovacs et al. Mol Cell Biol. .

Abstract

The ∼230-residue C-terminal tail of the epidermal growth factor receptor (EGFR) is phosphorylated upon activation. We examined whether this phosphorylation is affected by deletions within the tail and whether the two tails in the asymmetric active EGFR dimer are phosphorylated differently. We monitored autophosphorylation in cells using flow cytometry and found that the first ∼80 residues of the tail are inhibitory, as demonstrated previously. The entire ∼80-residue span is important for autoinhibition and needs to be released from both kinases that form the dimer. These results are interpreted in terms of crystal structures of the inactive kinase domain, including two new ones presented here. Deletions in the remaining portion of the tail do not affect autophosphorylation, except for a six-residue segment spanning Tyr 1086 that is critical for activation loop phosphorylation. Phosphorylation of the two tails in the dimer is asymmetric, with the activator tail being phosphorylated somewhat more strongly. Unexpectedly, we found that reconstitution of the transmembrane and cytoplasmic domains of EGFR in vesicles leads to a peculiar phenomenon in which kinase domains appear to be trapped between stacks of lipid bilayers. This artifactual trapping of kinases between membranes enhances an intrinsic functional asymmetry in the two tails in a dimer.


Figures

FIG 1
FIG 1
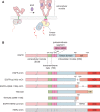
Model for activation of epidermal growth factor receptor (EGFR) and constructs used in this study. (A) Ligand binding to the extracellular domain of the epidermal growth factor receptor induces a conformational change that results in receptor-mediated dimerization and activation. Activation of the intracellular kinase domains is promoted by the formation of an asymmetric dimer, in which one kinase domain (the activator [yellow]) activates the other kinase domain (the receiver [blue]). (B) Domain architecture of human EGFR with domain boundaries highlighted. The domain composition of the EGFR family constructs used in this study is also presented, including EGFR deletion constructs, the EGFR-HER3 tail chimera, and HER2 (Δ, deletion; mCh, mCherry fluorescent protein fusion).
FIG 2
FIG 2
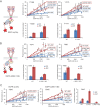
Effects of deletions in the EGFR tail on EGFR phosphorylation. (A) The vIVb deletion in the proximal region of the EGFR tail enhances autophosphorylation on Tyr 1068 and Tyr 1173, even in the absence of EGF stimulation. The top panels represent the whole data set (A.U., arbitrary unit). Data for the wild type (WT) and deletion mutants are shown. Phosphorylation levels with EGF stimulation (+) and without EGF (−) stimulation are shown. The bar graphs in the bottom panels present the data from cells expressing intermediate levels of EGFR. Phosphorylation levels are normalized to the unstimulated, wild-type EGFR-expressing cells. (B) Same as in panel A, but showing data for cells expressing the Δ(999–1186) EGFR mutant with a deletion in the distal region of the tail. The levels of phosphorylation detected for Tyr 974 and Tyr 992 are substantially lower than those for the wild type. (C) Effects of the same deletion constructs as in panels A and B on the activation loop tyrosine (Tyr 845). The vIVb deletion in the proximal region leads to enhanced phosphorylation, whereas deletion of the distal region of the tail is necessary for activation loop tyrosine phosphorylation. Data are presented as in panels A and B.
FIG 3
FIG 3
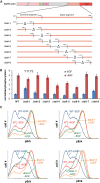
An autoinhibitory function of the EGFR C-terminal tail maps to the entire proximal region deleted in the vIVb mutant. (A) Illustration of overlapping deletion mutants scanning the EGFR C-terminal tail. (B) Flow cytometry analysis of Tyr 1173 phosphorylation with EGFR tail mutants, with and without EGF stimulation. The analysis was performed as described in the legend to Fig. 2, and phosphorylation levels are normalized to unstimulated, wild-type EGFR-expressing cells. (C) Flow cytometry analysis of phospho-Erk1/2 (pErk) in cells expressing the vIVb deletion mutant [Δ(vIVb)] or selected deletion mutants depicted in panel A. Histograms of pErk signal are shown for cells expressing moderate amounts of EGFR constructs, with or without EGF stimulation. The data for each mutant are separately plotted, overlaid on the data for wild-type EGFR.
FIG 4
FIG 4
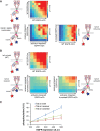
The vIVb deletion increases EGFR phosphorylation only when present in both the activator and receiver of the active asymmetric dimer. (A) Flow cytometry analysis of activation loop phosphorylation using cotransfected EGFR mutants. Pairs of EGFR constructs consisting of activator-impaired, mCherry-tagged EGFR, and receiver-impaired, Cerulean-tagged EGFR were cotransfected into HEK-293T cells. After EGF stimulation, cells were analyzed for mCherry, Cerulean, and FITC fluorescence, reflecting the expression levels of each construct and antiphosphotyrosine staining for Tyr 845. Data were binned according to mCherry and Cerulean intensity and represented as a two-dimensional histogram, with the color of each bin corresponding to the intensity of phosphotyrosine staining for cells within that bin. Phosphorylation at Tyr 845 is compared between EGFR pairs with none (wild type), one, or both dimer partners containing the vIVb deletion [Δ(vIVb), X symbol], as indicated. (B) Flow cytometry analysis of phospho-Erk1/2 (pErk) in cells expressing mutant EGFR asymmetric dimer pairs. Cells containing the pairs of constructs shown in panel A were treated with EGF or without EGF and stained for pErk. Each Δ(vIVb) combination (deletion in the activator-impaired construct, receiver-impaired construct, or both) is plotted separately and overlaid on the data for the intact-tail pair (wild type).
FIG 5
FIG 5
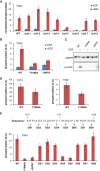
The NPXY motif encompassing Tyr 1086 of EGFR is required for Tyr 845 phosphorylation in HEK-293T cells. (A) Flow cytometry analysis of Tyr 845 phosphorylation with EGFR tail deletion mutants, with and without EGF stimulation. Phosphorylation at Tyr 845 is greatly diminished relative to wild-type EGFR in constructs lacking residues 1051 to 1097 (Δtail-5) or residues 1074 to 1120 (Δtail-6). (B) Flow cytometry analysis of Tyr 845 phosphorylation with EGFR mutated either at Tyr 1086 or with the deletion of residues 1083 to 1086 (ΔNPXY). (C) Western blot analysis of Tyr 845 phosphorylation with and without EGF stimulation for Y1086A and ΔNPXY mutants. Mutants lacking an intact phosphotyrosine recognition motif at Tyr 1086 have greatly diminished phosphorylation at Tyr 845. αEGFR, anti-EGFR antibody; αpY845, antibody against phosphorylated tyrosine at position 845. (D) Flow cytometry analysis of Tyr 974 and Tyr 992 phosphorylation for Y1086A and ΔNPXY mutants. Phosphorylation of proximal tail tyrosines is reduced by mutation of the Tyr 1086 site, but to a lesser degree than that of Tyr 845. (E) Flow cytometry analysis of Tyr 845 phosphorylation with fine-scale scanning deletion mutants. Three residues were deleted in each DS construct listed below the x axis, spanning residues 1075 to 1098. Mutants missing residues 1084 to 1086 (DS4) and 1087 to 1098 (DS5) have reduced phosphorylation at Tyr 845 relative to wild-type EGFR upon EGF stimulation.
FIG 6
FIG 6
Crystal structures of EGFR V924R and I682Q mutants. (A) Superposition of the EGFR I682Q structure here presented with the EGFR structure bound to Mig6 (PDB code 2RFE; chain A). The electron density at the base of the C-lobe of monomer A in the EGFR I682Q structure is shown, for a map calculated with the coefficients 2mFo-DFc (purple) and mFo-DFc (green positive peaks) and phases obtained from a model at the late stages of refinement. (B) Orthogonal zoomed views of the region delimited in panel A by a rectangle.
FIG 7
FIG 7
Proposed model for activator interface occlusion by the C-terminal tail. (A) Molecular dynamics simulation snapshot ∼5 ps after spontaneous formation of an α-helix, including Phe 999 and Phe 1000 of the tail (FF helix). Structural features are colored as follows: α-helix C in dark blue, activation loop in red, AP2 helix in orange, α-helix comprising Phe 999 and Phe 1000 in yellow, β-sheet forming a Mig6-like interaction in purple, and other modeled tail residues (991 to 1024) in green. The left inset shows the packing of residues Phe 999 and Phe 1000 against the C-lobe, as allowed by the helical conformation of the tail. The right inset shows the details of the β-sheet interaction formed between Ser 1012 and Leu 1014 of the tail and Gly 906 and Arg 908 of the C-lobe. (B) Overlaid snapshots at 7 ps and 307 ps after formation of the FF helix. The structures from the trajectory were aligned to the backbone atoms of residues 853 to 959 of PDB 2RFE, chain A. (C) Comparison of the conformation of Mig6 and the EGFR tail model after simulation. The snapshot 307 ps after formation of the FF helix is shown with the kinase domain as a surface and the modeled tail in stick representation. Mig6 (chain E from PDB 2RFE) is shown in gray. The simulation snapshot is aligned to the crystal structure as in panel B.
FIG 8
FIG 8
Tail phosphorylation in the activator and receiver kinases. (A and B) Flow cytometry analysis of Tyr 1173 phosphorylation by cotransfected EGFR mutants. mCherry- and Cerulean-tagged versions of EGFR (EGFR-mCh and EGFR-Cer, respectively) were cotransfected into Cos7 cells and were analyzed for mCherry, Cerulean, and FITC fluorescence, reflecting the expression levels of each construct and antiphosphotyrosine staining for pTyr 1173 after EGF stimulation. Data were binned according to mCherry and Cerulean intensities and represented as a two-dimensional histogram, with the color of each bin corresponding to the intensity of phosphotyrosine staining for cells within that bin. In panel A, phosphorylation at Tyr 1173 is compared between a pair of wild-type EGFR constructs (top row) and a pair of constructs consisting of activator-impaired (V924R) and receiver-impaired (I682Q) EGFR (lower left panel), as well as a pair with the Cerulean-labeled construct truncated at residue 998 (lower right panel). The activator- and receiver-impaired pair exhibit lower phosphorylation levels than the wild-type pair, and phosphorylation of the one-tailed pair depends only on the expression level of the tail-containing (and the only Tyr 1173-containing) construct. In panel B, the wild-type pair (top tow) is compared to V924R/I682Q pairs in which the tail is truncated at residue 998 in the receiver-impaired construct (tail on the receiver [lower left]) or truncated in the activator-impaired construct (tail on the activator [lower right]). The different number of bins in panels A and B reflects the difference in the number of cells that were analyzed in each set of experiments. (C) Mean phosphorylation level plotted against expression level for bins on the diagonal in panel B, reflecting cells expressing similar levels of mCherry- and mCerulean-tagged EGFR. Values are means ± standard errors of the means (SEM) (error bars). Phosphorylation at Tyr 1173 increases with expression level significantly more when the EGFR tail is on the activator than when it is on the receiver.
FIG 9
FIG 9
An EGFR-Her3 tail chimera produces higher phosphorylation levels when it takes the activator position in an asymmetric dimer. (A) Schematic illustrating the combinations of constructs shown in panels B and C. Pairs of constructs consisting of EGFR (residues 1 to 957) and the EGFR or Her3 C-terminal tail were cotransfected. The Her3 tail-containing constructs were constrained to take the activator or receiver position with the I682Q or V924R mutation, respectively. (B) Phosphorylation of Her3 Y1289 analyzed by flow cytometry. Phosphorylation level with (+) or without (−) EGF is plotted versus protein expression level for bins of cells expressing similar levels of each construct (mean bin fluorescence ± SEM). (C) Relative phosphotyrosine signal for each pair of constructs for intermediate expression levels (500 to 600 mCherry fluorescence units as shown in panel B), normalized to the unstimulated EGFR-Her3 tail signal (mean ± SEM [error bars]). The pair in which the Her3 tail is attached to an activator-only EGFR kinase shows reduced phosphorylation upon EGF stimulation compared to the pair in which the Her3 tail is attached to the receiver-only kinase domain.
FIG 10
FIG 10
C-terminal tail phosphorylation by EGFR/Her2 heterodimers is greater when EGFR takes the receiver position. (A) Schematic illustrating the combinations of constructs shown in panels B and C. EGFR and Her2 constructs, labeled with either mCherry or Cerulean and bearing either activator-impaired, receiver-impaired, or kinase-dead mutations, were cotransfected. (B) Phosphorylation of Her2 Tyr 1221 and EGFR Tyr 1173 upon EGF stimulation analyzed by flow cytometry. Mean bin phosphorylation level for the indicated tyrosine is plotted versus receptor expression level for bins of cells expressing similar levels of each construct. (C) Phosphotyrosine signal for each pair of constructs for intermediate expression levels (500 to 600 mCherry fluorescence units), as shown in panel B (mean ± SEM [error bars]). Mutation of the catalytic aspartate in EGFR or forcing EGFR to take the activator position reduces phosphorylation significantly.
FIG 11
FIG 11
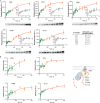
Vesicle-reconstituted TM-ICM EGFR exhibits biphasic autophosphorylation kinetics. (A) Time courses of EGFR autophosphorylation by TM-ICM EGFR reconstituted into vesicles determined by Western blotting with the indicated antibodies. Integrated band intensities for five replicate experiments (values are means ± SEM [error bars]) are plotted versus time and fit to two separate single exponential functions and offset by a fixed amount of time. Images for representative blots are shown below each graph. The table at bottom right lists the half-life for the first exponential function (mean ± SEM). (B) Time courses of phosphorylation reactions as quantified by tandem mass spectrometry. The graphs show the ratio of the area under the extracted ion chromatogram for the indicated phosphorylated peptide versus the total area for phosphorylated and unphosphorylated peptides for each sample.
FIG 12
FIG 12
A short-tailed EGFR TM-ICM construct incorporated into vesicles does not exhibit biphasic autophosphorylation kinetics. (A) Negative-stained electron micrograph of vesicles reconstituted with EGFR TM-ICM truncated after residue 998 (left) and illustration of the location of phosphorylated tyrosines in this construct (right). The electron microscopy (EM) sample was prepared as for the samples shown in Fig. 11. (B) Time courses of autophosphorylation on the indicated tyrosines for the short-tail TM-ICM incorporated into vesicles, as quantified by Western blotting. Integrated band intensities for five replicate experiments (mean ± SEM) are plotted versus time and fit to a single exponential function. The time scale and reaction conditions are the same as in panel A. The reaction progress curves fit well to a single exponential decay, unlike the full-length tail constructs shown in Fig. 11.

Similar articles

Cited by

References

    1. Arteaga CL, Engelman JA. 2014. ERBB receptors: from oncogene discovery to basic science to mechanism-based cancer therapeutics. Cancer Cell 25:282–303. doi:10.1016/j.ccr.2014.02.025. - DOI - PMC - PubMed
    1. Kovacs E, Zorn JA, Huang Y, Barros T, Kuriyan J. 2015. A structural perspective on the regulation of the epidermal growth factor receptor. Annu Rev Biochem 84:739–764. doi:10.1146/annurev-biochem-060614-034402. - DOI - PMC - PubMed
    1. Yarden Y, Sliwkowski MX. 2001. Untangling the ErbB signalling network. Nat Rev Mol Cell Biol 2:127–137. doi:10.1038/35052073. - DOI - PubMed
    1. Endres NF, Barros T, Cantor AJ, Kuriyan J. 2014. Emerging concepts in the regulation of the EGF receptor and other receptor tyrosine kinases. Trends Biochem Sci 39:437–446. doi:10.1016/j.tibs.2014.08.001. - DOI - PubMed
    1. Lemmon MA, Schlessinger J, Ferguson KM. 2014. The EGFR family: not so prototypical receptor tyrosine kinases. Cold Spring Harb Perspect Biol 6:a020768. doi:10.1101/cshperspect.a020768. - DOI - PMC - PubMed

Publication types