. 2015 Jul 27;212(8):1239-54.
doi: 10.1084/jem.20150218. Epub 2015 Jun 29.

Nuclear factor κB-inducing kinase activation as a mechanism of pancreatic β cell failure in obesity

Affiliations

Nuclear factor κB-inducing kinase activation as a mechanism of pancreatic β cell failure in obesity

Elisabeth K Malle et al. J Exp Med. .

Abstract

The nuclear factor κB (NF-κB) pathway is a master regulator of inflammatory processes and is implicated in insulin resistance and pancreatic β cell dysfunction in the metabolic syndrome. Whereas canonical NF-κB signaling is well studied, there is little information on the divergent noncanonical NF-κB pathway in the context of pancreatic islet dysfunction. Here, we demonstrate that pharmacological activation of the noncanonical NF-κB-inducing kinase (NIK) disrupts glucose homeostasis in zebrafish in vivo. We identify NIK as a critical negative regulator of β cell function, as pharmacological NIK activation results in impaired glucose-stimulated insulin secretion in mouse and human islets. NIK levels are elevated in pancreatic islets isolated from diet-induced obese (DIO) mice, which exhibit increased processing of noncanonical NF-κB components p100 to p52, and accumulation of RelB. TNF and receptor activator of NF-κB ligand (RANKL), two ligands associated with diabetes, induce NIK in islets. Mice with constitutive β cell-intrinsic NIK activation present impaired insulin secretion with DIO. NIK activation triggers the noncanonical NF-κB transcriptional network to induce genes identified in human type 2 diabetes genome-wide association studies linked to β cell failure. These studies reveal that NIK contributes a central mechanism for β cell failure in diet-induced obesity.


Figures

Figure 1.
Figure 1.
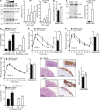
MV1 disrupts glucose homeostasis in zebrafish and impairs β cell function in human and mouse islets. (A) Protein levels of NIK and p100 to p52 processing in the MDA-MB-231/Luc breast cancer cell line treated with increasing concentrations of MV1 were assessed by immunoblotting. A representative of four independent experiments is shown. Histogram data depicts cumulative densitometry relative to β-actin of the four independent experiments. (B) Glucose levels in zebrafish larvae injected with DMSO or MV1 were assessed. The data are mean and SEM derived from seven control and five MV1-treated groups, with four larvae per group, in a representative of two independent experiments. **, P < 0.01. (C) Protein levels of p100 to p52 processing in DMSO and MV1-treated C57BL/6 mouse islets from one islet isolate were assessed by immunoblotting. A representative of three independent experiments is shown. Histogram data depicts cumulative densitometry relative to β-actin of the three independent experiments. (D) In vitro GSIS in 2 and 20 mM d-glucose and in KCl conditions of DMSO control and MV1-treated primary mouse islets was measured. Data are mean and SEM derived from six independent islet isolates for each group, and are representative of two independent experiments. **, P < 0.01. (E–G) Blood glucose and AUC were determined in DMSO control and MV1-treated mouse islet C57BL/6 transplant recipients after i.p. injection of d-glucose at (E) POD 3 (AUC, **, P < 0.01; control, n = 9; MV1, n = 8), (F) POD 7 (*, P < 0.05; control, n = 12; MV1, n = 13), and (G) POD 11 (n.s.; control, n = 10; MV1, n = 10). Data are representative of three independent mouse cohorts tested. (H) H&E staining and insulin immunostaining of DMSO control and MV1-treated mouse islet grafts are shown. Graft β cell area was determined for three DMSO and three MV1-treated islet grafts by quantification of insulin-positive area in continuous serial graft sections. A representative image for each condition is shown. Boxed insets represent magnified area. Differences in graft area are not significant. *, P > 0.05. Bar, 100 µm. (I) In vitro GSIS in 2.8 and 25 mM d-glucose conditions of DMSO control and MV1-treated primary human islets was measured. Data are mean and SEM derived from quintuplets for DMSO and MV1-treated islets and are representative of three independent human islet isolates. *, P < 0.05. All data are represented as mean ± SEM; p-values were determined using Student’s t test.
Figure 2.
Figure 2.
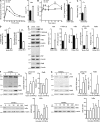
Pancreatic islets in a DIO model exhibit NIK hyperactivation and display a net β cell secretory defect. (A) Blood glucose and AUC were determined in 12 chow (dotted line) and 15 DIO (solid line) fed C57BL/6 WT mice (16 wk old) after i.p. injection of d-glucose. Data are representative of three independent mouse cohorts tested. ****, P < 0.0001. (B) Insulin levels and AUC (10 min after injection) were determined for 5 chow (dotted line) and 15 DIO (solid line) fed C57BL/6 WT mice (16 wk old) after i.v. injection of d-glucose. Data are representative of three independent mouse cohorts tested. *, P < 0.05. (C) Total β cell area was determined for 5 chow- and 5 HFD-fed WT mice by quantification of insulin-positive area in serial graft sections as a percentage of total pancreatic exocrine area (*, P < 0.05). (D) Data are mean and SEM showing percentage of net insulin secretion normalized to mean β cell area determined for mice in C. (left) Net fasted insulin levels; (right) net secretion (AUC) for 10 min after d-glucose injection. *, P < 0.05; ****, P < 0.0001. (E) Protein levels of NIK, IKKα/β phosphorylation, IκBα, p100 to p52 processing, and RelB in one islet isolate from a chow-fed and a DIO C57BL/6 WT mouse were assessed by immunoblotting. A representative of four independent experiments is shown. Histogram data depict cumulative densitometry relative to β-actin of the four independent experiments. (F and G) Protein levels of p100 to p52 processing and RelB in one (F) TNF- and (G) RANKL-stimulated mouse islet isolate at 0, 1, and 4 h after stimulation. IκBα levels at 0, 15, 30, 60, and 240 min after stimulation were assessed by immunoblotting. A representative of four independent experiments is shown. Histogram data shows cumulative densitometry relative to β-actin of the four independent experiments. All data are represented as mean ± SEM; p-values were determined using Student’s t test.
Figure 3.
Figure 3.
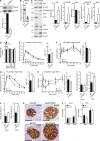
Constitutive NIK activation elicits a defect in insulin secretion. (A) TRAF2 protein levels in WT and βTRAF2 islets isolated from one WT and one βTRAF2 mouse assessed by immunoblotting. A representative of three independent islet isolates tested per genotype is shown. Histogram data depicts mean and SEM cumulative densitometry data relative to β-actin of the three independent experiments. (B) Relative expression of islet TRAF2 mRNA from six WT and nine βTRAF2 islet isolates was determined by RT-PCR. Data are representative of two independent experiments. ***, P < 0.001. (C) Protein levels of NIK, IKKα/β phosphorylation, IκBα, p100 to p52 processing, and RelB in one nonstimulated WT and one βTRAF2 islet isolate were assessed by immunoblotting. A representative of three independent experiments is shown. Histogram data depicts cumulative densitometry relative to β-actin of the three independent experiments. (D) Non-fasted blood glucose levels were determined in 30 TRAF2loxP/loxP (WT), 10 RI Cre (WT), and 24 βTRAF2 chow-fed mice at 8-wk-old (***, P < 0.001) and in 15 TRAF2loxP/loxP (WT), 5 RI Cre (WT), and 12 βTRAF2 chow-fed mice at 16 wk of age (n.s.) and in 15 TRAF2loxP/loxP (WT), 5 RI Cre (WT), and 12 βTRAF2 HFD-fed mice at 16 wk old (n.s.). Data are representative of three independent mouse cohorts tested. (E) Blood glucose levels were measured in 15 TRAF2loxP/loxP (WT), 5 RI Cre (WT) and 12 βTRAF2 chow-fed mice (16 wk old) after i.p. injection of d-glucose (WT, dotted line; βTRAF2, solid line). Data are representative of three independent mouse cohorts tested. **, P < 0.01. (F) Insulin levels were measured in six TRAF2loxP/loxP (WT) and six βTRAF2 chow-fed mice (16 wk old) after i.v. injection of d-glucose (WT, dotted line; βTRAF2, solid line). Data are representative of three independent mouse cohorts tested (n.s.). (G) Blood glucose levels were measured in 15 TRAF2loxP/loxP (WT), 5 RI Cre (WT), and 12 βTRAF2 HFD-fed mice (16 wk old) after i.p. injection of d-glucose (WT, dotted line; βTRAF2, solid line). Data are representative of three independent mouse cohorts tested. (***, P < 0.001) (H) Insulin levels were measured in 10 TRAF2loxP/loxP (WT), 5 RI Cre, and 10 βTRAF2 HFD-fed mice (16 wk old) after i.v. injection of d-glucose (WT, dotted line; βTRAF2, solid line). Data are representative of three independent mouse cohorts tested. *, P < 0.05. (I) Pancreatic insulin content in chow- and HFD-fed WT and βTRAF2 mice was determined. The data are mean and SEM derived from five mice per group (chow, n.s.; DIO, *, P < 0.05). (J) Total β cell area was determined for chow- and HFD-fed WT and βTRAF2 mice by quantification of insulin-positive area in serial graft sections as a percentage of total pancreatic exocrine tissue. The data are mean and SEM derived from three mice per group (chow, n.s.; DIO, *, P < 0.05). (K) Insulin immunohistochemistry of histological pancreatic sections of chow- and HFD-fed WT and βTRAF2 mice is shown. The data are representative images of three mice per group. Bars, 100 µm. (L) Insulin-1 and Insulin-2 mRNA expression in chow- and HFD-fed TRAF2loxP/loxP (WT) and βTRAF2 from four (Ins1) and five (Ins2) islet isolates was determined by RT-PCR and is presented as a fold change relative to WT (n.s.; data are representative of two independent experiments). All data are represented as mean ± SEM; p-values were determined using Student’s t test.
Figure 4.
Figure 4.
Deletion of TRAF2 causes impaired glucose tolerance independent of Cre expression in the hypothalamus. (A) Non-fasted blood glucose levels in STZ-treated C57BL/6 recipients transplanted with 150 IEQs of WT (dotted line) and βTRAF2 (solid line) islets were determined. Data are representative of three independent mouse cohorts, in which 15 TRAF2loxP/loxP (WT), 10 RI Cre (WT), and 14 βTRAF2 islet transplant recipients were tested. (B) Blood glucose and AUC were assessed in 8 TRAF2loxP/loxP (WT), 4 RI Cre (WT), and 10 βTRAF2 islet transplant recipients after i.p. injection of d-glucose at day 11 after transplant. Data are representative of three independent mouse cohorts tested. *, P < 0.05. (C) Insulin levels and AUC were assessed in 6 TRAF2loxP/loxP (WT), 4 RI Cre (WT), and 10 βTRAF2 islet transplant recipients after i.v. injection of d-glucose at day 21 after transplant. Data are representative of three independent mouse cohorts tested. *, P < 0.05. (D) H&E staining and insulin immunohistochemistry of WT and βTRAF2 islet grafts are shown. Graft β cell area was determined for three WT and three βTRAF2 islet grafts by quantification of insulin-positive area in continuous serial graft sections. A representative image for each condition is shown. Boxed insets represent magnified area. Differences in graft area are not significant (P > 0.05). Bar, 100 µm. (E) In vitro GSIS in 2, 11, and 20 mM d-glucose and in KCl conditions in WT and βTRAF2 mouse islets was measured. Data are mean and SEM derived from six independent islet isolates for each group, and are representative of two independent experiments. **, P < 0.01. All data are represented as mean ± SEM; p-values were determined using Student’s t test.
Figure 5.
Figure 5.
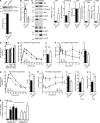
Destabilization of the TRAF2-TRAF3-BIRC2/3 E3 ligase complex results in impaired β cell function. (A) TRAF3 protein levels in WT and βTRAF3 islets from one WT and one βTRAF3 mouse were assessed by immunoblotting. A representative of three independent islet isolates tested per genotype is shown. Histogram data depict mean and SEM cumulative densitometry relative to β-actin of the three independent experiments. (B) Relative expression of islet TRAF3 mRNA in six WT and three βTRAF3 islet isolates was determined by RT-PCR. Data are representative of two independent experiments. ***, P < 0.001. (C) Protein levels of NIK, IKKα/β phosphorylation, IκBα, p100 to p52 processing, and RelB in one nonstimulated WT and one βTRAF3 islet isolate were assessed by immunoblotting. A representative of three independent experiments is shown. Histogram data depict cumulative densitometry relative to β-actin of the three independent experiments. (D) Non-fasted blood glucose levels were determined in 20 TRAF3loxP/loxP (WT) and 12 βTRAF3 chow-fed mice (8 wk old; n.s.); in 20 TRAF3loxP/loxP (WT) and 10 βTRAF3 chow-fed mice at 16 wk old (n.s.); and in 15 TRAF3loxP/loxP (WT) and 12 βTRAF3 HFD-fed mice (16 wk old). *, P < 0.05. Data are representative of three independent mouse cohorts tested. (E) Blood glucose levels were measured in 20 TRAF3loxP/loxP (WT) and 10 βTRAF3 chow-fed mice (16 wk old) after i.p. injection of d-glucose (WT, dotted line; βTRAF3, solid line). Data are representative of three independent mouse cohorts tested. ***, P < 0.001. (F) Insulin levels were measured in six TRAF3loxP/loxP (WT) and six βTRAF3 chow-fed mice (16 wk old) after i.v. injection of d-glucose (WT: dotted line; βTRAF3: solid line). Data are representative of three independent mouse cohorts tested. *, P < 0.05 at 20 min after injection. (G) Blood glucose levels were measured in 15 TRAF3loxP/loxP (WT), 5 RI Cre (WT) and 12 βTRAF3 chow-fed mice (16 wk old) after i.p. injection of d-glucose (WT, dotted line; βTRAF3, solid line). Data are representative of three independent mouse cohorts tested. ***, P < 0.001. (H) Insulin levels were measured in 10 TRAF3loxP/loxP (WT), 5 RI Cre, and 8 βTRAF3 HFD-fed mice (16 wk old) after i.v. injection of d-glucose (WT, dotted line; βTRAF3, solid line). Data are representative of three independent mouse cohorts tested. *, P < 0.05. (I) Pancreatic insulin content in HFD-fed WT and βTRAF3 mice was determined. The data are mean and SEM derived from five mice per group (n.s.; P = 0.072). (J) Total β cell area was determined for HFD-fed WT and βTRAF3 mice by quantification of insulin-positive area in serial graft sections as a percentage of total pancreatic exocrine tissue. The data are mean and SEM derived from three mice per group. *, P < 0.05. (K) In vitro GSIS in 2, 11, and 20 mM d-glucose. KCl conditions in WT and βTRAF3 mouse islets were measured. Data are mean and SEM derived from six independent islet isolates for each group and are representative of two independent experiments. *, P < 0.05. All data are represented as mean ± SEM; p-values were determined using Student’s t test.
Figure 6.
Figure 6.
Genetic ablation of BIRC2 and 3 phenocopies βTRAF2 and βTRAF3 mice. (A) Protein levels of p100 to p52 processing in one WT and one βBIRC2/3 islet isolate were assessed by immunoblotting. A representative of three independent experiments is shown. Histogram data depicts cumulative densitometry relative to β-actin of the three independent experiments. (B) Blood glucose and AUC were measured in 20 WT and 6 βBIRC2/3 HFD-fed mice (16 wk old) after i.p. injection of d-glucose. Data are representative of three independent mouse cohorts tested. **, P < 0.01. (C) Insulin levels and AUC were measured in six WT and six βBIRC2/3 HFD-fed mice (16 wk old) after i.v. injection of d-glucose. Data are representative of three independent mouse cohorts tested. *, P < 0.05. All data are represented as mean ± SEM; p-values were determined using Student’s t test.
Figure 7.
Figure 7.
Differentially regulated genes and expression validation by RT-PCR in βTRAF2 and βTRAF3 islets. (A) Venn diagram of the number of differentially regulated genes in βTRAF2 chow, βTRAF3 chow, βTRAF2 DIO, and βTRAF3 DIO mice compared with respective WT controls is shown. (B) A validation of gene microarray results was assessed by RT-PCR in βTRAF2 and βTRAF3 islets. The expression levels of Tph1, Lrrc55, Hcn1, Tnfrsf11b (OPG), Rasgrp1, Grem2, and Pde7b were examined in five βTRAF2 and five βTRAF3 islet isolates and are presented as a fold change relative to three TRAF2loxP/loxP and three TRAF3loxP/loxP (WT) islet isolates. Data are representative of two independent experiments. **, P < 0.01; ***, P < 0.001; ****, P < 0.0001. Data are represented as mean ± SEM; p-values were determined using Student’s t test.

Comment in

  • Saving β cell function in the NIK of time.
    Tarbell KV, Rane SG. Tarbell KV, et al. J Exp Med. 2015 Jul 27;212(8):1140-1. doi: 10.1084/jem.2128insight2. J Exp Med. 2015. PMID: 26216602 Free PMC article. No abstract available.

Similar articles

Cited by

References

    1. Ambra R., Manca S., Palumbo M.C., Leoni G., Natarelli L., De Marco A., Consoli A., Pandolfi A., and Virgili F.. 2014. Transcriptome analysis of human primary endothelial cells (HUVEC) from umbilical cords of gestational diabetic mothers reveals candidate sites for an epigenetic modulation of specific gene expression. Genomics. 103:337–348. 10.1016/j.ygeno.2014.03.003 - DOI - PubMed
    1. Ammälä C., Eliasson L., Bokvist K., Berggren P.O., Honkanen R.E., Sjöholm A., and Rorsman P.. 1994. Activation of protein kinases and inhibition of protein phosphatases play a central role in the regulation of exocytosis in mouse pancreatic beta cells. Proc. Natl. Acad. Sci. USA. 91:4343–4347. 10.1073/pnas.91.10.4343 - DOI - PMC - PubMed
    1. Bernstein L.E., Berry J., Kim S., Canavan B., and Grinspoon S.K.. 2006. Effects of etanercept in patients with the metabolic syndrome. Arch. Intern. Med. 166:902–908. 10.1001/archinte.166.8.902 - DOI - PMC - PubMed
    1. Bonizzi G., Bebien M., Otero D.C., Johnson-Vroom K.E., Cao Y., Vu D., Jegga A.G., Aronow B.J., Ghosh G., Rickert R.C., and Karin M.. 2004. Activation of IKKalpha target genes depends on recognition of specific kappaB binding sites by RelB:p52 dimers. EMBO J. 23:4202–4210. 10.1038/sj.emboj.7600391 - DOI - PMC - PubMed
    1. Bradfield J.P., Qu H.Q., Wang K., Zhang H., Sleiman P.M., Kim C.E., Mentch F.D., Qiu H., Glessner J.T., Thomas K.A., et al. . 2011. A genome-wide meta-analysis of six type 1 diabetes cohorts identifies multiple associated loci. PLoS Genet. 7:e1002293 10.1371/journal.pgen.1002293 - DOI - PMC - PubMed

Publication types