. 2015 Jul 1;125(7):2825-40.
doi: 10.1172/JCI78753. Epub 2015 Jun 22.

Mature T cell responses are controlled by microRNA-142

Mature T cell responses are controlled by microRNA-142

Yaping Sun et al. J Clin Invest. .

Abstract

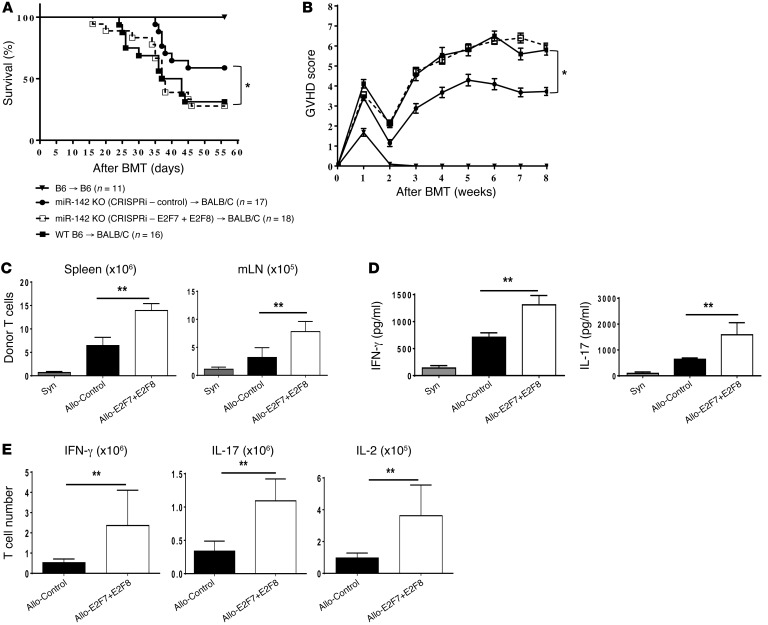
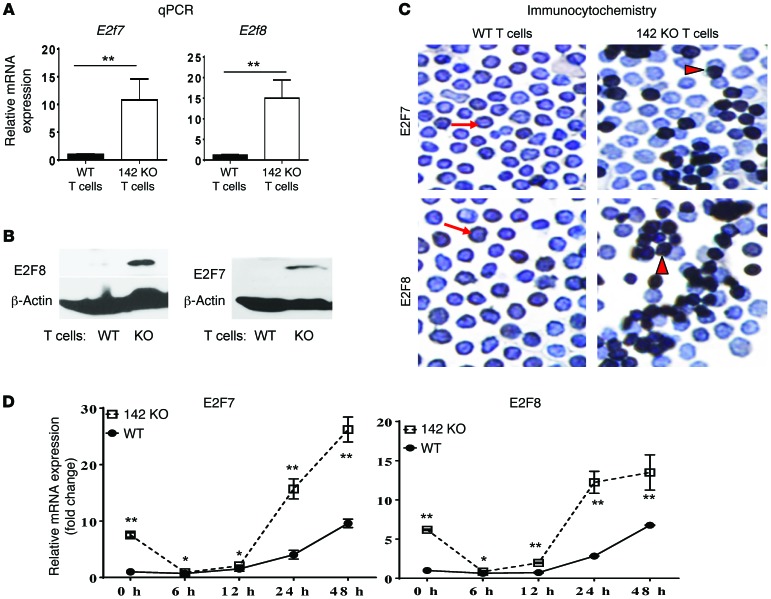
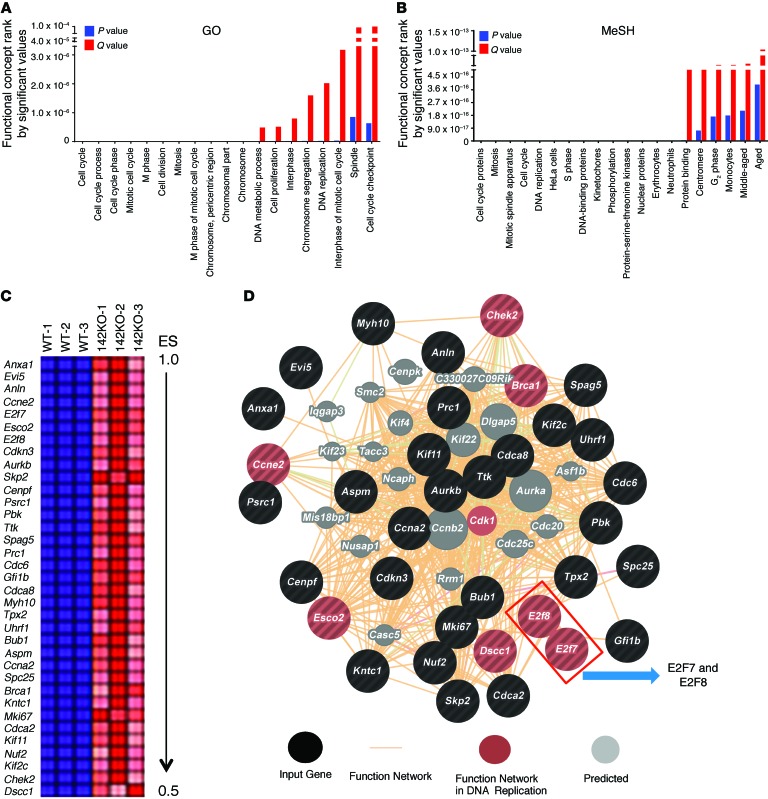
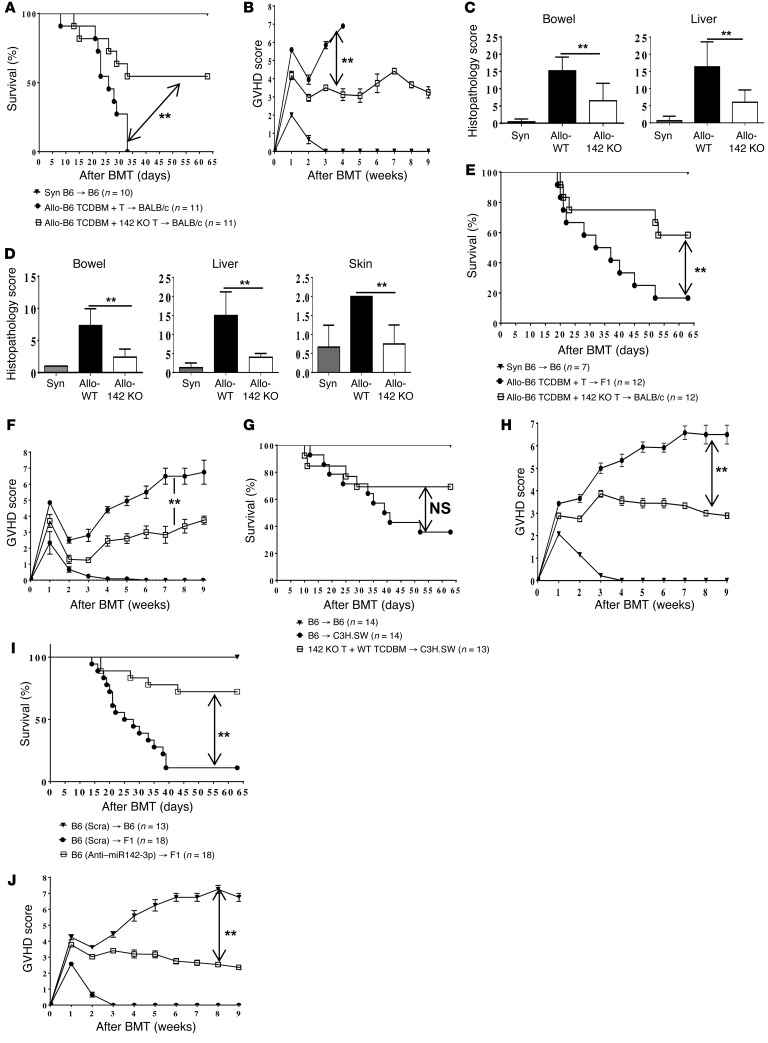
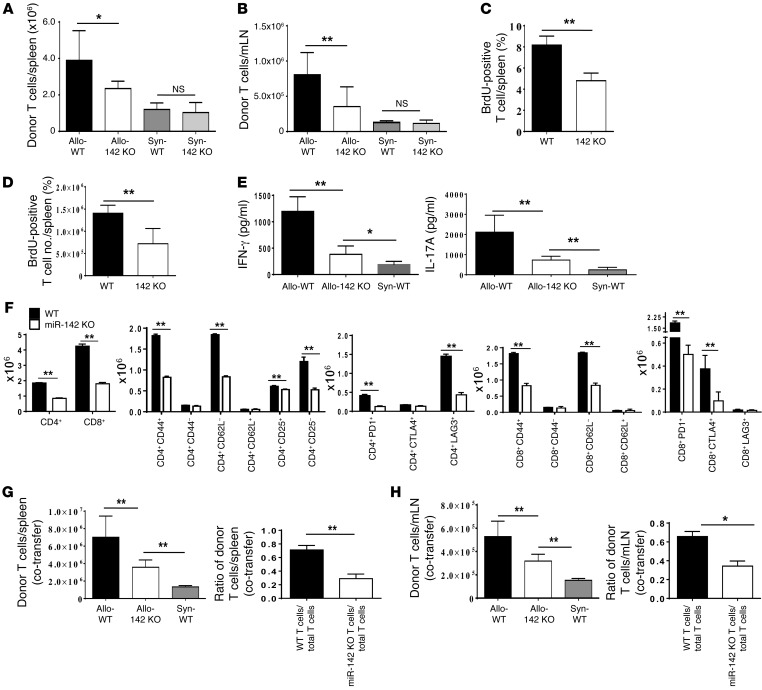
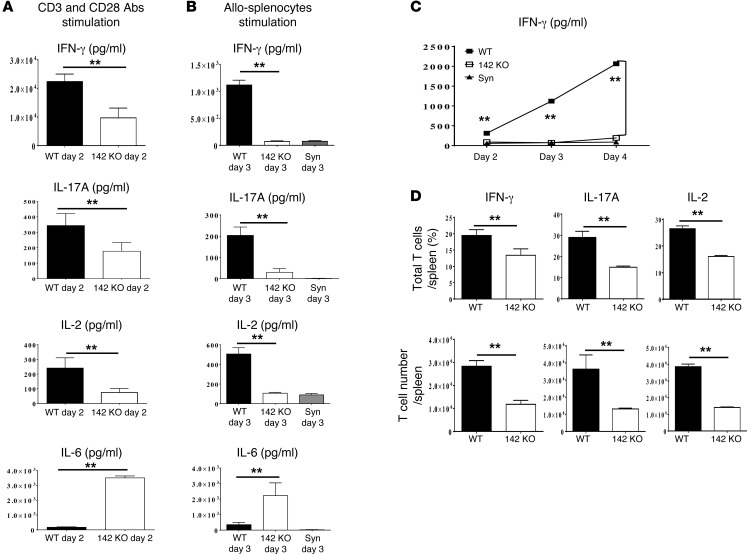
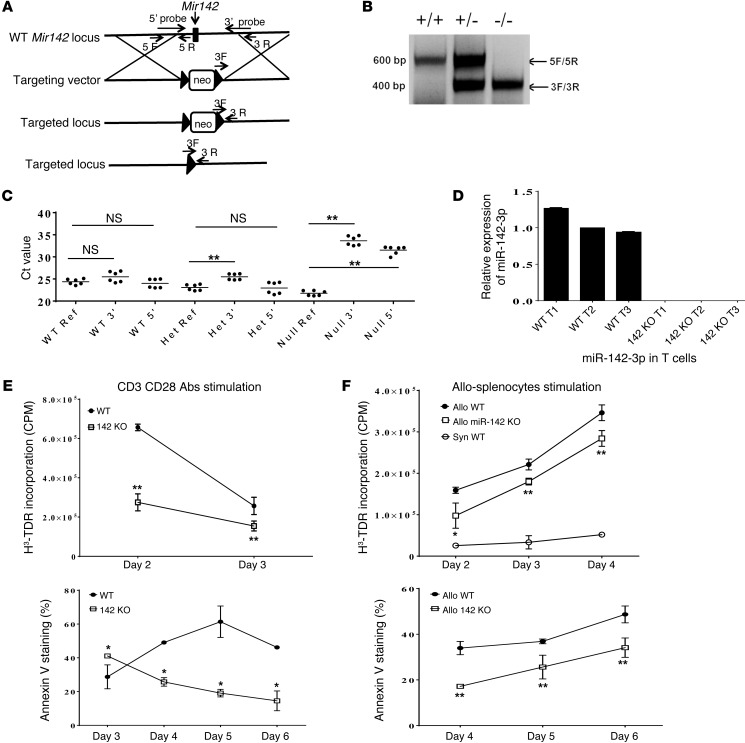
T cell proliferation is critical for immune responses; however, the molecular mechanisms that mediate the proliferative response are poorly understood. MicroRNAs (miRs) regulate various molecular processes, including development and function of the immune system. Here, utilizing multiple complementary genetic and molecular approaches, we investigated the contribution of a hematopoietic-specific miR, miR-142, in regulating T cell responses. T cell development was not affected in animals with a targeted deletion of Mir142; however, T cell proliferation was markedly reduced following stimulation both in vitro and in multiple murine models of graft-versus-host disease (GVHD). miR-142-deficient T cells demonstrated substantial cell-cycling defects, and microarray and bioinformatics analyses revealed upregulation of genes involved in cell cycling. Moreover, 2 predicted miR-142 target genes, the atypical E2F transcription factors E2f7 and E2f8, were most highly upregulated in miR-142-deficient cells. Clustered regularly interspaced short palindromic repeat interference-mediated (CRISPRi-mediated) silencing of E2F7 and E2F8 in miR-142-deficient T cells ameliorated cell-cycling defects and reduced GVHD, and overexpression of these factors in WT T cells inhibited the proliferative response. Together, these results identify a link between hematopoietic-specific miR-142 and atypical E2F transcription factors in the regulation of mature T cell cycling and suggest that targeting this interaction may be relevant for mitigating GVHD.


Figures

Figure 8
Figure 8. Upregulated expression of E2F7/E2F8 in miR-142 KO T cells contributes to reduced GVHD.
(A and B) B6 to BALB/c GVHD model. Targeted silencing of E2F7/E2F8 in miR-142 KO T cells was processed as described in Methods. Recipients were conditioned and transplanted as in Figure 4A. Percentage survival (A) and GVHD score (B). Data were from 2 independent experiments. (C) Improved in vivo proliferation of miR-142 KO T cells after targeted silencing of atypical E2Fs. T cell expansion was examined on day 7 after BMT as in A. Absolute numbers of donor T cells in spleen and mLN were analyzed as described in Methods. Data were from 5 mice in each group (mean ± SEM). (D) Enhanced cytokine expression in vivo after targeted silencing of E2F7/E2F8 in miR-142 KO T cells. Concentrations of IFN-γ and IL-17A in sera from mice as in C were measured by ELISA (mean ± SEM). Data were combined from 5 mice in each group. (E) Increased absolute numbers of T cells expressing IFN-γ, IL-17A, and IL-2 in miR-142 KO T cells after targeted silencing of E2F7/E2F8. Splenic T cells from C were processed for intracellular staining for IFN-γ, IL-17A, and IL-2 as described in Methods. Combined results were from 5 mice for each group (mean ± SEM). *P < 0.05; **P < 0.01, log-rank test (A), Mann-Whitney U test (B), unpaired t test (CE).
Figure 7
Figure 7. miR-142 regulates T cell cycling in E2F7/E2F8-dependent manner.
(A) Impact of overexpression of atypical E2F proteins on cell cycle in WT T cells. WT T cells were infected with E2F7/E2F8 lentiviral particles, treated with anti-CD3 and anti-CD28 Abs, and analyzed for cell cycle. Combined data were from 3 independent experiments. (B) Overexpression of E2F7/E2F8 significantly inhibited T cell proliferation, as demonstrated by 3H-TdR incorporation. Data represent combination of 3 independent experiments. (C) Impact of E2F7/E2F8 silencing on cell cycle in miR-142 KO T cells. miR-142 KO T cells were targeted for E2F7/E2F8 silencing as described in Methods, then treated with anti-CD3 and anti-CD28 Abs for 0 to 3 days. Cell-cycle analyses were processed. Combined data were from 3 independent experiments. (D) KD of E2F7/E2F8 in miR-142 KO T cells significantly improved cell proliferation, as demonstrated by 3H-TdR incorporation. Data represent combination of 3 independent experiments. (E) Essential role of E2F7/E2F8 in cell-cycle activities in WT T cells. WT T cells were targeted for E2F7/E2F8 silencing, treated with anti-CD3 and anti-CD28 Abs for 0 to 4 days, and processed for cell-cycle analyses as in C. Data were combined from 3 independent experiments. (F) KD of E2F7/E2F8 in WT T cells significantly enhanced cell proliferation as demonstrated by 3H-TdR incorporation. Data represent combination of 3 independent experiments. Data are shown as mean ± SEM. *P < 0.05; **P < 0.01, Holm-Sidak method (A, C, and E); unpaired t test (B, D, and F).
Figure 6
Figure 6. Atypical E2F proteins were significantly upregulated in miR-142 KO T cells.
(A) Confirming upregulated E2f7 and E2f8 in miR-142 KO T cells using qPCR. Combined results (mean ± SEM) were from 3 independent experiments as shown in Supplemental Figure 10A. P values were obtained using the unpaired t test. (B) Western blotting demonstrated that E2F7 and E2F8 were upregulated in miR-142 KO T cells. Data are representative of 3 independent experiments. (C) Confirming upregulated E2F7 and E2F8 in miR-142 KO T cells using ICC. Purified T cells from either miR-142 KO or WT mice were spread onto polylysine-precoated slides by cytocentrifugation and processed for ICC with specific Abs against E2F7 and E2F8. Dark brown staining in cytoplasm was observed, as indicated by arrows. Much stronger (darker brown) staining was observed in miR-142 KO T cells, as indicated by arrowheads. Data are representative of 3 similar experiments. Original magnification, ×400. (D) Significantly increased expression of E2F7 and E2F8 in response to anti-CD3 and anti-CD28 Ab stimulation. Dynamic observation of expression of E2F7 and E2F8 in response to in vitro stimulation with anti-CD3 and anti-CD28 Abs was conducted for 0–48 hours. Data represent combination of 3 independent experiments (mean ± SEM). P values were obtained using multiple t test. *P < 0.05; **P < 0.01.
Figure 5
Figure 5. Upregulated genes in miR-142 T cells were markedly highlighted in the cell-cycle functional network.
(A and B) Upregulated genes in miR-142 KO T cells identified in Affymetrix microarray were analyzed for gene function concept based on multiple databases, including GO (A) and the MeSH database (B). The analyzed data were ranked by P values (blue bars) and Q values (FDR, red bar). Data were obtained from 3 biological triplicates. (C) The gene set that is involved in the cell-cycle function concept was analyzed for enrichment by GSEA. The top 35 genes received 0.5–1 enrichment scores. The enrichment score ranking list is shown in Supplemental Table 2. Data were obtained from 3 biological triplicates. (D) The top 35 enriched genes were further analyzed for function network by GeneMANIA. Atypical E2F proteins (E2F7 and E2F8) were highlighted in the function network of DNA replication. Data were obtained from 3 biological triplicates.
Figure 4
Figure 4. miR-142 KO T cells induced less severe GVHD.
Recipients in experiments represented in AJ were conditioned and transplanted as described in Methods. (A and B) B6 (H2b) into BALB/c( H2d) GVHD model. (A) Percentage survival. P values based on comparisons between animals that received either TCD BM plus WT T cells (circles) or TCD BM plus miR-142 KO T cells (squares) were obtained using the log-rank test. Combined data were from 2 independent experiments. (B) GVHD score. Combined data were from 2 independent experiments. (C and D) Histopathological analysis of the B6 into BALB/c BMT model. Bowel (small and large intestine), liver, and skin were obtained after BMT on day 14 (C) or 21 (D) (n = 5–7/each group). GVHD scores were from 2 independent experiments. P values were obtained using unpaired t test. E-F B6 (H2b) to B6D2F1 (F1) (H2bxd) model. Survival curves (E) and GVHD scores (F) were analyzed as in A and B. Combined data were from 2 independent experiments. (G and H) B6 (H2b) to CH3.SW (H2b) GVHD model. The survival curves (G) and GVHD scores (H) were analyzed as in A and B. Data were collected from 2 independent experiments. (I and J) In vivo KD of miR-142 significantly reduced GVHD severity and improved survival after MHC-mismatched allogeneic BMT (B6 to B6D2F1 model). Recipients were administered saline-formulated LNA–anti–miR-142–3p. The survival curves (I) and GVHD scores (J) were analyzed as in A. Data were collected from 3 independent experiments. P values for GVHD scores in B, F, H, and J were obtained using the Mann-Whitney U test. **P < 0.01.
Figure 3
Figure 3. miR-142 KO T cells altered in cytokine expression and proliferative responses in vivo.
(A and B) T cell proliferation in vivo. After 7 days in B6 into BALB/c BMT model, absolute donor T cell numbers for spleen (A) and mLN (B) were calculated from each individual animal. Data were combined from 2 independent experiments (n = 6–10). (C and D) BrdU incorporation in vivo. Similarly to what was shown in A, splenocytes were stained with Abs against H2b, CD3, and BrdU. Percentages (C) and absolute T cell numbers (D) positive for BrdU were calculated by gating for H2b+, CD3+, and BrdU+. Data were combined from 2 independent experiments (n = 6–10). (E) Cytokine expression in vivo. Using sera collected from transplanted mice as in A, concentrations of IFN-γ and IL-17A were measured by ELISA. Data were combined from 3 independent experiments (n = 12–14). (F) Phenotype analyses of transferred donor T cells. Similarly to what was shown in A, splenocytes were analyzed with FACS (n = 4). (G and H) WT and miR-142 KO T cells cotransfer model. Using modified BMT model as shown in A, T cells from either WT mice (ly5.2/CD45.1) or miR-142 KO mice (ly5.1/CD45.2) were cotransferred into the BALB/c recipients. After 7 days, donor T cells in spleen (G) and mLN (H) were analyzed using FACS staining. The ratios of 2 populations were analyzed based on total donor T cells obtained. Data were combined from 2 independent experiments (n = 6–10). Data were mean ± SEM. *P < 0.05; **P < 0.01, by unpaired t test for (AF) and paired t test for (G and H).
Figure 2
Figure 2. miR-142 KO T cells altered in cytokine expression and proliferative responses in vitro.
(A and B) ELISA measurements demonstrated significantly lower production of IFN-γ, IL-17A, and IL-2, but greater IL-6 production in miR-142 KO T cells compared with WT T cells when stimulated with anti-CD3 and anti-CD28 Abs (A) or allogeneic splenocytes (B). Combined results were from 3 independent experiments (mean ± SEM). P values were obtained using unpaired t test. (C) Less IFN-γ production was dynamically observed from 2 to 4 days in miR-142 KO T cells compared with WT T cells when stimulated with anti-CD3 and anti-CD28 Abs. Combined results were from 3 independent experiments (mean ± SEM). P values were obtained using the Holm-Sidak method. (D) Lower percentages and absolute numbers of T cells expressing IFN-γ, IL-17A, and IL-2 in miR-142 KO T cells compared with WT mice. Splenic T cells isolated from WT or miR-142 KO mice were treated with 1× cell stimulation cocktail (plus protein transport inhibitors 1:500, eBioscience, 00-4975) for 6 hours, stained for APC-conjugated CD90.2, then processed for fixation and permeabilization and incubated in a predetermined optimum concentration of PE-conjugated Abs of interest (against IFN-γ, IL-17A, or Il-2). Positive-stained T cells for IFN-γ, IL-17A, and IL-2 were analyzed as described in Methods. Combined results were from 3 independent experiments (mean ± SEM). P values were obtained using unpaired t test. **P < 0.01.
Figure 1
Figure 1. Generation of miR-142 KO mice and its impact on T cell functional responses.
(A) Scheme of the Mir142 locus and targeting vector used to generate Mir142 null alleles. 5′ and 3′ arm probes (5′ probe and 3′ probe) and 5′ and 3′ primers (5F/5R and 3F/3R) for genotyping are shown. (B) A representative genotyping result illustrating WT (Mir142+/+), heterozygous (Mir142+/–), and null mice (Mir142–/–). (C) Zygosity determination by TaqMan qPCR using Tert as positive control and probes specific for 3′ and 5′ arms designed for Mir142 gene homologous recombination to confirm the deletion of the Mir142 gene in homozygous KO mice and single-copy loss in heterozygous mice. Data represent a combination of 6 independent experiments. P values were obtained using unpaired t test. **P < 0.01. (D) The loss of miR-142 expression at the RNA level in purified T cells from miR-142 KO mice confirmed by TaqMan qPCR using specific probes against miR-142–3p. Data represent a combination of 3 independent experiments. (E and F) Significantly reduced proliferation of miR-142 KO T cells determined by tritium incorporation and decreased apoptosis determined by annexin V staining when stimulated in vitro with anti-CD3 and anti-CD28 Abs for 2 to 6 days (E) or stimulated in vitro with allogeneic (allo) splenocytes for 2 to 6 days (F). Syn, syngeneic. Data shown represent results from 3 or 4 independent experiments (mean ± SEM). P values were obtained using the Holm-Sidak method. *P < 0.05; **P < 0.01.

Similar articles

Cited by

References

    1. Ferrara JL, Levine JE, Reddy P, Holler E. Graft-versus-host disease. Lancet. 2009;373(9674):1550–1561. doi: 10.1016/S0140-6736(09)60237-3. - DOI - PMC - PubMed
    1. Paczesny S, Hanauer D, Sun Y, Reddy P. New perspectives on the biology of acute GVHD. Bone Marrow Transplant. 2010;45(1):1–11. doi: 10.1038/bmt.2009.328. - DOI - PMC - PubMed
    1. Banerjee A, Schambach F, DeJong CS, Hammond SM, Reiner SL. Micro-RNA-155 inhibits IFN-γ signaling in CD4+ T cells. Eur J Immunol. 2010;40(1):225–231. - PMC - PubMed
    1. Haasch D, et al. T cell activation induces a noncoding RNA transcript sensitive to inhibition by immunosuppressant drugs and encoded by the proto-oncogene, BIC. Cell Immunol. 2002;217(1–2):78–86. - PubMed
    1. Rodriguez A, et al. Requirement of bic/microRNA-155 for normal immune function. Science. 2007;316(5824):608–611. doi: 10.1126/science.1139253. - DOI - PMC - PubMed

Publication types

MeSH terms