. 2015 Jun 16;42(6):1100-15.
doi: 10.1016/j.immuni.2015.05.015.

Artery Tertiary Lymphoid Organs Control Aorta Immunity and Protect against Atherosclerosis via Vascular Smooth Muscle Cell Lymphotoxin β Receptors

Affiliations

Artery Tertiary Lymphoid Organs Control Aorta Immunity and Protect against Atherosclerosis via Vascular Smooth Muscle Cell Lymphotoxin β Receptors

Desheng Hu et al. Immunity. .

Abstract

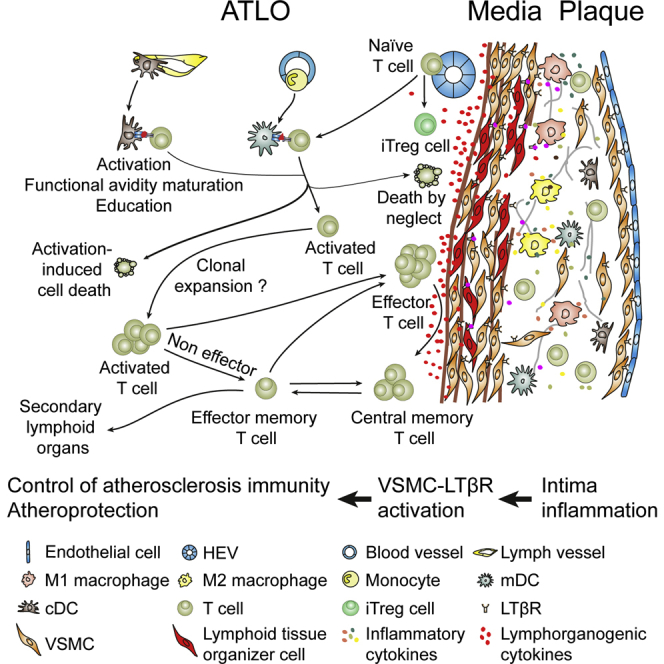
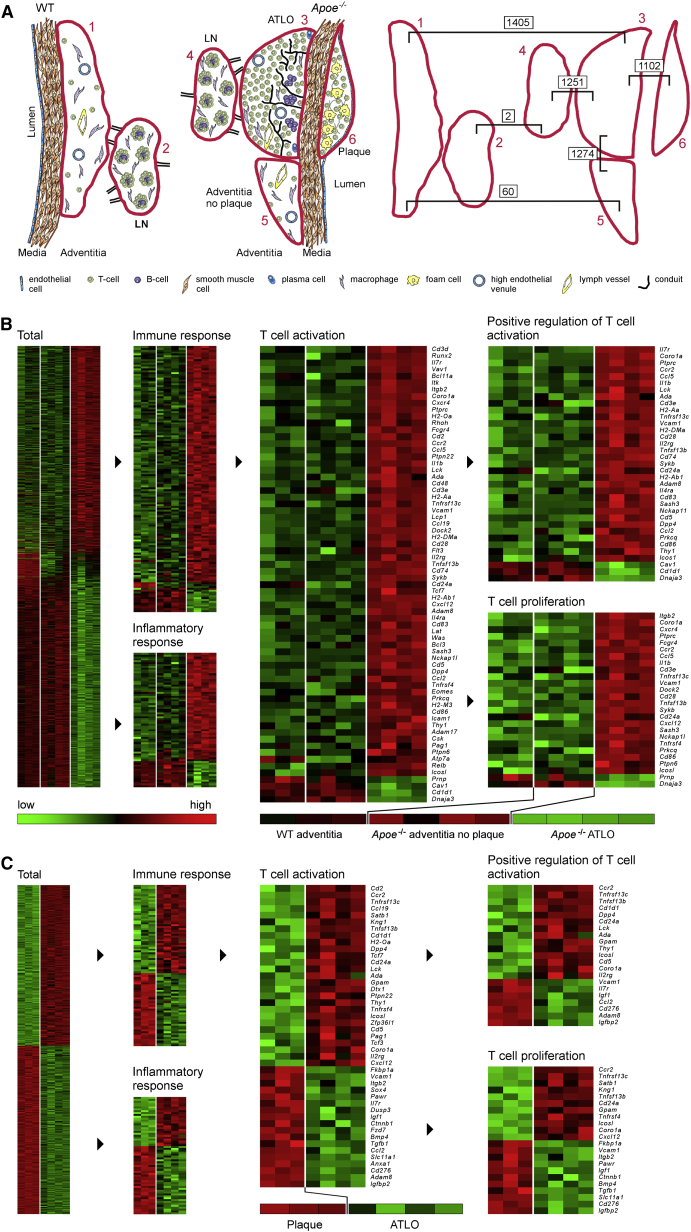
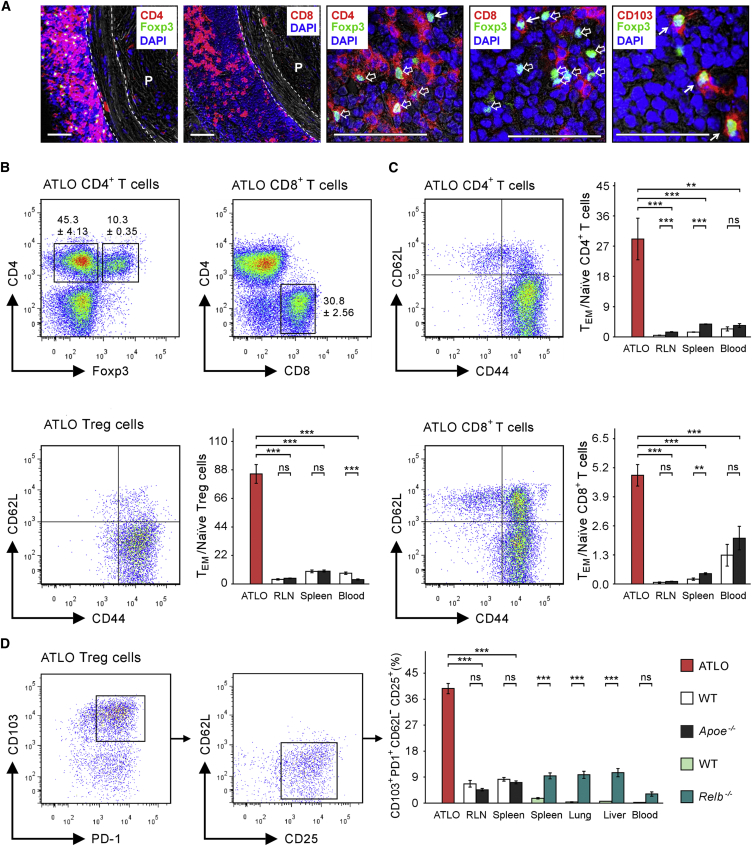
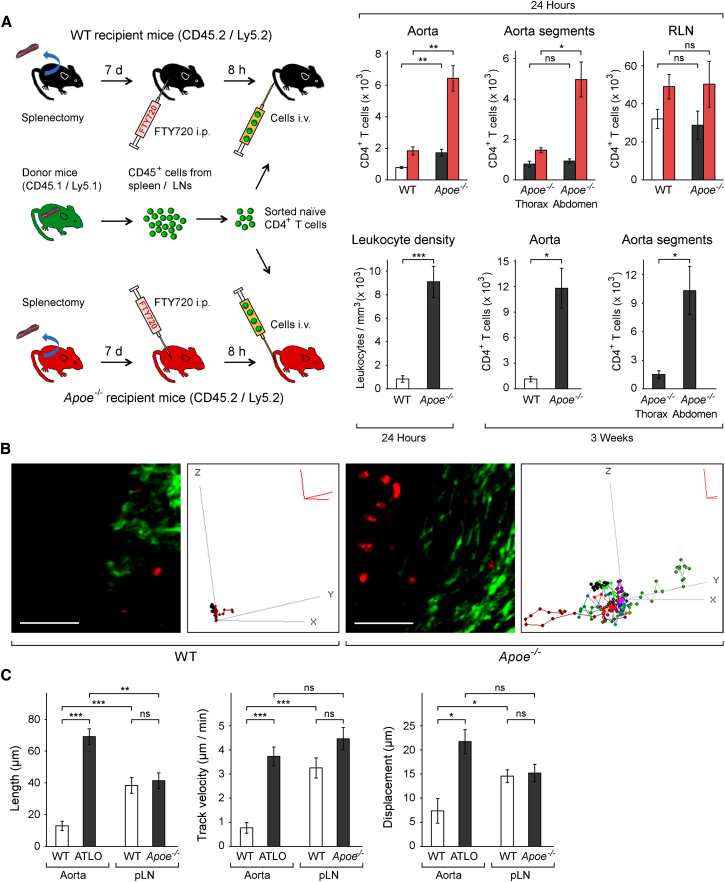
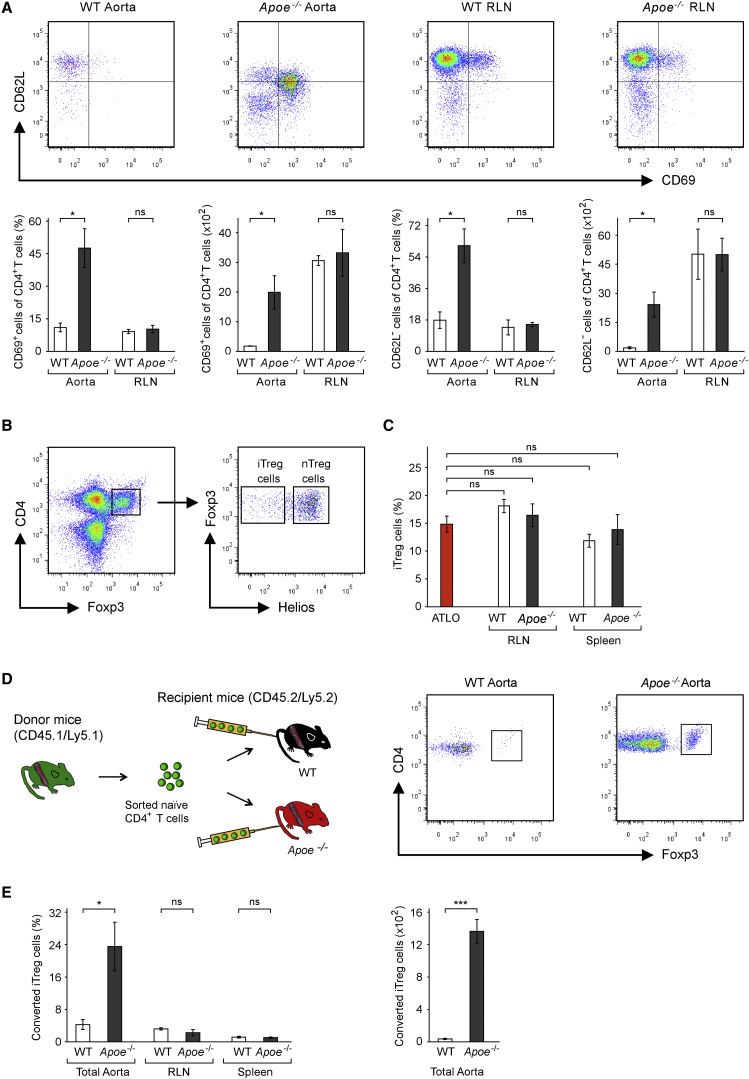
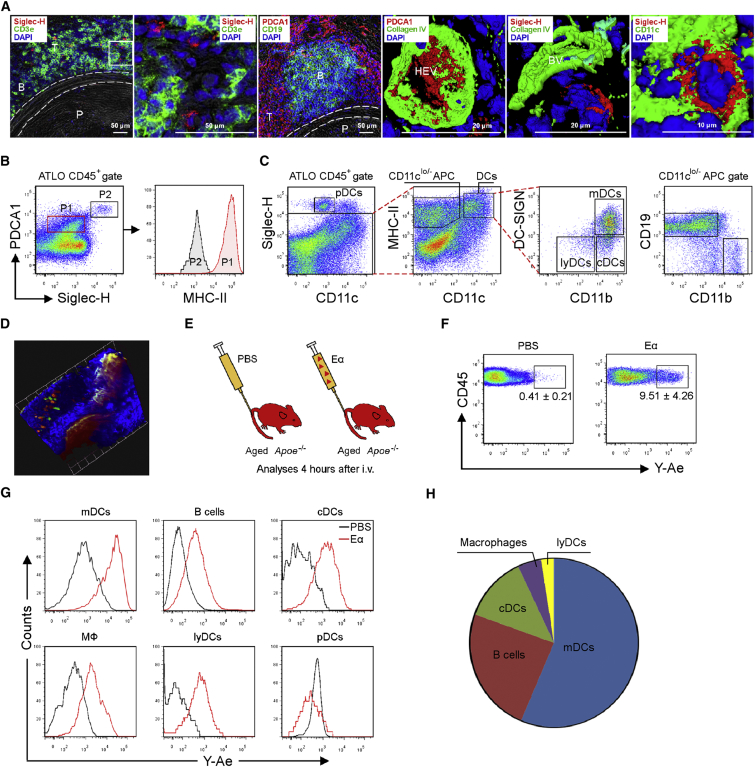
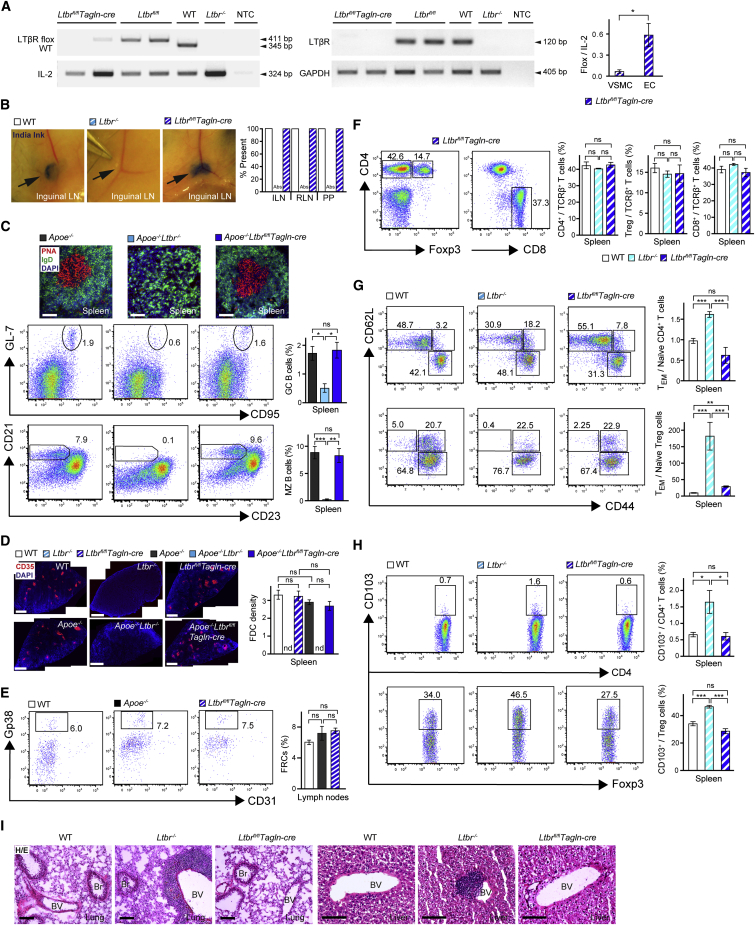
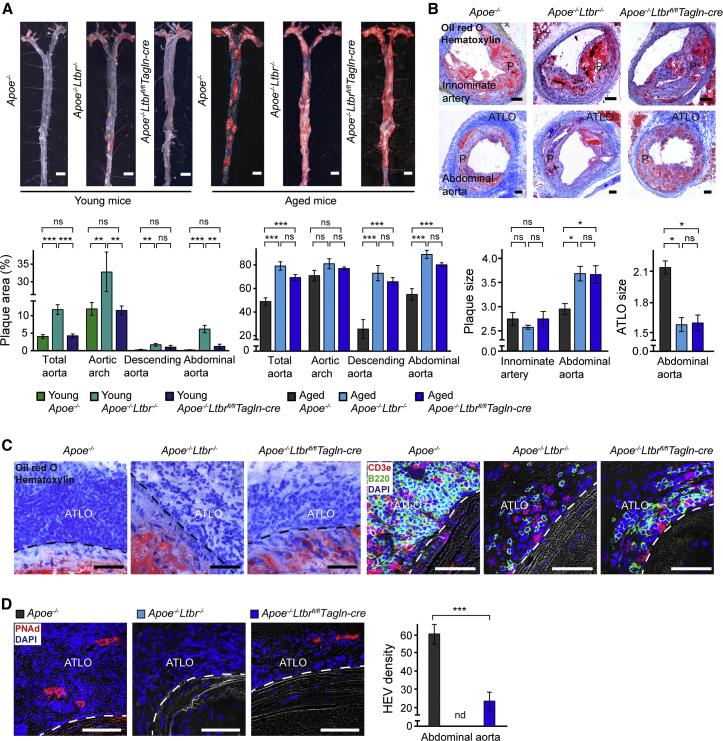
Tertiary lymphoid organs (TLOs) emerge during nonresolving peripheral inflammation, but their impact on disease progression remains unknown. We have found in aged Apoe(-/-) mice that artery TLOs (ATLOs) controlled highly territorialized aorta T cell responses. ATLOs promoted T cell recruitment, primed CD4(+) T cells, generated CD4(+), CD8(+), T regulatory (Treg) effector and central memory cells, converted naive CD4(+) T cells into induced Treg cells, and presented antigen by an unusual set of dendritic cells and B cells. Meanwhile, vascular smooth muscle cell lymphotoxin β receptors (VSMC-LTβRs) protected against atherosclerosis by maintaining structure, cellularity, and size of ATLOs though VSMC-LTβRs did not affect secondary lymphoid organs: Atherosclerosis was markedly exacerbated in Apoe(-/-)Ltbr(-/-) and to a similar extent in aged Apoe(-/-)Ltbr(fl/fl)Tagln-cre mice. These data support the conclusion that the immune system employs ATLOs to organize aorta T cell homeostasis during aging and that VSMC-LTβRs participate in atherosclerosis protection via ATLOs.


Figures

None
Graphical abstract
Figure 1
Figure 1
Transcript Atlases Reveal a High Degree of Territoriality of Gene Expression in the Arterial Wall (A) Anatomy of WT and Apoe−/− aortas and RLNs (left) and the numbers of differentially expressed mRNAs in two-tissue comparisons (right) are shown of 78- to 85-week-old mice. Student’s t test with Benjamini-Hochberg correction; n = 3 WT and Apoe−/− mice except n = 4 for Apoe−/− adventitia no plaque and n = 4 for ATLOs. (B) Adventitia cluster show total differentially expressed genes (left) and mRNAs in respective GO terms (right). (C) Plaque-ATLO cluster is shown in respective GO terms (right). Cluster analyses were performed using ANOVA with Benjamini-Hochberg correction. Signal intensities and statistics are reported in Table S1 (see also Figure S3).
Figure 2
Figure 2
ATLOs Harbor Distinct Sets of TCRβ+ T Cell Subtypes (A) T cell abundance in ATLOs versus plaques. Immunofluorescence detection of 78- to 85-week-old Apoe−/− CD4+ Treg cells, and CD8+ T cells in ATLOs versus plaques (P) (two left panels); CD4+ Treg cells (middle; open arrows); CD4 Treg cells (middle; closed arrow); CD8+ Treg cells (second right; closed arrow); and CD103+ Treg cells (right; closed arrows) in T cell areas (n = 3 mice). Dotted lines indicate media. DAPI stains nuclei. Scale bars represent 50 μm for two left panels and 100 μm for three right panels. (B) Lymphocyte subsets in ATLOs. Flow cytometry plots show ATLO CD4+Foxp3 T cells, CD4+Foxp3+ Treg cells (left), and CD8+ T cells (right) from the TCRβ+ cell gate of 78- to 85-week-old Apoe−/− mice. (C) Naive and TEM cells in ATLO T cell subsets. Abundance of TEM cells (CD62LCD44+), TCM cells (CD62L+CD44+), naive cells (CD62L+CD44) in CD4+ T cells, Treg cells, and CD8+ T cells in ATLOs versus RLNs, spleen, and blood of 78- to 85-week-old Apoe−/− mice. (D) ATLO Treg cell phenotype. 40% of ATLO Treg cells are CD103+PD1+CD62LCD25+ contrasting to those in 78- to 85-week-old WT and Apoe−/− spleen and LN, and in 9- to 12-week-young WT and Relb−/− spleen, lung, liver, and blood. Flow cytometry data are representative of three independent experiments with pooled one to two mice per genotype per experiment with two technical replicates (B and C), or with one mouse per genotype (D). Means ± SEM, and p values corrected for multiple testing (Bonferroni) were estimated using the GEE model. p ≤ 0.05; ∗∗p ≤ 0.01; ∗∗∗p ≤ 0.001 (see also Figure S4).
Figure 3
Figure 3
ATLOs Recruit Naive CD4+ T Cells into the Diseased Arterial Wall and Alter Lymphocyte Motility (A) Recruitment of naive CD4+ T cells. Experimental approach with 78- to 85-week-old recipient and 9- to 12-week-old donor mice. Ly5.1 naive CD4+ (CD4+CD62L+CD69CD25CD44) T cells were analyzed at 24 hr (upper three right panels) or after 3 weeks (lower two right panels) in total aortas (upper left, red columns), aorta segments (upper middle, red columns), and/or RLNs (upper right, red columns). Control mice were not splenectomized or FTY720-treated (WT open columns; Apoe−/− mice black columns). Means ± SEM of upper three and lower two right panels (n = 3 experiments with one mouse per genotype per experiment) were determined by two-sided Student’s t test. p ≤ 0.05, ∗∗p ≤ 0.01, ∗∗∗p ≤ 0.001. Leukocyte density in Apoe−/− (n = 8 mice) or WT (n = 11 mice) abdominal adventitiae was determined by MPLSM 24 hr after i.v. injection of CMTPX-labeled leukocytes (lower left panel). A two-tailed Wilcoxon-Mann-Whitney test was applied on mouse means. (B) Leukocyte movement. 3D plots of leukocyte movement in ATLOs or WT adventitiae were generated from MPLSM by placing the starting point of each track at the origin of the axes (Movies S1 and S2). Scale bars represent 80 μm; Scale red axis represents 10 μm. (C) Leukocyte motility. Parameters: length, track velocity, and displacement were determined by MPLSM in 78- to 85-week-old Apoe−/− (n = 8 mice) or WT (n = 11 mice) abdominal aorta adventitiae or in Apoe−/− (n = 9 mice) or WT (n = 9 mice) popliteal LNs (pLNs) as described in the Experimental Procedures. Two-tailed Wilcoxon-Mann-Whitney test corrected for multiple testing (Bonferroni) was performed on mouse means. p ≤ 0.05, ∗∗p ≤ 0.01, ∗∗∗p ≤ 0.001.
Figure 4
Figure 4
ATLOs Prime Naive CD4+ T Cells and Convert Some of Them into iTreg Cells (A) Activation of naive CD4+ T cells in situ. 78- to 85-week-old Apoe−/− or WT mice were splenectomized and FTY720-treated as described in Figure 3A. Ly5.1 cells were analyzed by flow cytometry at 24 hr in total aortas or RLNs for CD62L and CD69 expression (upper panel), and their absolute numbers and frequencies among recruited cells (lower panel) (see also Figures S5). (B) nTregs and iTregs in ATLOs. CD4+Foxp3+ Treg cells in ATLOs were analyzed for Helios expression. (C) Frequencies of iTreg cells in total CD4+Foxp3+ Treg cells. (D) Conversion of naive CD4+ cells into iTregs. Experimental approach to determine naive CD4+ (CD4+CD62L+CD69CD25CD44) T cell conversion into iTreg cells (left), and flow cytometry shows the converted Foxp3+ iTreg cells from the transfer cell gate after 3 weeks. (E) Quantification of converted iTreg cells from migrated naive CD4+ T cells 3 weeks after transfer. Data are representative of three (A, D, and E), or four (B and C) experiments with one mouse per genotype per experiment. Two-tailed Student’s t test for (A) and (E); two-tailed Wilcoxon-Mann-Whitney test corrected for multiple testing (Bonferroni) for (C). p ≤ 0.05, ∗∗p ≤ 0.01, ∗∗∗p ≤ 0.001.
Figure 5
Figure 5
ATLOs Present Antigen by an Unusual Set of APCs (A) PDCA1+ and Siglec-H+ cells in ATLOs. Immunofluorescence staining show preferential location of Siglec-H+ pDCs in CD3+ T cell area (T) of ATLO and at higher magnification of boxed area (first two panels), the staining of PDCA1+ cells in ATLO T cell area and 3D-reconstructed colocalization of PDCA1 with Collagen IV in HEV endothelial cells (second two panels), and 3D-reconstructed co-staining of Siglec-H with Collagen IV in ATLO blood vessels (BV) and CD11c (third two panels; n = 3 mice). (B) pDCs are MHC-IIlo. Flow cytometry analyses show co-staining of PDCA1 and Siglec-H on ATLO CD45+ cells (left) and MHC-II expression on PDCA1loSiglec-H cells (P1) and PDCA1hiSiglec-H+ cells (P2)(right). (C) Gating strategy for APCs. Flow cytometry plots show the gating strategy for APC subtypes in pre-gated CD45+ cells from plaque-removed abdominal aorta. (D) OT-II T cells-ATLO cDC interactions. 3D image of ATLO OT-II T cell-DC interactions in situ (n = 8 mice). Grid Unit = 42.6 μm. Projection: Lumen toward adventitia. T cells are red, DCs are green (see also Movies S3 and S4). (E) Approach for Eα or PBS injection. (F) Y-Ae+ cells in ATLOs. Flow cytometry plots indicate Y-Ae+ cells among CD45+ cells from plaque-removed ATLO-bearing abdominal aorta segments as in C. (G) Y-Ae+ APC subtypes. Histograms show comparisons of Y-Ae expression in mDCs, B cells, cDCs, macrophages, lyDCs and pDCs from PBS- or Eα-GFP-injected mice. (H) Composition of ATLO APCs. Pie chart depicts the composition of Eα-presenting APCs in ATLOs (recipient mice 78- to 85 weeks old, donor OT-II mice 9- to 12 weeks old). Flow cytometry data are representative of four experiments with one mouse per genotype per experiment (B, C, and E–H).
Figure 6
Figure 6
The Immune System of VSMC-LTβR Deficient Mice (A) Ltbr deletion in VSMCs. Validation of genomic Ltbr deletion in freshly isolated aortic VSMCs by PCR (left) and of Ltbr mRNA (middle); qRT-PCR show reduction of floxed Ltbr sequences in cultured aortic VSMCs compared to aortic endothelial cells (ECs) (n = 3 experiments) of Ltbrfl/flTagln-cre mice (right); NTC, no template control. (B) SLO neogenesis. Inguinal LNs (ILNs) were visualized by India ink injection into footpads of 8- to 10-week-old mice (n = 8) (left panels, arrow); all other LNs (data not shown) show similar results. SLOs in WT, Ltbr−/−, and Ltbrfl/flTagln-cre mice (n = 8) (right); RLN, renal LN; PP, Peyer’s patches; Abs, absent. (C) GC and MZ B cells in spleen. PNA+ GC B cells and IgD+ follicular MZ B cells in spleen (upper panel) (n = 8–12 sections in 5–7 mice per genotype). Flow cytometry show GC (middle panel) and MZ B cells (lower panel) in B220+ B cells from 78- to 80-week-old mice. (D) FDCs in spleen. Representative lower magnification montages of CD35+ FDCs and quantification of FDCs in spleen (n = 8–12 sections in 5–7 mice per genotype). (E) FRCs in LNs. Flow cytometry of Gp38+CD31 FRCs of CD45Ter119 cells in LNs of 78- to 90-week-old mice (left panel). (F) T cell subsets in spleen. Flow cytometry of CD4+Foxp3 T cells, CD4+Foxp3+ Treg cells, and CD8+ T cells of TCRβ+ cells of 78- to 90-week-old Ltbrfl/flTagln-cre mice. (G) TEM and naive T cells in spleen. Flow cytometry of CD62L+CD44 naive, CD62LCD44+ TEM, and CD62L+CD44+ TCM cells of CD4+ T cells of 78- to 90-week-old mice; TEM per naive T cell ratios of CD4+ T cells (upper panel) or CD4+ Treg cells (lower panel). (H) CD103+ cells in spleen. Flow cytometry plots show CD103+ cells from CD4+ (upper panel) or Treg (lower panel) cell gate of 78- to 90-week-old mice; bar graphs show the percentage comparison of CD103+ cells among CD4+ T or Treg cells at right. (I) Perivascular infiltrates in peripheral tissues. Hematoxylin and eosin (H/E) staining show leukocyte infiltrates around blood vessels (BVs) in lungs and liver. n = 3 mice per genotype. Br, bronchiole. Scale bar represents 50 μm (C and I); 500 μm (D). Flow cytometry data are representative of three experiments with pooled one to two mice per genotype per experiment (C and E–H). Data represent means ± SEM; p values were determined by unpaired Student’s t test or by multiple testing (Bonferroni) using the GEE model as described in the Experimental Procedures. p < 0.05; ∗∗p < 0.01; ∗∗∗p < 0.001; ns, not significant (see also Figure S6).
Figure 7
Figure 7
VSMC-LTβRs Protect against Atherosclerosis (A and B) Atherosclerotic plaque and ATLO sizes. Sudan-IV-stained aortas of young (32–35 weeks; n = 3) and aged (78- to 85 weeks old; n = 4–6) mice (A, upper panel), and Oil red O/hematoxylin stained innominate arteries (n = 3–8) and abdominal aortas (n = 4–8) (B, upper panel). Atherosclerotic lesions in different parts of the aorta were quantified as percentage of plaque areas (n = 3–6 mice per genotype (A, lower panels); plaque (P) sizes and ATLO sizes in different aorta segments were quantified as percentage of plaque areas, intima/media, and ATLO/media ratios, respectively (n = 5–10 sections in 3–8 mice per genotype) (B, lower panels). (C and D) Effect of Ltbr deletion on the ATLO structure. Histological and immunofluorescence stainings show ATLO cellularity (C) and HEV abundance (D) in abdominal aorta segments (n = 5–8 sections in n = 3–4 mice per genotype). Scale bar represents 2.5 mm (A); 100 μm (B); and 50 μm (C and D). Data represent means ± SEM; p values were determined by two-tailed Student’s t test or by multiple testing (Bonferroni) using the GEE model as described in the Supplemental Experimental Procedures. p < 0.05; ∗∗p < 0.01; ∗∗∗p < 0.001; ns, not significant, p > 0.05; nd, not detectable.

Comment in

Similar articles

Cited by

References

    1. Ait-Oufella H., Salomon B.L., Potteaux S., Robertson A.K., Gourdy P., Zoll J., Merval R., Esposito B., Cohen J.L., Fisson S. Natural regulatory T cells control the development of atherosclerosis in mice. Nat. Med. 2006;12:178–180. - PubMed
    1. Aloisi F., Pujol-Borrell R. Lymphoid neogenesis in chronic inflammatory diseases. Nat. Rev. Immunol. 2006;6:205–217. - PubMed
    1. Bilate A.M., Lafaille J.J. Induced CD4+Foxp3+ regulatory T cells in immune tolerance. Annu. Rev. Immunol. 2012;30:733–758. - PubMed
    1. Boucher P., Gotthardt M., Li W.P., Anderson R.G., Herz J. LRP: role in vascular wall integrity and protection from atherosclerosis. Science. 2003;300:329–332. - PubMed
    1. Cao R.Y., St Amand T., Grabner R., Habenicht A.J., Funk C.D. Genetic and pharmacological inhibition of the 5-lipoxygenase/leukotriene pathway in atherosclerotic lesion development in ApoE deficient mice. Atherosclerosis. 2009;203:395–400. - PubMed

Publication types

MeSH terms

Associated data