

Host Transcriptional Response to Influenza and Other Acute Respiratory Viral Infections--A Prospective Cohort Study
- PMID: 26070066
- PMCID: PMC4466531
- DOI: 10.1371/journal.ppat.1004869
Host Transcriptional Response to Influenza and Other Acute Respiratory Viral Infections--A Prospective Cohort Study
Abstract
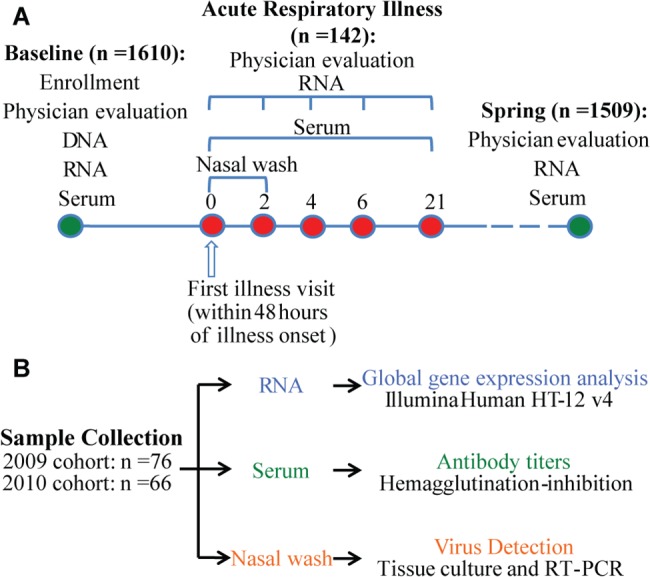
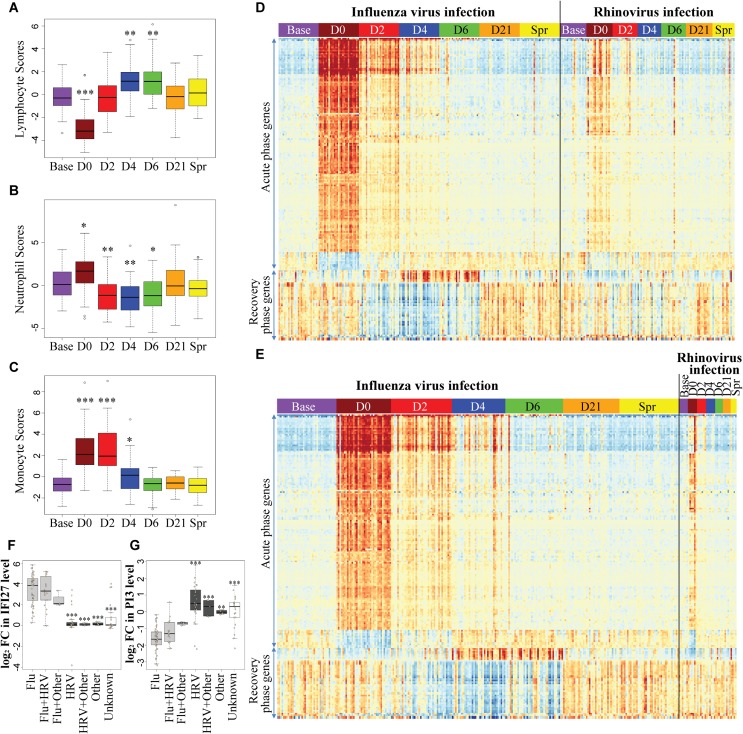
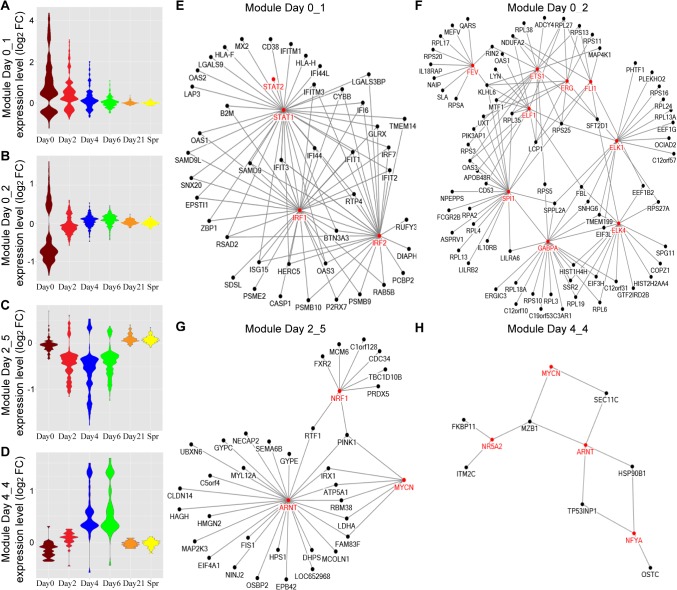
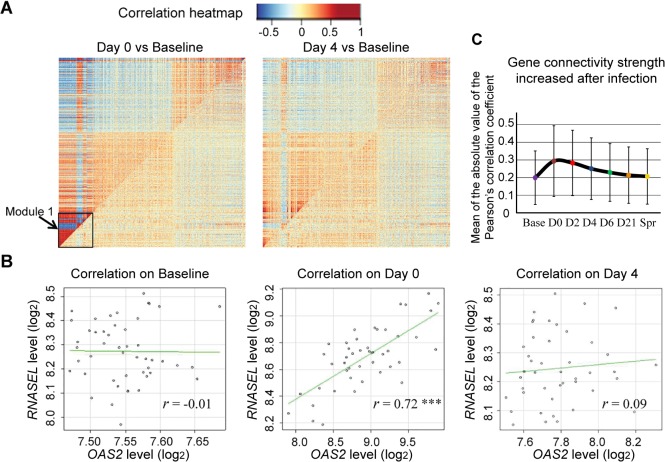
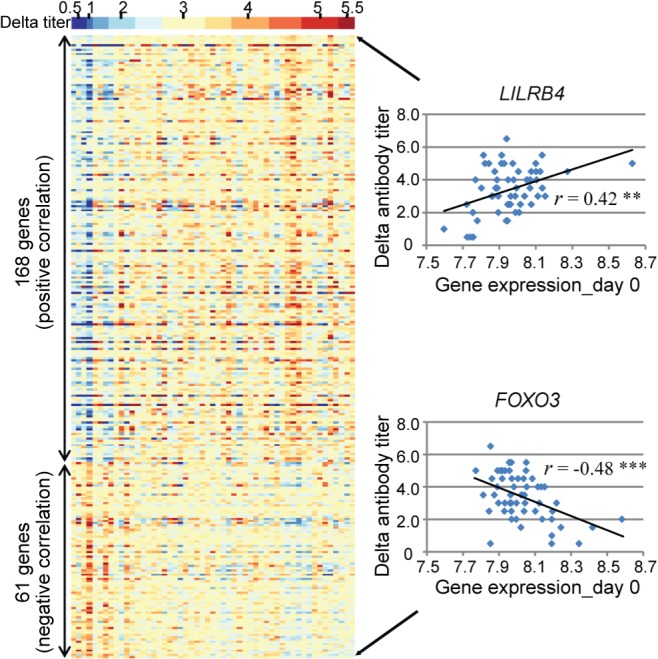
To better understand the systemic response to naturally acquired acute respiratory viral infections, we prospectively enrolled 1610 healthy adults in 2009 and 2010. Of these, 142 subjects were followed for detailed evaluation of acute viral respiratory illness. We examined peripheral blood gene expression at 7 timepoints: enrollment, 5 illness visits and the end of each year of the study. 133 completed all study visits and yielded technically adequate peripheral blood microarray gene expression data. Seventy-three (55%) had an influenza virus infection, 64 influenza A and 9 influenza B. The remaining subjects had a rhinovirus infection (N = 32), other viral infections (N = 4), or no viral agent identified (N = 24). The results, which were replicated between two seasons, showed a dramatic upregulation of interferon pathway and innate immunity genes. This persisted for 2-4 days. The data show a recovery phase at days 4 and 6 with differentially expressed transcripts implicated in cell proliferation and repair. By day 21 the gene expression pattern was indistinguishable from baseline (enrollment). Influenza virus infection induced a higher magnitude and longer duration of the shared expression signature of illness compared to the other viral infections. Using lineage and activation state-specific transcripts to produce cell composition scores, patterns of B and T lymphocyte depressions accompanied by a major activation of NK cells were detected in the acute phase of illness. The data also demonstrate multiple dynamic gene modules that are reorganized and strengthened following infection. Finally, we examined pre- and post-infection anti-influenza antibody titers defining novel gene expression correlates.
Conflict of interest statement
The authors have declared that no competing interests exist.
Figures


Similar articles
-
The Host Response to Viral Infections Reveals Common and Virus-Specific Signatures in the Peripheral Blood.Front Immunol. 2021 Oct 27;12:741837. doi: 10.3389/fimmu.2021.741837. eCollection 2021. Front Immunol. 2021. PMID: 34777354 Free PMC article.
-
Gene expression signatures diagnose influenza and other symptomatic respiratory viral infections in humans.Cell Host Microbe. 2009 Sep 17;6(3):207-17. doi: 10.1016/j.chom.2009.07.006. Epub 2009 Aug 6. Cell Host Microbe. 2009. PMID: 19664979 Free PMC article.
-
The Dynamic Relationship Between Clinical Symptomatology and Viral Shedding in Naturally Acquired Seasonal and Pandemic Influenza Virus Infections.Clin Infect Dis. 2016 Feb 15;62(4):431-437. doi: 10.1093/cid/civ909. Epub 2015 Oct 30. Clin Infect Dis. 2016. PMID: 26518469 Free PMC article.
-
Gene Expression Profiles Link Respiratory Viral Infection, Platelet Response to Aspirin, and Acute Myocardial Infarction.PLoS One. 2015 Jul 20;10(7):e0132259. doi: 10.1371/journal.pone.0132259. eCollection 2015. PLoS One. 2015. PMID: 26193668 Free PMC article.
-
Characterization of the Localized Immune Response in the Respiratory Tract of Ferrets following Infection with Influenza A and B Viruses.J Virol. 2015 Dec 30;90(6):2838-48. doi: 10.1128/JVI.02797-15. J Virol. 2015. PMID: 26719259 Free PMC article.
Cited by
-
A single transcript for the prognosis of disease severity in COVID-19 patients.Sci Rep. 2021 Jun 9;11(1):12174. doi: 10.1038/s41598-021-91754-7. Sci Rep. 2021. PMID: 34108608 Free PMC article.
-
Leishmania infection upregulates and engages host macrophage Argonaute 1, and system-wide proteomics reveals Argonaute 1-dependent host response.Front Immunol. 2023 Nov 30;14:1287539. doi: 10.3389/fimmu.2023.1287539. eCollection 2023. Front Immunol. 2023. PMID: 38098491 Free PMC article.
-
Microarray Gene Expression Dataset Re-analysis Reveals Variability in Influenza Infection and Vaccination.Front Immunol. 2019 Nov 7;10:2616. doi: 10.3389/fimmu.2019.02616. eCollection 2019. Front Immunol. 2019. PMID: 31787983 Free PMC article.
-
In situ Immune Signatures and Microbial Load at the Nasopharyngeal Interface in Children With Acute Respiratory Infection.Front Microbiol. 2018 Nov 9;9:2475. doi: 10.3389/fmicb.2018.02475. eCollection 2018. Front Microbiol. 2018. PMID: 30473680 Free PMC article.
-
Transcriptome-based analysis of human peripheral blood reveals regulators of immune response in different viral infections.Front Immunol. 2023 Sep 19;14:1199482. doi: 10.3389/fimmu.2023.1199482. eCollection 2023. Front Immunol. 2023. PMID: 37795081 Free PMC article.
References
-
- World Health Organization. (2009) Seasonal Influenza: World Health Organization.
-
- Centers for Disease Control and Prevention: Seasonal Influenza. (2013) http://www.cdc.gov/flu/about/qa/disease.htm
-
- Molinari NM, Ortega-Sanchez IR, Messonnier ML, Thompson WW, Wortley PM, et al. (2007) The annual impact of seasonal influenza in the US: measuring disease burden and costs. Vaccine 25(27): 5086–96. - PubMed
Publication types
MeSH terms
Grants and funding
LinkOut - more resources
Full Text Sources
Other Literature Sources
Medical
Molecular Biology Databases
