

Macrophage autophagy protects against liver fibrosis in mice
- PMID: 26061908
- PMCID: PMC4590651
- DOI: 10.1080/15548627.2015.1058473
Macrophage autophagy protects against liver fibrosis in mice
Abstract
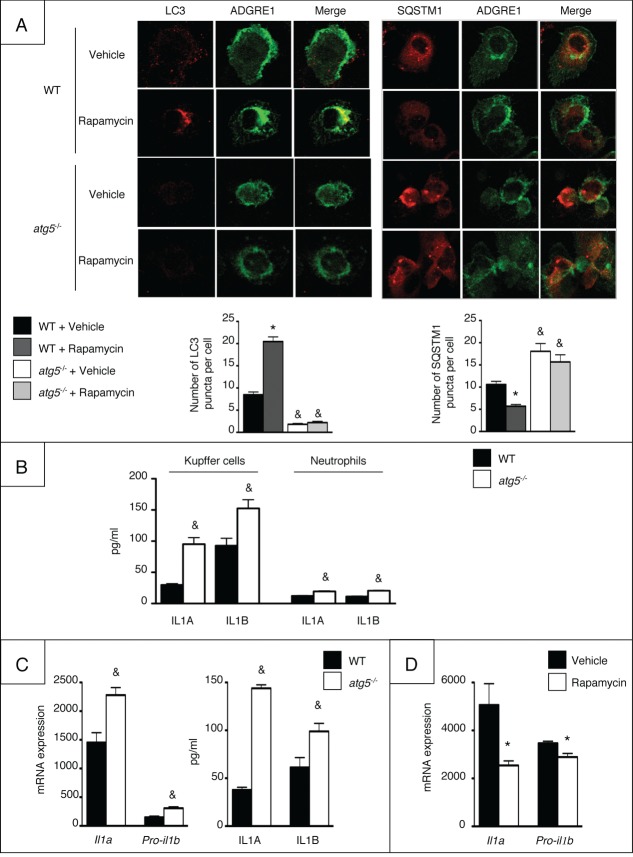
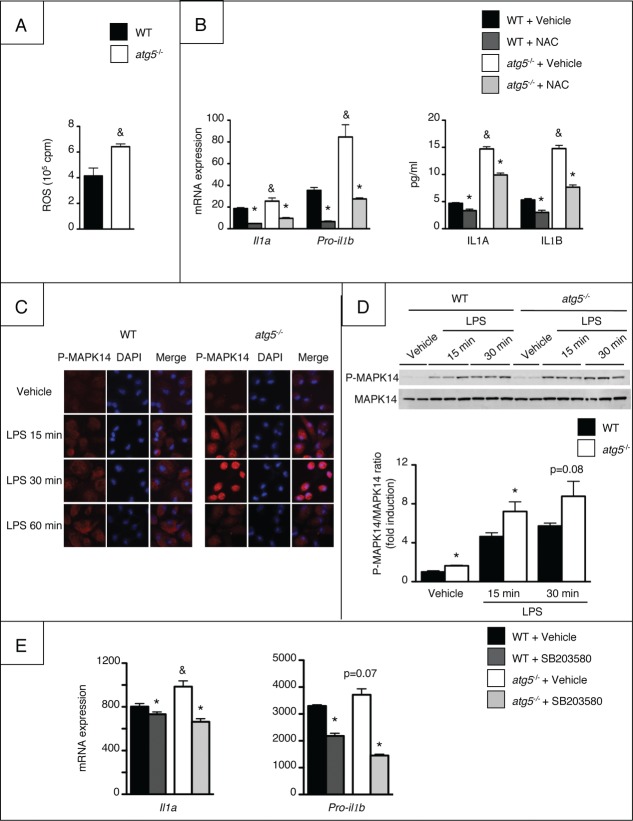
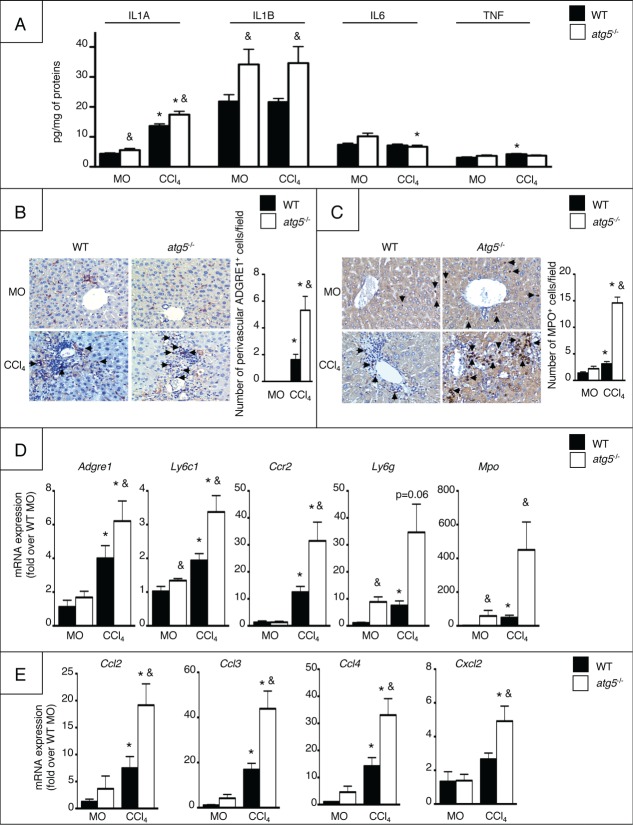
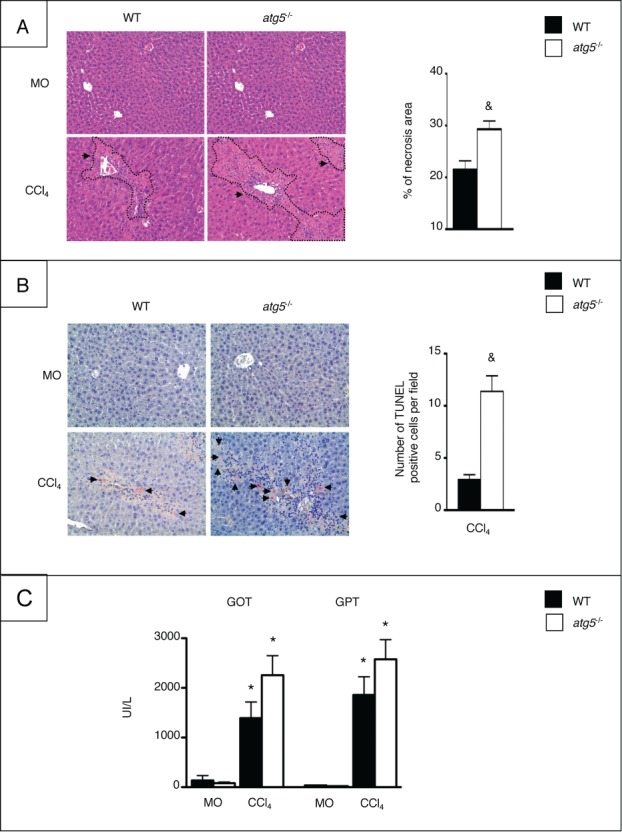
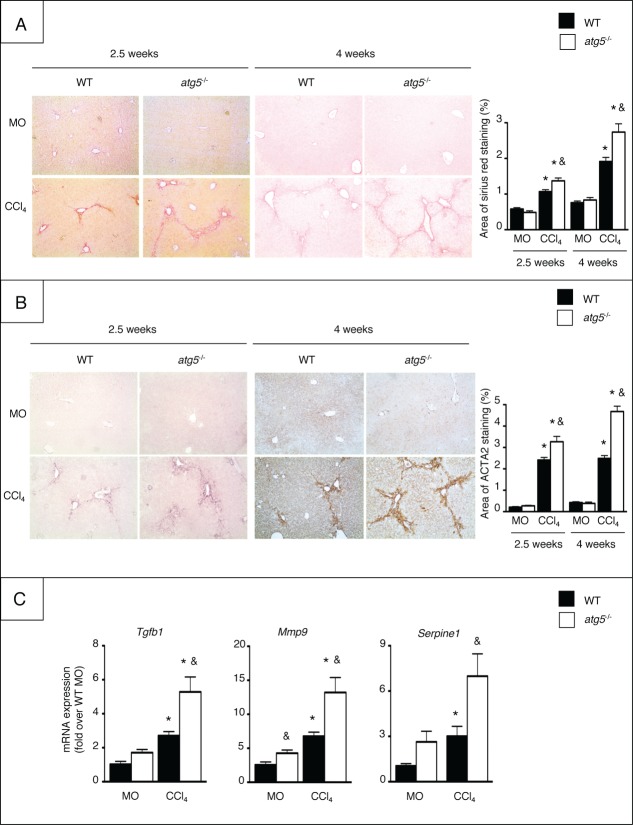
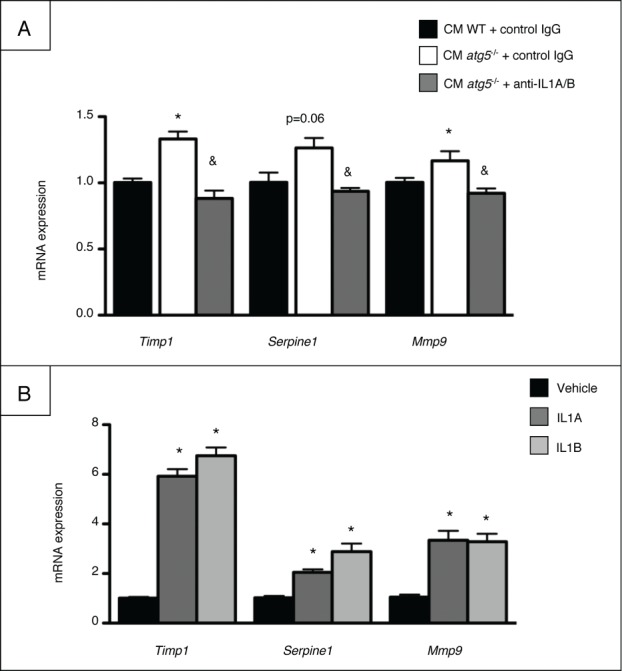
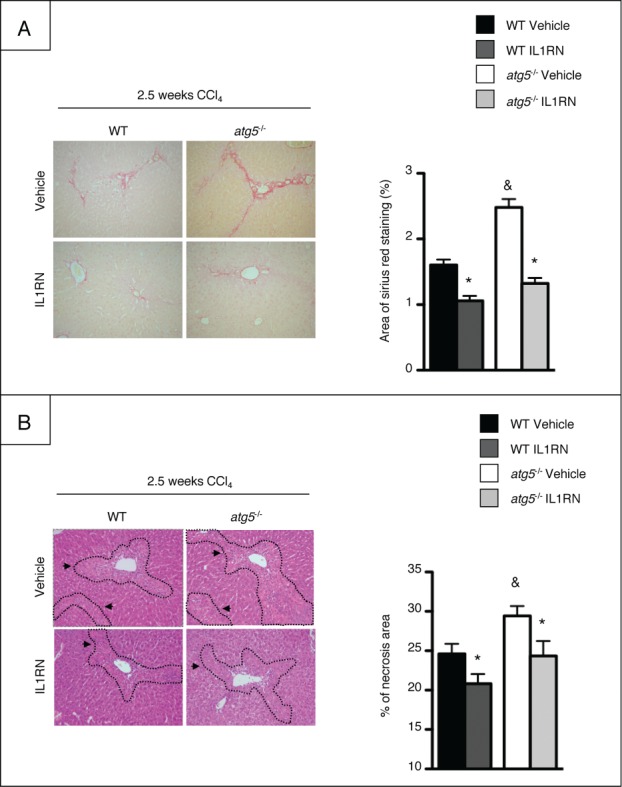
Autophagy is a lysosomal degradation pathway of cellular components that displays antiinflammatory properties in macrophages. Macrophages are critically involved in chronic liver injury by releasing mediators that promote hepatocyte apoptosis, contribute to inflammatory cell recruitment and activation of hepatic fibrogenic cells. Here, we investigated whether macrophage autophagy may protect against chronic liver injury. Experiments were performed in mice with mutations in the autophagy gene Atg5 in the myeloid lineage (Atg5(fl/fl) LysM-Cre mice, referred to as atg5(-/-)) and their wild-type (Atg5(fl/fl), referred to as WT) littermates. Liver fibrosis was induced by repeated intraperitoneal injection of carbon tetrachloride. In vitro studies were performed in cultures or co-cultures of peritoneal macrophages with hepatic myofibroblasts. As compared to WT littermates, atg5(-/-) mice exposed to chronic carbon tetrachloride administration displayed higher hepatic levels of IL1A and IL1B and enhanced inflammatory cell recruitment associated with exacerbated liver injury. In addition, atg5(-/-) mice were more susceptible to liver fibrosis, as shown by enhanced matrix and fibrogenic cell accumulation. Macrophages from atg5(-/-) mice secreted higher levels of reactive oxygen species (ROS)-induced IL1A and IL1B. Moreover, hepatic myofibroblasts exposed to the conditioned medium of macrophages from atg5(-/-) mice showed increased profibrogenic gene expression; this effect was blunted when neutralizing IL1A and IL1B in the conditioned medium of atg5(-/-) macrophages. Finally, administration of recombinant IL1RN (interleukin 1 receptor antagonist) to carbon tetrachloride-exposed atg5(-/-) mice blunted liver injury and fibrosis, identifying IL1A/B as central mediators in the deleterious effects of macrophage autophagy invalidation. These results uncover macrophage autophagy as a novel antiinflammatory pathway regulating liver fibrosis.
Keywords: Kupffer cell; inflammation; interleukin-1; liver injury; myofibroblast.
Figures
Similar articles
-
Cell-specific PPARγ deficiency establishes anti-inflammatory and anti-fibrogenic properties for this nuclear receptor in non-parenchymal liver cells.J Hepatol. 2013 Nov;59(5):1045-53. doi: 10.1016/j.jhep.2013.06.023. Epub 2013 Jul 2. J Hepatol. 2013. PMID: 23831119
-
Autophagy-based unconventional secretion of HMGB1 by keratinocytes plays a pivotal role in psoriatic skin inflammation.Autophagy. 2021 Feb;17(2):529-552. doi: 10.1080/15548627.2020.1725381. Epub 2020 Feb 16. Autophagy. 2021. PMID: 32019420 Free PMC article.
-
Macrophage autophagy limits acute toxic liver injury in mice through down regulation of interleukin-1β.J Hepatol. 2016 Jan;64(1):118-27. doi: 10.1016/j.jhep.2015.08.019. Epub 2015 Aug 29. J Hepatol. 2016. PMID: 26325539 Free PMC article.
-
Macrophage heterogeneity in liver injury and fibrosis.J Hepatol. 2014 May;60(5):1090-6. doi: 10.1016/j.jhep.2013.12.025. Epub 2014 Jan 8. J Hepatol. 2014. PMID: 24412603 Review.
-
Autophagy: a multifaceted partner in liver fibrosis.Biomed Res Int. 2014;2014:869390. doi: 10.1155/2014/869390. Epub 2014 Aug 31. Biomed Res Int. 2014. PMID: 25254217 Free PMC article. Review.
Cited by
-
[Mechanism of hepatocyte mitochondrial NDUFA13 deficiency-induced liver fibrogenesis: the role of abnormal hepatic stellate cell activation].Nan Fang Yi Ke Da Xue Xue Bao. 2021 Apr 20;41(4):529-535. doi: 10.12122/j.issn.1673-4254.2021.04.07. Nan Fang Yi Ke Da Xue Xue Bao. 2021. PMID: 33963711 Free PMC article. Chinese.
-
S100A4 Silencing Facilitates Corneal Wound Healing After Alkali Burns by Promoting Autophagy via Blocking the PI3K/Akt/mTOR Signaling Pathway.Invest Ophthalmol Vis Sci. 2020 Sep 1;61(11):19. doi: 10.1167/iovs.61.11.19. Invest Ophthalmol Vis Sci. 2020. PMID: 32926102 Free PMC article.
-
The Role of Autophagy and NLRP3 Inflammasome in Liver Fibrosis.Biomed Res Int. 2020 Jul 11;2020:7269150. doi: 10.1155/2020/7269150. eCollection 2020. Biomed Res Int. 2020. PMID: 32733951 Free PMC article. Review.
-
Is LysM-Cre a good candidate Cre for knocking out Atg5 gene in mice?Front Immunol. 2022 Aug 26;13:964496. doi: 10.3389/fimmu.2022.964496. eCollection 2022. Front Immunol. 2022. PMID: 36420266 Free PMC article. No abstract available.
-
Diverse Functions of Autophagy in Liver Physiology and Liver Diseases.Int J Mol Sci. 2019 Jan 13;20(2):300. doi: 10.3390/ijms20020300. Int J Mol Sci. 2019. PMID: 30642133 Free PMC article. Review.
References
-
- Mallat A, Lotersztajn S. Cellular mechanisms of tissue fibrosis. Five. novel insights into liver fibrosis. Am J Physiol Cell Physiol 2013; 305:C789-99; PMID:23903700; http://dx.doi.org/10.1152/ajpcell.00230.2013 - DOI - PubMed
-
- Ramachandran P, Iredale JP. Liver fibrosis: a bidirectional model of fibrogenesis and resolution. QJM 2012; 105:813-7; PMID:22647759; http://dx.doi.org/10.1093/qjmed/hcs069 - DOI - PMC - PubMed
-
- Heymann F, Trautwein C, Tacke F. Monocytes and macrophages as cellular targets in liver fibrosis. Inflamm Allergy Drug Targets 2009; 8:307-18; PMID:19534673; http://dx.doi.org/10.2174/187152809789352230 - DOI - PubMed
-
- Moran-Salvador E, Titos E, Rius B, Gonzalez-Periz A, Garcia-Alonso V, Lopez-Vicario C, Miquel R, Barak Y, Arroyo V, Clària J. Cell-specific PPARgamma deficiency establishes antiinflammatory and anti-fibrogenic properties for this nuclear receptor in nonparenchymal liver cells. J Hepatol 2013; 59:1045-53; PMID:23831119; http://dx.doi.org/10.1016/j.jhep.2013.06.023 - DOI - PubMed
-
- Fallowfield JA, Mizuno M, Kendall TJ, Constandinou CM, Benyon RC, Duffield JS, Iredale JP. Scar-associated macrophages are a major source of hepatic matrix metalloproteinase-13 and facilitate the resolution of murine hepatic fibrosis. J Immunol 2007; 178:5288-95; PMID:17404313; http://dx.doi.org/10.4049/jimmunol.178.8.5288 - DOI - PubMed
Publication types
MeSH terms
Substances
LinkOut - more resources
Full Text Sources
Other Literature Sources
Medical
Molecular Biology Databases
Research Materials