

Ribosome profiling reveals translation control as a key mechanism generating differential gene expression in Trypanosoma cruzi
- PMID: 26054634
- PMCID: PMC4460968
- DOI: 10.1186/s12864-015-1563-8
Ribosome profiling reveals translation control as a key mechanism generating differential gene expression in Trypanosoma cruzi
Abstract
Background: Due to the absence of transcription initiation regulation of protein coding genes transcribed by RNA polymerase II, posttranscriptional regulation is responsible for the majority of gene expression changes in trypanosomatids. Therefore, cataloging the abundance of mRNAs (transcriptome) and the level of their translation (translatome) is a key step to understand control of gene expression in these organisms.
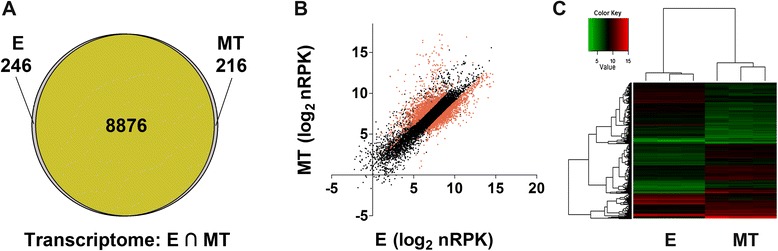
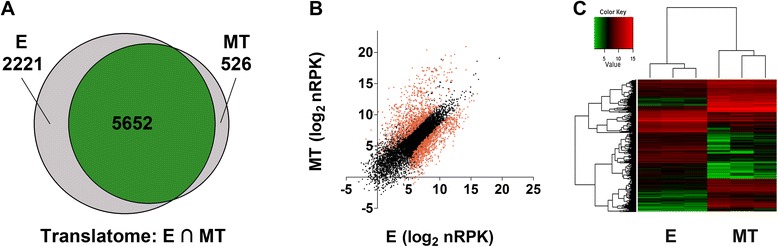
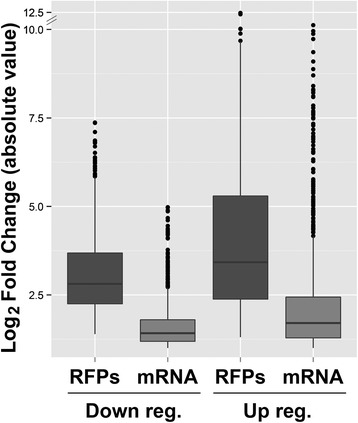
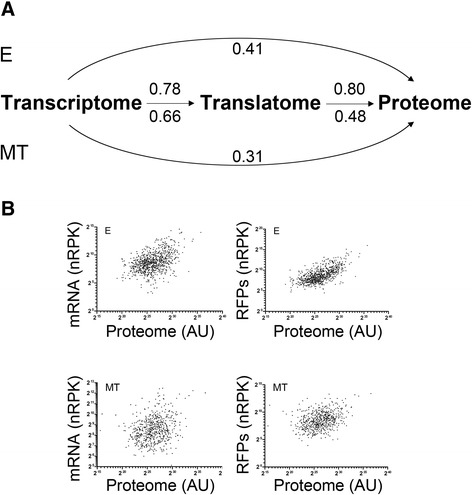
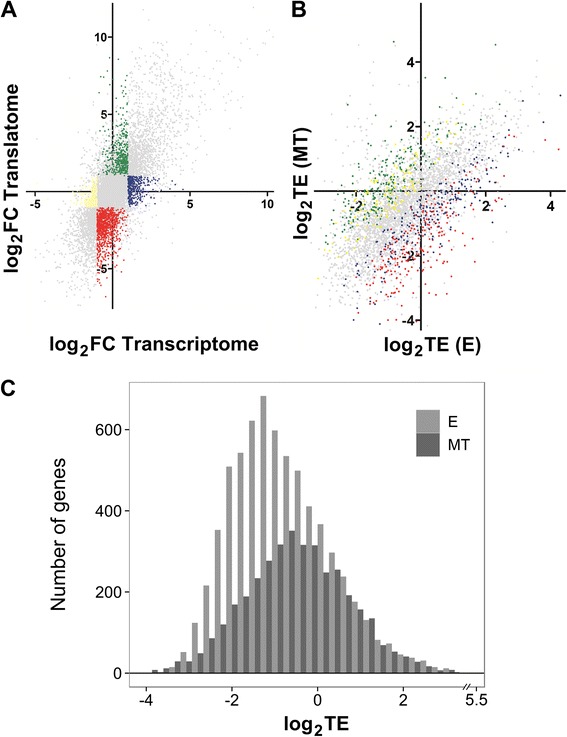
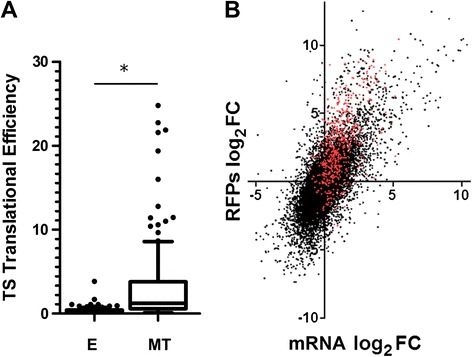
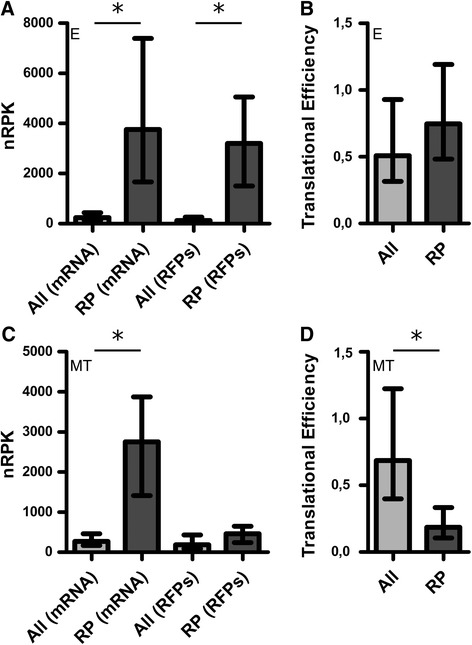
Results: Here we assess the extent of regulation of the transcriptome and the translatome in the Chagas disease causing agent, Trypanosoma cruzi, in both the non-infective (epimastigote) and infective (metacyclic trypomastigote) insect's life stages using RNA-seq and ribosome profiling. The observed steady state transcript levels support constitutive transcription and maturation implying the existence of distinctive posttranscriptional regulatory mechanisms controlling gene expression levels at those parasite stages. Meanwhile, the downregulation of a large proportion of the translatome indicates a key role of translation control in differentiation into the infective form. The previously described proteomic data correlate better with the translatomes than with the transcriptomes and translational efficiency analysis shows a wide dynamic range, reinforcing the importance of translatability as a regulatory step. Translation efficiencies for protein families like ribosomal components are diminished while translation of the transialidase virulence factors is upregulated in the quiescent infective metacyclic trypomastigote stage.
Conclusions: A large subset of genes is modulated at the translation level in two different stages of Trypanosoma cruzi life cycle. Translation upregulation of virulence factors and downregulation of ribosomal proteins indicates different degrees of control operating to prepare the parasite for an infective life form. Taking together our results show that translational regulation, in addition to regulation of steady state level of mRNA, is a major factor playing a role during the parasite differentiation.
Figures
Similar articles
-
Extensive Translational Regulation through the Proliferative Transition of Trypanosoma cruzi Revealed by Multi-Omics.mSphere. 2021 Oct 27;6(5):e0036621. doi: 10.1128/mSphere.00366-21. Epub 2021 Sep 1. mSphere. 2021. PMID: 34468164 Free PMC article.
-
In vitro metacyclogenesis of Trypanosoma cruzi induced by starvation correlates with a transient adenylyl cyclase stimulation as well as with a constitutive upregulation of adenylyl cyclase expression.Mol Biochem Parasitol. 2015 Mar-Apr;200(1-2):9-18. doi: 10.1016/j.molbiopara.2015.04.002. Epub 2015 Apr 23. Mol Biochem Parasitol. 2015. PMID: 25912925
-
Functional genomic characterization of mRNAs associated with TcPUF6, a pumilio-like protein from Trypanosoma cruzi.J Biol Chem. 2008 Mar 28;283(13):8266-73. doi: 10.1074/jbc.M703097200. Epub 2007 Dec 4. J Biol Chem. 2008. PMID: 18056709 Free PMC article.
-
Stage-specific gene expression during Trypanosoma cruzi metacyclogenesis.Genet Mol Res. 2003 Mar 31;2(1):159-68. Genet Mol Res. 2003. PMID: 12917812 Review.
-
Illuminating Parasite Protein Production by Ribosome Profiling.Trends Parasitol. 2016 Jun;32(6):446-457. doi: 10.1016/j.pt.2016.03.005. Epub 2016 Apr 6. Trends Parasitol. 2016. PMID: 27061497 Free PMC article. Review.
Cited by
-
Proteomic data of the Trypanosoma cruzi insect-dwelling epimastigotes overexpressing the RNA-binding protein UBP1.Data Brief. 2024 Jan 24;53:110085. doi: 10.1016/j.dib.2024.110085. eCollection 2024 Apr. Data Brief. 2024. PMID: 38348324 Free PMC article.
-
Mitochondrial Gene Expression Is Responsive to Starvation Stress and Developmental Transition in Trypanosoma cruzi.mSphere. 2016 Apr 13;1(2):e00051-16. doi: 10.1128/mSphere.00051-16. eCollection 2016 Mar-Apr. mSphere. 2016. PMID: 27303725 Free PMC article.
-
Quantitative phosphoproteome and proteome analyses emphasize the influence of phosphorylation events during the nutritional stress of Trypanosoma cruzi: the initial moments of in vitro metacyclogenesis.Cell Stress Chaperones. 2019 Sep;24(5):927-936. doi: 10.1007/s12192-019-01018-7. Epub 2019 Jul 31. Cell Stress Chaperones. 2019. PMID: 31368045 Free PMC article.
-
High-throughput Methods for Dissection of Trypanosome Gene Regulatory Networks.Curr Genomics. 2018 Feb;19(2):78-86. doi: 10.2174/1389202918666170815125336. Curr Genomics. 2018. PMID: 29491736 Free PMC article. Review.
-
Delayed Protein Changes During Seed Germination.Front Plant Sci. 2021 Sep 15;12:735719. doi: 10.3389/fpls.2021.735719. eCollection 2021. Front Plant Sci. 2021. PMID: 34603360 Free PMC article.
References
Publication types
MeSH terms
Substances
LinkOut - more resources
Full Text Sources
Other Literature Sources
Molecular Biology Databases
