Selenoprotein P influences colitis-induced tumorigenesis by mediating stemness and oxidative damage
- PMID: 26053663
- PMCID: PMC4563672
- DOI: 10.1172/JCI76099
Selenoprotein P influences colitis-induced tumorigenesis by mediating stemness and oxidative damage
Abstract
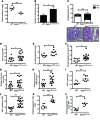
Patients with inflammatory bowel disease are at increased risk for colon cancer due to augmented oxidative stress. These patients also have compromised antioxidant defenses as the result of nutritional deficiencies. The micronutrient selenium is essential for selenoprotein production and is transported from the liver to target tissues via selenoprotein P (SEPP1). Target tissues also produce SEPP1, which is thought to possess an endogenous antioxidant function. Here, we have shown that mice with Sepp1 haploinsufficiency or mutations that disrupt either the selenium transport or the enzymatic domain of SEPP1 exhibit increased colitis-associated carcinogenesis as the result of increased genomic instability and promotion of a protumorigenic microenvironment. Reduced SEPP1 function markedly increased M2-polarized macrophages, indicating a role for SEPP1 in macrophage polarization and immune function. Furthermore, compared with partial loss, complete loss of SEPP1 substantially reduced tumor burden, in part due to increased apoptosis. Using intestinal organoid cultures, we found that, compared with those from WT animals, Sepp1-null cultures display increased stem cell characteristics that are coupled with increased ROS production, DNA damage, proliferation, decreased cell survival, and modulation of WNT signaling in response to H2O2-mediated oxidative stress. Together, these data demonstrate that SEPP1 influences inflammatory tumorigenesis by affecting genomic stability, the inflammatory microenvironment, and epithelial stem cell functions.
Figures


Similar articles
-
Selenoproteins and oxidative stress-induced inflammatory tumorigenesis in the gut.Cell Mol Life Sci. 2017 Feb;74(4):607-616. doi: 10.1007/s00018-016-2339-2. Epub 2016 Aug 25. Cell Mol Life Sci. 2017. PMID: 27563706 Free PMC article. Review.
-
Colonic Epithelial-Derived Selenoprotein P Is the Source for Antioxidant-Mediated Protection in Colitis-Associated Cancer.Gastroenterology. 2021 Apr;160(5):1694-1708.e3. doi: 10.1053/j.gastro.2020.12.059. Epub 2021 Jan 1. Gastroenterology. 2021. PMID: 33388316 Free PMC article.
-
Deletion of selenoprotein P upregulates urinary selenium excretion and depresses whole-body selenium content.Biochim Biophys Acta. 2006 Dec;1760(12):1789-93. doi: 10.1016/j.bbagen.2006.08.010. Epub 2006 Aug 18. Biochim Biophys Acta. 2006. PMID: 17014962 Free PMC article.
-
Selenoprotein P and apolipoprotein E receptor-2 interact at the blood-brain barrier and also within the brain to maintain an essential selenium pool that protects against neurodegeneration.FASEB J. 2014 Aug;28(8):3579-88. doi: 10.1096/fj.14-252874. Epub 2014 Apr 23. FASEB J. 2014. PMID: 24760755 Free PMC article.
-
Selenoprotein P-expression, functions, and roles in mammals.Biochim Biophys Acta. 2009 Nov;1790(11):1441-7. doi: 10.1016/j.bbagen.2009.03.026. Epub 2009 Apr 1. Biochim Biophys Acta. 2009. PMID: 19345254 Free PMC article. Review.
Cited by
-
Innate-like functions of natural killer T cell subsets result from highly divergent gene programs.Nat Immunol. 2016 Jun;17(6):728-39. doi: 10.1038/ni.3437. Epub 2016 Apr 18. Nat Immunol. 2016. PMID: 27089380 Free PMC article.
-
Fish Oil and Selenium with Doxorubicin Modulates Expression of Fatty Acid Receptors and Selenoproteins, and Targets Multiple Anti-Cancer Signaling in Triple-negative Breast Cancer Tumors.Int J Med Sci. 2022 Nov 14;19(14):2044-2057. doi: 10.7150/ijms.75848. eCollection 2022. Int J Med Sci. 2022. PMID: 36483592 Free PMC article.
-
Cancer-Associated Stromal Fibroblast-Derived Transcriptomes Predict Poor Clinical Outcomes and Immunosuppression in Colon Cancer.Pathol Oncol Res. 2022 Aug 4;28:1610350. doi: 10.3389/pore.2022.1610350. eCollection 2022. Pathol Oncol Res. 2022. PMID: 35991839 Free PMC article.
-
Exercise-induced changes to the human gut microbiota and implications for colorectal cancer: a narrative review.J Physiol. 2022 Dec;600(24):5189-5201. doi: 10.1113/JP283702. Epub 2022 Nov 28. J Physiol. 2022. PMID: 36369926 Free PMC article. Review.
-
Detection of neoplastic-immune hybrid cells with metastatic properties in uveal melanoma.Biomark Res. 2024 Jul 20;12(1):67. doi: 10.1186/s40364-024-00609-6. Biomark Res. 2024. PMID: 39030653 Free PMC article.
References
Publication types
MeSH terms
Substances
Grants and funding
- P50CA095103/CA/NCI NIH HHS/United States
- 1F30DK096718/DK/NIDDK NIH HHS/United States
- P30DK058404/DK/NIDDK NIH HHS/United States
- UL1 RR024975/RR/NCRR NIH HHS/United States
- P30CA068485/CA/NCI NIH HHS/United States
- P01CA028842/CA/NCI NIH HHS/United States
- P01CA116087/CA/NCI NIH HHS/United States
- UL1 TR000445/TR/NCATS NIH HHS/United States
- T32CA009592-26/CA/NCI NIH HHS/United States
- P01 CA028842/CA/NCI NIH HHS/United States
- R01 DK053620/DK/NIDDK NIH HHS/United States
- 1F31CA167920/CA/NCI NIH HHS/United States
- F30 CA165726/CA/NCI NIH HHS/United States
- P50 CA095103/CA/NCI NIH HHS/United States
- R01 CA190612/CA/NCI NIH HHS/United States
- R01AT004821/AT/NCCIH NIH HHS/United States
- T32 GM07347/GM/NIGMS NIH HHS/United States
- R01 DK099204/DK/NIDDK NIH HHS/United States
- R01 CA142826/CA/NCI NIH HHS/United States
- P30 DK058404/DK/NIDDK NIH HHS/United States
- DK080221/DK/NIDDK NIH HHS/United States
- R01 AT004821/AT/NCCIH NIH HHS/United States
- R01AT004821-S1/AT/NCCIH NIH HHS/United States
- F30 DK103498/DK/NIDDK NIH HHS/United States
- S10 OD021630/OD/NIH HHS/United States
- 1F30DK103498/DK/NIDDK NIH HHS/United States
- T32GM07347/GM/NIGMS NIH HHS/United States
- K08 DK080221/DK/NIDDK NIH HHS/United States
- U19 AI116497/AI/NIAID NIH HHS/United States
- R37 ES002497/ES/NIEHS NIH HHS/United States
- R25 GM062459/GM/NIGMS NIH HHS/United States
- 1F30CA165726/CA/NCI NIH HHS/United States
- P01 CA116087/CA/NCI NIH HHS/United States
- 2 UL1 TR000445-06/TR/NCATS NIH HHS/United States
- T32 GM007347/GM/NIGMS NIH HHS/United States
- I01 BX001453/BX/BLRD VA/United States
- P30 CA068485/CA/NCI NIH HHS/United States
- I01 BX001426/BX/BLRD VA/United States
- T32 CA009592/CA/NCI NIH HHS/United States
- F31 CA167920/CA/NCI NIH HHS/United States
- F30 DK096718/DK/NIDDK NIH HHS/United States
- R01DK053620/DK/NIDDK NIH HHS/United States
- UL1 RR024975-01/RR/NCRR NIH HHS/United States
LinkOut - more resources
Full Text Sources
Other Literature Sources
Molecular Biology Databases
Miscellaneous

