Regulation of the ESC transcriptome by nuclear long noncoding RNAs
- PMID: 26048247
- PMCID: PMC4561492
- DOI: 10.1101/gr.189027.114
Regulation of the ESC transcriptome by nuclear long noncoding RNAs
Abstract
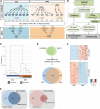
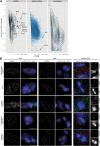
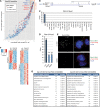
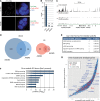
Long noncoding (lnc)RNAs have recently emerged as key regulators of gene expression. Here, we performed high-depth poly(A)(+) RNA sequencing across multiple clonal populations of mouse embryonic stem cells (ESCs) and neural progenitor cells (NPCs) to comprehensively identify differentially regulated lncRNAs. We establish a biologically robust profile of lncRNA expression in these two cell types and further confirm that the majority of these lncRNAs are enriched in the nucleus. Applying weighted gene coexpression network analysis, we define a group of lncRNAs that are tightly associated with the pluripotent state of ESCs. Among these, we show that acute depletion of Platr14 using antisense oligonucleotides impacts the differentiation- and development-associated gene expression program of ESCs. Furthermore, we demonstrate that Firre, a lncRNA highly enriched in the nucleoplasm and previously reported to mediate chromosomal contacts in ESCs, controls a network of genes related to RNA processing. Together, we provide a comprehensive, up-to-date, and high resolution compilation of lncRNA expression in ESCs and NPCs and show that nuclear lncRNAs are tightly integrated into the regulation of ESC gene expression.
© 2015 Bergmann et al.; Published by Cold Spring Harbor Laboratory Press.
Figures


Similar articles
-
Identification of novel long noncoding RNAs underlying vertebrate cardiovascular development.Circulation. 2015 Apr 7;131(14):1278-1290. doi: 10.1161/CIRCULATIONAHA.114.013303. Epub 2015 Mar 4. Circulation. 2015. PMID: 25739401 Free PMC article.
-
Large noncoding RNAs are promising regulators in embryonic stem cells.J Genet Genomics. 2015 Mar 20;42(3):99-105. doi: 10.1016/j.jgg.2015.02.002. Epub 2015 Feb 12. J Genet Genomics. 2015. PMID: 25819086 Review.
-
Microarray expression profiling in the denervated hippocampus identifies long noncoding RNAs functionally involved in neurogenesis.BMC Mol Biol. 2017 Jun 6;18(1):15. doi: 10.1186/s12867-017-0091-2. BMC Mol Biol. 2017. PMID: 28587591 Free PMC article.
-
Regulation of crucial lncRNAs in differentiation of chicken embryonic stem cells to spermatogonia stem cells.Anim Genet. 2017 Apr;48(2):191-204. doi: 10.1111/age.12510. Epub 2016 Nov 14. Anim Genet. 2017. PMID: 27862128
-
Long noncoding RNAs: an emerging link between gene regulation and nuclear organization.Trends Cell Biol. 2014 Nov;24(11):651-63. doi: 10.1016/j.tcb.2014.08.009. Epub 2014 Oct 23. Trends Cell Biol. 2014. PMID: 25441720 Free PMC article. Review.
Cited by
-
Regulation of gene expression by cis-acting long non-coding RNAs.Nat Rev Genet. 2020 Feb;21(2):102-117. doi: 10.1038/s41576-019-0184-5. Epub 2019 Nov 15. Nat Rev Genet. 2020. PMID: 31729473 Review.
-
A novel testis-specific long noncoding RNA, Tesra, activates the Prss42/Tessp-2 gene during mouse spermatogenesis†.Biol Reprod. 2019 Mar 1;100(3):833-848. doi: 10.1093/biolre/ioy230. Biol Reprod. 2019. PMID: 30379984 Free PMC article.
-
Insight into novel RNA-binding activities via large-scale analysis of lncRNA-bound proteome and IDH1-bound transcriptome.Nucleic Acids Res. 2019 Mar 18;47(5):2244-2262. doi: 10.1093/nar/gkz032. Nucleic Acids Res. 2019. PMID: 30698743 Free PMC article.
-
The long non-coding RNA Cerox1 is a post transcriptional regulator of mitochondrial complex I catalytic activity.Elife. 2019 May 2;8:e45051. doi: 10.7554/eLife.45051. Elife. 2019. PMID: 31045494 Free PMC article.
-
The Long Noncoding RNA Lncenc1 Maintains Naive States of Mouse ESCs by Promoting the Glycolysis Pathway.Stem Cell Reports. 2018 Sep 11;11(3):741-755. doi: 10.1016/j.stemcr.2018.08.001. Epub 2018 Aug 30. Stem Cell Reports. 2018. PMID: 30174313 Free PMC article.
References
-
- Armstrong L, Lako M, Lincoln J, Cairns PM, Hole N. 2000. mTert expression correlates with telomerase activity during the differentiation of murine embryonic stem cells. Mech Dev 97: 109–116. - PubMed
-
- Basso K, Margolin AA, Stolovitzky G, Klein U, Dalla-Favera R, Califano A. 2005. Reverse engineering of regulatory networks in human B cells. Nat Genet 37: 382–390. - PubMed
Publication types
MeSH terms
Substances
Grants and funding
LinkOut - more resources
Full Text Sources
Other Literature Sources
Molecular Biology Databases
