. 2015 Aug;89(16):8392-405.
doi: 10.1128/JVI.00572-15. Epub 2015 Jun 3.

H3K27 Demethylation at the Proviral Promoter Sensitizes Latent HIV to the Effects of Vorinostat in Ex Vivo Cultures of Resting CD4+ T Cells

Affiliations

H3K27 Demethylation at the Proviral Promoter Sensitizes Latent HIV to the Effects of Vorinostat in Ex Vivo Cultures of Resting CD4+ T Cells

Manoj K Tripathy et al. J Virol. 2015 Aug.

Abstract

Histone methyltransferase inhibitors (HMTis) and histone deacetylase inhibitors (HDACis) are reported to synergistically induce the expression of latent human immunodeficiency virus type 1 (HIV-1), but studies have largely been performed with cell lines. As specific and potent HMTis directed at EZH1 (enhancer of zeste 2 Polycomb repressive complex 2 subunit 1)/EZH2 are now in human testing, we wished to rigorously test such an inhibitor in a primary resting T-cell model of HIV latency. We found that GSK343, a potent and selective EZH2/EZH1 inhibitor, reduced trimethylation of histone 3 at lysine 27 (H3K27) of the HIV provirus in resting cells. Remarkably, this epigenetic change was not associated with increased proviral expression in latently infected resting cells. However, following the reduction in H3K27 at the HIV long terminal repeat (LTR), subsequent exposure to the HDACi suberoylanilide hydroxamic acid or vorinostat (VOR) resulted in increases in HIV gag RNA and HIV p24 antigen production that were up to 2.5-fold greater than those induced by VOR alone. Therefore, in primary resting CD4(+) T cells, true mechanistic synergy in the reversal of HIV latency may be achieved by the combination of HMTis and HDACis. Although other cellular effects of EZH2 inhibition may contribute to the sensitization of the HIV LTR to subsequent exposure to VOR, and to increase viral antigen production, this synergistic effect is directly associated with H3K27 demethylation at nucleosome 1 (Nuc-1). Based upon our findings, the combination of HMTis and HDACis should be considered for testing in animal models or clinical trials.

Importance: Demethylation of H3K27 mediated by the histone methyltransferase inhibitor GSK343 in primary resting T cells is slow, occurring over 96 h, but by itself does not result in a significant upregulation of cell-associated HIV RNA expression or viral antigen production. However, following H3K27 demethylation, latent viral expression within infected primary resting CD4(+) T cells is synergistically increased upon exposure to the histone deacetylase inhibitor vorinostat. Demethylation at H3K27 sensitizes the HIV promoter to the effects of an HDACi and provides a proof-of-concept for the testing of combination epigenetic approaches to disrupt latent HIV infection, a necessary step toward the eradication of HIV infection.


Figures

FIG 1
FIG 1
Components of Polycomb repressive complexes 1 and 2 occupy the HIV promoter in 2D10 cells. As expected, histone H3 occupancy was detected at the HIV LTR Nuc-1 region, but occupancy of the p50 homodimer of NF-κB was low or absent. Occupancy of the PRC2 components EZH2 and EED, occupancy of the PRC1 components RING1 and BMI1, H3K27me2, and H3K27me3 were detected; Results were compared with results for control IgG by using Student paired t tests. Error bars represent standard errors of the means (n = 3). *, P < 0.05; NS, not significant (P > 0.05).
FIG 2
FIG 2
The EZH2 inhibitor GSK343 reduces trimethylated H3K27 in 2D10 cells but has a negligible effect on proviral expression. (A) Western blot showing global reduction in H3K27me3 protein levels in whole-cell lysate after cells were treated with different concentrations of GSK343 for 96 h. The reported 50% inhibitory concentration of GSK343 in the cancer cell lines tested was <0.2 μM (38), so a range of concentrations of GSK343 of 0.25 to 2.0 μM, starting close to its 50% inhibitory concentration, was used to determine the drug effect. Histone H3 and α-tubulin are shown as loading controls. (V, vehicle control [0.02% DMSO]). (B) ChIP at the HIV LTR Nuc-1 promoter for H3K27me3 and H3K9me3. Hemagglutinin antibody (HA) is an unrelated isotype control. (C) Corresponding changes in total H3 acetylation and in acetyl H3K27. ChIP panels were normalized to H3 levels. The H3 level did not significantly change between the control and treated conditions. Results were compared with those for cells treated with the vehicle control DMSO by using Student paired t tests. Error bars represent standard errors of the means (n = 3). or *, P < 0.05. (D) ChIP changes in H3K27me3 at the cellular promoters SAT2 (heterochromatic gene) and MyoD (euchromatic gene) in cells treated with 0.5 μM GSK343 for 96 h. *, P < 0.05, from 3 pairs of assays (determined by a Student paired t test). Results were compared to those of the respective DMSO controls (V, vehicle control). (E) Relative fold changes of cell-associated GFP RNA expression upon GSK343 exposure, normalized to GAPDH, as measured by quantitative RT-PCR. (E) HIV LTR-driven GFP expression in 2D10 cells, as measured by flow cytometry over 96 h. Treatment with VOR (500 nM) for 24 h served as the positive control. All the data shown represent means, and error bars represent standard deviations of the means, from three independent experiments.
FIG 3
FIG 3
EZH2 knockdown decreases H3K27me3 and PRC1 and PRC2 component occupancy in 2D10 cells without an increase in proviral expression. 2D10 cells were treated with either scrambled or EZH2 shRNAs for 48 h according to the Mirus Jurkat Trans-IT transfection reagent protocol. (A) Representative Western blot showing the effect of silencing of EZH2 on both EZH2 and H3K27me3. The relative quantification of each of the bands is indicated at the top of each blot. Histone H3 and α-tubulin are shown as loading controls. (B) Silencing of EZH2 does not lead to an increase in proviral gene expression, as measured by flow cytometry. (C) ChIP showing that the occupancy of the PRC2 components EZH2 and EED and H3K27 di- and trimethylation are reduced selectively at HIV LTR Nuc-1 by shRNA inhibition of EZH2. (D) ChIP showing that the RING1B and BMI1 components of PRC1 are also reduced at HIV LTR Nuc-1. H3 and H3K9me3 were used, as a control ChIP showed that silencing of EZH2 has no effect on the occupancies of total histone H3 or on the nonselective H3K9me3 mark. Sc, scrambled shRNA; Sh, EZH2 shRNA. ChIP was performed with the antibodies indicated at the top of each graph. Error bars represent standard errors of the means from three independent experiments. *, P < 0.05; NS, not significant (P > 0.05) (determined by the Student paired t test).
FIG 4
FIG 4
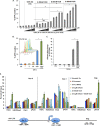
H3K27 demethylation of the HIV LTR induced by GSK343 increases the response of the proviral promoter to the HDAC inhibitor VOR. (A) In 2D10 cells, following 96 h of preexposure to 0 to 2.0 μM GSK343, a dose-dependent increase in proviral activation following treatment with >350 nM VOR for 24 h is seen if cells are pretreated with >0.25 μM GSK343 (V, equivalent volume of vehicle [0.02% DMSO]; UT, untreated). Means and standard errors of the means were obtained from three independent experiments. *, P < 0.05 for samples treated with VOR and with VOR plus GSK343 (cells treated with 2.0 μM); •, P < 0.05 for samples treated with 2.0 μM GSK343 and combined drug treatment; NS, not significant (P > 0.05) (determined by a Student paired t test). (B) Enhanced proviral expression in cells treated with 2 μM GSK343 for 96 h (day 4), followed by 24 h of exposure to 500 nM VOR. The samples were assayed by flow cytometry on day 5. The inset shows a FACS overlay, using Flowjo X software, at day 5. Results were compared to those of samples treated with VOR only, and a Student paired t test was done for three pairs of assays. *, P < 0.05. (C) Similar effects were observed when GFP RNA was measured by real-time PCR. Significant increases following treatment with GSK343 and VOR compared to treatment with VOR alone were determined by using Student paired t tests. Error bars represent standard errors of the means (n = 3). *, P < 0.05. (D) Effects of inhibitor exposure, as described above for panel B, were determined by ChIP at the HIV LTR for H3Ac, H3K27me3, and Pol II and phospho-Pol II occupancy, using the respective antibodies at the positions and with the primers indicated. The line diagram at the bottom represents the 5′ HIV LTR and the relative nucleosome positions and primer positions. At Nuc-0, Nuc-1, and the downstream region, the chromatin marks H3K27me3 and H3Ac and the occupancy of the RNA Pol II and phosphorylated RNA Pol II (marker of processive Pol II) were measured. At Nuc-0, GSK343 treatment reduced H3K27me3 and VOR increased H3Ac levels, while the occupancy of Pol II and pPol II remained unchanged. At Nuc-1, which is close to the transcription start site, similar observations were made, but the Pol II occupancy was increased, while the pPol II occupancy was reduced by combined treatment with GSK343 and VOR. At the Gag gene site, in the absence of nearby nucleosomal histones, no effect on acetyl and methyl marks was observed, but pPol II occupancy increased more by treatment with the combination of GSK343 and VOR than by treatment with VOR alone, indicative of an augmentation of processive transcription. In panels B to D, error bars represent standard errors of the means from three independent experiments; for each chromatin mark/occupancy described and to compare the ChIP data obtained with the combined and individual drug treatments, we performed ANOVA of the 4 different treatments (DMSO, GSK343, VOR, and GSK343 plus VOR). All differences noted were significant; , P < 0.001. ChIP panels were normalized to H3 levels. The H3 level did not significantly change between the control and treated conditions.
FIG 5
FIG 5
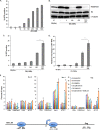
H3K27 demethylation of the HIV LTR induced by GSK343 also increases the response of the proviral promoter to the BETi JQ1 in 2D10 cells. (A) Dose response of 2D10 cells to JQ1 at 10 to 1,000 nM, as measured by GFP production. (B) Representative Western blot showing global reduction in H3K27me3 in whole-cell lysates. Cells were assayed at day 0 (0 h) or were incubated for 5 days (120 h) with either the vehicle control DMSO or 2 μM GSK343 for 96 h. In selected cultures, 50 nM JQ1 was added for the final 24 h of culture. Histone H3 and α-tubulin were used as loading controls. (C) Enhanced proviral expression in cells treated with 2 μM GSK343 for 96 h (day 4), followed by 24 h of exposure to 50 nM JQ1. The Student paired t test was done for three pairs of assays. *, P < 0.05. (D) Similar effects were observed when GFP RNA was measured by real-time PCR. Relative fold values of JQ1 versus JQ1 and GSK343 were compared by using the Student paired t test. Error bars represent standard errors of the means (n = 3). *, P < 0.05. (E) The indicated treatment conditions were also evaluated by ChIP at the HIV LTR for H3Ac, H3K27me3, Pol II, and phospho-Pol II occupancy using the respective antibodies at the positions and with the primers indicated in Materials and Methods. The line diagram at the bottom represents the 5′ HIV LTR and the relative nucleosome positions and primer positions used for ChIP assays. At Nuc-0, Nuc-1, and the downstream region, the chromatin marks H3K27me3 and H3Ac and the occupancy of RNA Pol II and phospho-Ser RNA Pol II (marker of processive transcription or active Pol II) were measured. At Nuc-0, GSK343 treatment reduced H3K27me3 and modestly increased H3Ac when combined with JQ1, while the occupancy of Pol II and pPol II remained unchanged. At Nuc-1, which is close to the transcription start site, similar observations were made, but the Pol II and pPol II occupancy increased with combined treatments with GSK343 and JQ1. At the downstream Gag gene site, in the absence of nearby histones, no effect on acetyl and methyl marks was observed, but higher pPol II occupancy than that of Pol II was seen, indicative of processive transcription. Error bars represent standard errors of the means from three independent experiments. For each chromatin mark/occupancy described and to compare the ChIP data obtained with the combined and individual drug treatments, we performed ANOVA of the 4 different treatments (DMSO, GSK343, JQ1, and GSK343 plus JQ1). All differences noted were significant; , P < 0.001. ChIP panels were normalized to H3 levels. The H3 level did not significantly change between the control and treated conditions.
FIG 6
FIG 6
Components of the Polycomb repressive complex occupy the HIV promoter in a latently infected primary T-cell model and validation of EZH2 inhibition by GSK343 in uninfected PBMCs. PRC1 (RING1B and BMI1) and PRC2 (EZH2 and EED) components occupy the HIV-1 promoter in latently infected primary T cells. (A) NL4-3-infected primary T cells at day 4 and day 8 postinfection (40), as described in the legend of Fig. 7A. ChIPs for total histone H3, H3K27me3, p50, H3K27me2, and mock IgG are also shown. Means and standard errors of the means from three independent experiments are displayed. For each chromatin occupancy described, the Student paired t test was done for 3 pairs of assays. *, P < 0.05 for mock IgG-treated versus untreated cells at day 4; •, P < 0.05 for mock IgG-treated versus untreated cells at day 8; NS, not significant (P > 0.05). (B) Representative blot showing a reduction in H3K27me3 in total uninfected PBMCs at 2 μM GSK343 for 96 h. Histone H3 and α-tubulin are shown as loading controls. (V, vehicle control [0.02% DMSO]). (C) ChIP changes in the samples described in panel B. Occupancies of H3K27me3 and control IgG were measured at the host gene promoters SAT2 (heterochromatic gene) and MyoD (euchromatic region gene). Results were compared with those for DMSO-treated cells by using Student paired t tests. Error bars represent standard errors of the means (n = 3). *, P < 0.05.
FIG 7
FIG 7
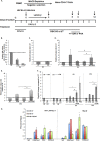
HIV LTR demethylation mediated by an EZH2 inhibitor prior to exposure to the HDAC inhibitor VOR is associated with enhanced proviral expression in ex vivo cultures of resting CD4+ T cells. (A) Schema for establishment of the primary cell model of HIV latency. Briefly, resting naive CD4+ cells were purified by negative selection using magnetically activated cell sorting (MACS) from the total PBMCs of the healthy donors. These resting cells were treated with 50 nM CCL19 in the presence of 10 U IL-2 for 2 days. The cells were infected with HIV-1 NL4-3 at day 0, and latency was established at day 4 postinfection. A total of 2 μM GSK343 was added at day 4 after latent infection was established. On day 8, GSK343-treated resting T cells were either exposed to 500 nM VOR or left untreated for a further 24 h. Also, day 8 untreated latently infected cells were treated with 2 μg/ml PHA (positive control) for 24 h. The effects were measured on days 9 and 12. Samples were washed on day 9 and kept in complete medium with 10 U IL-2/ml until the time of harvest at day 12. (B to E) Graphs showing viral p24 production in supernatants measured by a p24 ELISA at the times indicated. Means and standard errors of the means are from three independent experiments compared to the untreated control conditions; p24 values were normalized to 1 for the untreated control. UT, infected but untreated; PRE, before washing to remove the viral inoculum; POST, after washing to remove the viral inoculum; V, VOR; 343, GSK343. D0 refers to day 0 postinfection. The Student paired t test was done for paired samples as indicated, and values are from three experiments (n = 3). or *, P < 0.05. (F) Enhanced viral production was also measured as cell-associated viral gag RNA fold changes compared to untreated infected samples for each time point group (days 0, 4, 8, 9, and 12) by using real-time PCR. The Student paired t test was done for the paired samples as indicated, and values from three experiments are shown (n = 3). or *, P < 0.05. (G) ChIP assay of the cellular promoter MyoD and viral promoter HIV LTR Nuc-1 was performed for mock (IgG) and the H3K27me3, H3K9me3, and H3Ac chromatin marks for untreated and GSK343-treated samples on days 4 and 8. ChIP panels were normalized to H3 levels. The H3 level did not significantly change between the control and treated conditions. Results were compared with those for untreated day 4 chromatin by using Student paired t tests. Error bars represent standard errors of the means (n = 3). *, P < 0.05.

Similar articles

Cited by

References

    1. Archin NM, Sung JM, Garrido C, Soriano-Sarabia N, Margolis DM. 2014. Eradicating HIV-1 infection: seeking to clear a persistent pathogen. Nat Rev Microbiol 12:750–764. doi:10.1038/nrmicro3352. - DOI - PMC - PubMed
    1. Siliciano RF, Greene WC. 2011. HIV latency. Cold Spring Harb Perspect Med 1:a007096. doi:10.1101/cshperspect.a007096. - DOI - PMC - PubMed
    1. Chun TW, Stuyver L, Mizell SB, Ehler LA, Mican JA, Baseler M, Lloyd AL, Nowak MA, Fauci AS. 1997. Presence of an inducible HIV-1 latent reservoir during highly active antiretroviral therapy. Proc Natl Acad Sci U S A 94:13193–13197. doi:10.1073/pnas.94.24.13193. - DOI - PMC - PubMed
    1. Finzi D, Hermankova M, Pierson T, Carruth LM, Buck C, Chaisson RE, Quinn TC, Chadwick K, Margolick J, Brookmeyer R, Gallant J, Markowitz M, Ho DD, Richman DD, Siliciano RF. 1997. Identification of a reservoir for HIV-1 in patients on highly active antiretroviral therapy. Science 278:1295–1300. doi:10.1126/science.278.5341.1295. - DOI - PubMed
    1. Wong JK, Hezareh M, Gunthard HF, Havlir DV, Ignacio CC, Spina CA, Richman DD. 1997. Recovery of replication-competent HIV despite prolonged suppression of plasma viremia. Science 278:1291–1295. doi:10.1126/science.278.5341.1291. - DOI - PubMed

Publication types

MeSH terms