. 2016 Mar 10;35(10):1250-60.
doi: 10.1038/onc.2015.179. Epub 2015 Jun 1.

Oncogenic PI3K and K-Ras stimulate de novo lipid synthesis through mTORC1 and SREBP

Affiliations

Oncogenic PI3K and K-Ras stimulate de novo lipid synthesis through mTORC1 and SREBP

S J H Ricoult et al. Oncogene. .

Abstract

An enhanced capacity for de novo lipid synthesis is a metabolic feature of most cancer cells that distinguishes them from their cells of origin. However, the mechanisms through which oncogenes alter lipid metabolism are poorly understood. We find that expression of oncogenic PI3K (H1047R) or K-Ras (G12V) in breast epithelial cells is sufficient to induce de novo lipogenesis, and this occurs through the convergent activation of the mechanistic target of rapamycin complex 1 (mTORC1) downstream of these common oncogenes. Oncogenic stimulation of mTORC1 signaling in this isogenic setting or a panel of eight breast cancer cell lines leads to activation of the sterol regulatory element-binding proteins (SREBP1 and SREBP2) that are required for oncogene-induced lipid synthesis. The SREBPs are also required for the growth factor-independent growth and proliferation of oncogene-expressing cells. Finally, we find that elevated mTORC1 signaling is associated with increased mRNA and protein levels of canonical SREBP targets in primary human breast cancer samples. These data suggest that the mTORC1/SREBP pathway is a major mechanism through which common oncogenic signaling events induce de novo lipid synthesis to promote aberrant growth and proliferation of cancer cells.


Figures

Figure 1
Figure 1
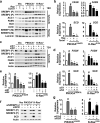
Oncogenic PI3K and K-Ras promote de novo lipogenesis through mTORC1 activation. (a) Model of the convergent regulation of mTORC1 through the PI3K and K-Ras pathways and the action of different classes of mTOR inhibitors. (b) Growth-factor independent activation of mTORC1 signaling by oncogenes. MCF10a cells stably expressing empty vector, PIK3CAH1047R, or K-RasG12V were serum starved for 16 h in the presence of vehicle, rapamycin (20 nM), or Torin1 (250 nM). Immunoblots are of proteins and phosphorylated (P) proteins in the cytosolic fraction, with phosphorylation of 4EBP1 detected by mobility shift. (c) Oncogene and mTORC1-dependent induction of de novo lipid synthesis in MCF10a cells. Incorporation of 1-[14C]-acetate into the lipid fraction was measured in the cells from a in the presence of vehicle, rapamycin (20 nM), PP242 (2.5 μM), or Torin1 (250 nM). Representative data are shown as mean ± s.e.m. relative to vector-expressing cells (white bar), n=4. (d,e) Effects of Raptor and Rictor depletion on signaling and de novo lipogenesis. The cells in a were transfected with siRNAs targeting Raptor or Rictor. Cells were lysed 72 h post-transfection following 16 h serum starvation, to analyze signaling (d) or lipid synthesis, as measured and presented in b (e). Representative data are shown as mean ± s.e.m. relative to vector-expressing cells (white bar), n=3. (c,e) #P-value < 0.05 compared to vector-expressing cells; *P-value < 0.05 compared to vehicle-treated cells expressing the same oncogene.
Figure 2
Figure 2
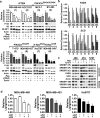
Activation of SREBP1 and SREBP2 by mTORC1 is required for PI3K- and K-Ras-induced de novo lipogenesis. (a) Regulation of SREBP isoforms by oncogenes and mTORC1. MCF10a cells stably expressing empty vector, PIK3CAH1047R,or K-RasG12V were serum starved for 16 h in the presence of vehicle, rapamycin (20 nM), or Torin1 (250 nM). Cytosolic and nuclear fractions were collected to detect the cytosolic precursor (P) and the nuclear mature (M) forms of SREBP1 and 2. * denotes a cross-reacting band. (b) Oncogene and mTORC1-dependent induction of FASN and SCD expression. RNA was isolated from cells treated as in a for analysis by qRT-PCR. Representative data are shown as mean ± s.e.m. relative to vector-expressing cells (white bar), n=2. (c-e) Effects of SREBP1 and SREBP2 knockdown on SREBP targets and de novo lipogenesis. The cells in a were transfected with siRNAs targeting SREBP1, SREBP2, or both. Cells were lysed 72 h post-transfection following 20 h serum starvation for immunoblotting of the cytosolic fraction (c) or RNA extraction for qRT-PCR analysis (d). Representative data are shown as mean ± s.e.m. relative to vector-expressing cells (white bar), n=3. (e) Incorporation of 1-[14C]-acetate into the lipid fraction was measured in these cells, with data shown as mean ± s.e.m. relative to vector-expressing cells (white bar), n=2. (f,g) Effects of SREBP and SCD knockdown on lipogenesis. The cells in a were transfected with siRNAs targeting SREBP1 and SREBP2, or SCD. Cells were lysed as in c for immunoblotting (f). Incorporation of 1-[14C]-acetate into the lipid fraction was measured in these cells (g). Data are shown as mean ± s.e.m. relative to vector-expressing cells (white bar), n=2. (b,d,e) # P-value < 0.05 compared to vector-expressing cells; * P-value < 0.05 compared to vehicle-treated cells expressing the same oncogene.
Figure 3
Figure 3
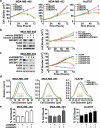
Breast cancer lines depend on mTORC1 and its activation of SREBP for de novo lipogenesis. (a) Signaling and de novo lipogenesis in response to mTOR inhibition. Eight breast cancer cell lines were serum starved for 18 h in the presence of vehicle, rapamycin (20 nM), PP242 (2.5 μM), or Torin1 (250 nM). Note: phosphorylation of S6 and, via mobility shifts, 4E-BP1 are shown as markers of mTORC1 activation. Incorporation of 1-[14C]-acetate into the lipid fraction was measured. Representative data are shown as mean ± s.e.m. relative to vehicle-treated cells, n=2. * P-value < 0.05 compared to vehicle-treated cells. (b) mTORC1-dependent FASN and SCD expression in breast cancer cells. The cell lines, numbered as in a, were serum starved for 18 h in the presence of vehicle, rapamycin (20 nM), or Torin1 (250 nM). RNA was isolated for analysis by qRT-PCR, with transcript levels shown as mean ± s.e.m. relative to vehicle-treated cells. * P-value < 0.05 compared to vehicle-treated cells. (c) Dependence of SREBP processing on mTORC1 in breast cancer cells. MDA-MB-468, MDA-MB-453 and Hs578T were treated as b and fractionated into nuclear and cytosolic fractions for immunoblotting. The SREBP full-length precursor (P), processed C-terminus (C) and nuclear mature (M) isoforms were detected. * denotes a cross-reacting band. (d) SREBP knockdown attenuates de novo lipogenesis in breast cancer cells. The cells in c were transfected with siRNAs targeting SREBP1, SREBP2, or both. Cells were lysed 72 h post-transfection following 16 h serum starvation to analyze lipid synthesis as in a. Data are shown as mean ± s.e.m. relative to cells transfected with non-targeting siRNA, n=2. * P-value < 0.05.
Figure 4
Figure 4
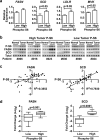
The SREBPs support proliferation, growth, and survival in breast cancer cell lines. (a) Effect of SREBP1 and SREBP2 depletion on proliferation in breast cancer cells. MDA-MB-468, MDA-MB-453 and Hs578T cells were transfected with siRNAs targeting SREBP1, SREBP2, or both and were switched to lipid-reduced serum 24 h after the knockdown (t = 0 h). For all proliferation graphs, data are shown as mean ± s.e.m., n=3. * P-value < 0.05 compared to control cells at the final time point. (b) Rescue of human SREBP2 knockdown with mouse SREBP2 expression. MDA-MB-468 cells stably expressing mouse SREBP2 were transfected with siRNA targeting human SREBP2. Cells were lysed for immunoblotting 72 h post-transfection, following 16 h serum starvation. To measure proliferation, cells were cultured in lipid-reduced serum and counted every 24 h. (c) Effects of SREBP2 shRNA on SREBP target expression and proliferation. MDA-MB-468 cells stably expressing four different shRNA sequences targeting SREBP2 were either serum starved for 16 h for immunoblot analysis or cultured in lipid-reduced serum to measure proliferation. (d) Effects of SREBP knockdown on cell size. Cell diameter was measured at 48 h in cells from a, in solution. Color-coded P-values, compared to cells with control siRNAs, correspond to the color-coding in the legend (>1000 cells measured for each). (e) Effect of SREBP knockdown on breast cancer cell viability. Percent cell death was determined by counting Annexin-V and/or propidium iodide positive cells treated as in a by flow cytometry 72 h after siRNA transfection. Data are shown as mean ± s.e.m. relative to cells transfected with non-targeting siRNA, n=2. * P-value < 0.05.
Figure 5
Figure 5
Effects of oncogene expression and SREBP depletion on cell growth and proliferation in MCF10a cells. (a,c) Proliferation of PIK3CAH1047R- and K-RasG12V-expressing MCF10a cells compared to vector-expressing cells cultured in full growth medium (a) or in low serum conditions (c) starting 24 h post-knockdown (t = 0 h). For all proliferation graphs, time points are shown as mean ± s.e.m., n=3. * P-value < 0.05 compared to control cells at the final time point. (b,d) Effect of SREBP depletion on proliferation of oncogene-expressing MCF10a cells. Cells from a and c cultured in full serum (b) or low serum (d) were counted every 24 h following the siRNA-mediated knockdown of SREBP1, SREBP2, or both. (e,f) Oncogene- and SREBP-dependent effects on cell growth. The diameters of the cells treated as in c (e) and d (f) were measured at 48 h, following trypsinization. Color-coded P-values, compared to cells with control siRNAs, correspond to the color-coding in the legend (>1000 cells measured for each).
Figure 6
Figure 6
Expression of SREBP targets is associated with mTORC1 activation in human breast cancer. (a) Comparison of SREBP target gene expression and P-S6 levels in data from primary breast cancer samples. Expression of FASN, SCD, LDLR, and MVK in breast carcinoma samples from the TCGA, grouped by high (n=112) or low (n=116) P-S6-S240/244 levels. Data are shown as mean ± s.e.m. relative to low P-S6 samples. (b,c) Association of FASN and SCD protein levels with P-S6 levels in primary human breast cancers. Dot blots of six different matched pairs of breast cancer and normal tissue are shown, each spotted in triplicate (b). The log2 fold change of P-S6 levels in paired tumor versus normal tissue is graphed with log2 fold change of either FASN (n=40) or SCD (n=37) (c), with the coefficient of determination (R2) provided. (d) The data from c was grouped into high and low fold changes of P-S6 levels in tumor versus normal tissue and graphed for the fold-change in FASN and SCD protein levels.

Similar articles

Cited by

References

    1. Medes G, Thomas A, Weinhouse S. Metabolism of neoplastic tissue. IV. A study of lipid synthesis in neoplastic tissue slices in vitro. Cancer Res. 1953;13:27–29. - PubMed
    1. Menendez JA, Lupu R. Fatty acid synthase and the lipogenic phenotype in cancer pathogenesis. Nat Rev Cancer. 2007;7:763–777. - PubMed
    1. Santos CR, Schulze A. Lipid metabolism in cancer. FEBS J. 2012;279:2610–2623. - PubMed
    1. Kuhajda FP, Jennert K, Wood FD, Hennigart RA, Jacobs LB, Dick JD, et al. Fatty acid synthesis: A potential selective target for antineoplastic therapy. Proc Natl Acad Sci USA. 1994;91:6379–6383. - PMC - PubMed
    1. Li J, Ding S, Habib N, Fermor B, Wood C, Gilmour R. Partial characterization of a cDNA for human stearoyl-CoA desaturase and changes in its mRNA expression in some normal and malignant tissues. Int J Cancer. 1994;57:348–352. - PubMed

Publication types

MeSH terms

Substances