

Cerebral β-Amyloidosis in Mice Investigated by Ultramicroscopy
- PMID: 26017149
- PMCID: PMC4446269
- DOI: 10.1371/journal.pone.0125418
Cerebral β-Amyloidosis in Mice Investigated by Ultramicroscopy
Abstract
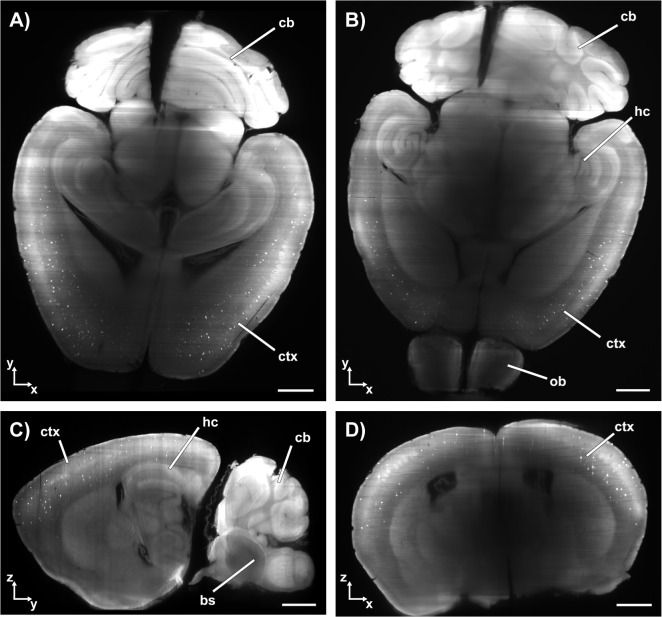
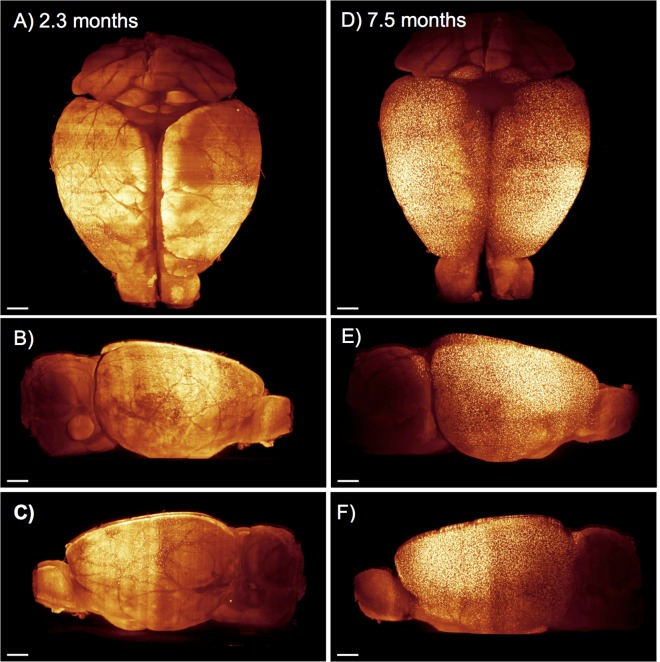
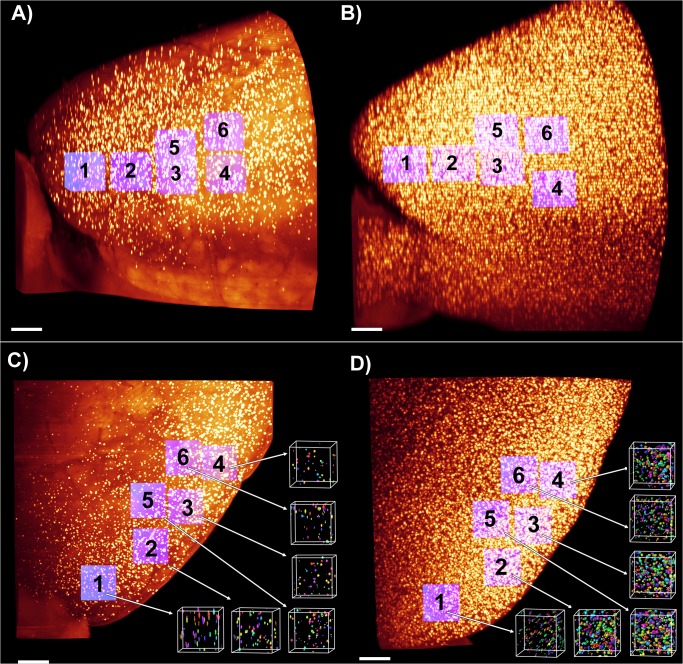
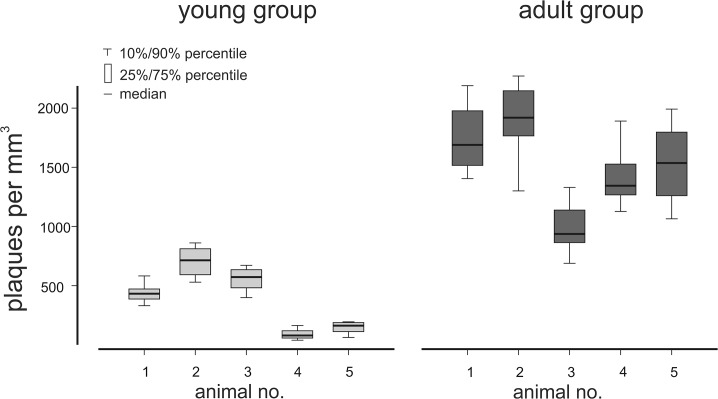
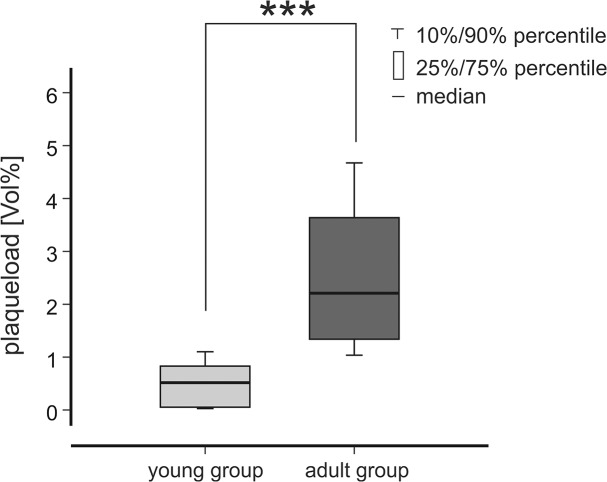
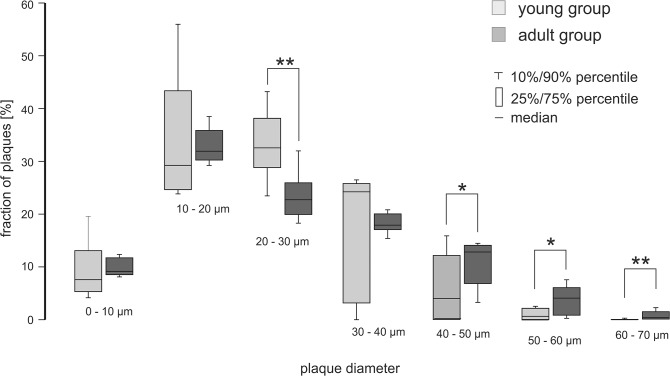
Alzheimer´s disease (AD) is the most common neurodegenerative disorder. AD neuropathology is characterized by intracellular neurofibrillary tangles and extracellular β-amyloid deposits in the brain. To elucidate the complexity of AD pathogenesis a variety of transgenic mouse models have been generated. An ideal imaging system for monitoring β-amyloid plaque deposition in the brain of these animals should allow 3D-reconstructions of β-amyloid plaques via a single scan of an uncropped brain. Ultramicroscopy makes this possible by replacing mechanical slicing in standard histology by optical sectioning. It allows a time efficient analysis of the amyloid plaque distribution in the entire mouse brain with 3D cellular resolution. We herein labeled β-amyloid deposits in a transgenic mouse model of cerebral β-amyloidosis (APPPS1 transgenic mice) with two intraperitoneal injections of the amyloid-binding fluorescent dye methoxy-X04. Upon postmortem analysis the total number of β-amyloid plaques, the β-amyloid load (volume percent) and the amyloid plaque size distributions were measured in the frontal cortex of two age groups (2.5 versus 7-8.5 month old mice). Applying ultramicroscopy we found in a proof-of-principle study that the number of β-amyloid plaques increases with age. In our experiments we further observed an increase of large plaques in the older age group of mice. We demonstrate that ultramicroscopy is a fast, and accurate analysis technique for studying β-amyloid lesions in transgenic mice allowing the 3D staging of β-amyloid plaque development. This in turn is the basis to study neural network degeneration upon cerebral β-amyloidosis and to assess Aβ-targeting therapeutics.
Conflict of interest statement
Figures


Similar articles
-
Imaging Abeta plaques in living transgenic mice with multiphoton microscopy and methoxy-X04, a systemically administered Congo red derivative.J Neuropathol Exp Neurol. 2002 Sep;61(9):797-805. doi: 10.1093/jnen/61.9.797. J Neuropathol Exp Neurol. 2002. PMID: 12230326
-
Kinetics of cerebral amyloid angiopathy progression in a transgenic mouse model of Alzheimer disease.J Neurosci. 2006 Jan 11;26(2):365-71. doi: 10.1523/JNEUROSCI.3854-05.2006. J Neurosci. 2006. PMID: 16407531 Free PMC article.
-
Long-term in vivo imaging of β-amyloid plaque appearance and growth in a mouse model of cerebral β-amyloidosis.J Neurosci. 2011 Jan 12;31(2):624-9. doi: 10.1523/JNEUROSCI.5147-10.2011. J Neurosci. 2011. PMID: 21228171 Free PMC article.
-
Targeting prion amyloid deposits in vivo.J Neuropathol Exp Neurol. 2004 Jul;63(7):775-84. doi: 10.1093/jnen/63.7.775. J Neuropathol Exp Neurol. 2004. PMID: 15290902
-
[18F]-florbetaben PET/CT Imaging in the Alzheimer's Disease Mouse Model APPswe/PS1dE9.Curr Alzheimer Res. 2019;16(1):49-55. doi: 10.2174/1567205015666181022095904. Curr Alzheimer Res. 2019. PMID: 30345916
Cited by
-
Brain virtual histology with X-ray phase-contrast tomography Part II:3D morphologies of amyloid-β plaques in Alzheimer's disease models.Biomed Opt Express. 2022 Feb 23;13(3):1640-1653. doi: 10.1364/BOE.438890. eCollection 2022 Mar 1. Biomed Opt Express. 2022. PMID: 35414980 Free PMC article.
-
Neuronal Protein Tyrosine Phosphatase 1B Hastens Amyloid β-Associated Alzheimer's Disease in Mice.J Neurosci. 2020 Feb 12;40(7):1581-1593. doi: 10.1523/JNEUROSCI.2120-19.2019. Epub 2020 Jan 8. J Neurosci. 2020. PMID: 31915254 Free PMC article.
-
Whole brain imaging reveals distinct spatial patterns of amyloid beta deposition in three mouse models of Alzheimer's disease.J Comp Neurol. 2019 Sep 1;527(13):2122-2145. doi: 10.1002/cne.24555. Epub 2018 Dec 4. J Comp Neurol. 2019. PMID: 30311654 Free PMC article.
-
Visible spectrum extended-focus optical coherence microscopy for label-free sub-cellular tomography.Biomed Opt Express. 2017 Jun 20;8(7):3343-3359. doi: 10.1364/BOE.8.003343. eCollection 2017 Jul 1. Biomed Opt Express. 2017. PMID: 28717571 Free PMC article.
-
Correlated magnetic resonance imaging and ultramicroscopy (MR-UM) is a tool kit to assess the dynamics of glioma angiogenesis.Elife. 2016 Feb 2;5:e11712. doi: 10.7554/eLife.11712. Elife. 2016. PMID: 26830460 Free PMC article.
References
Publication types
MeSH terms
Substances
Grants and funding
LinkOut - more resources
Full Text Sources
Other Literature Sources
Medical
Molecular Biology Databases
