Integrative modeling reveals the principles of multi-scale chromatin boundary formation in human nuclear organization
- PMID: 26013771
- PMCID: PMC4443654
- DOI: 10.1186/s13059-015-0661-x
Integrative modeling reveals the principles of multi-scale chromatin boundary formation in human nuclear organization
Abstract
Background: Interphase chromosomes adopt a hierarchical structure, and recent data have characterized their chromatin organization at very different scales, from sub-genic regions associated with DNA-binding proteins at the order of tens or hundreds of bases, through larger regions with active or repressed chromatin states, up to multi-megabase-scale domains associated with nuclear positioning, replication timing and other qualities. However, we have lacked detailed, quantitative models to understand the interactions between these different strata.
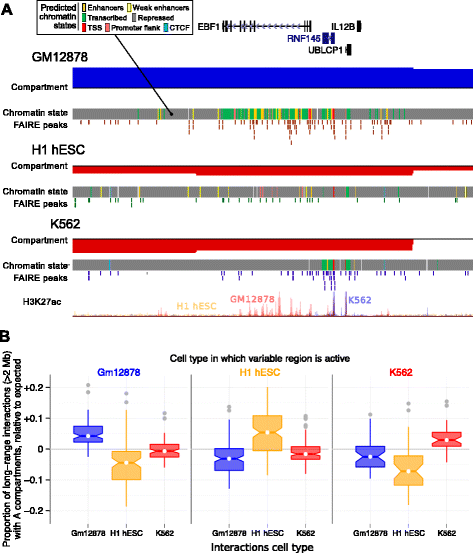
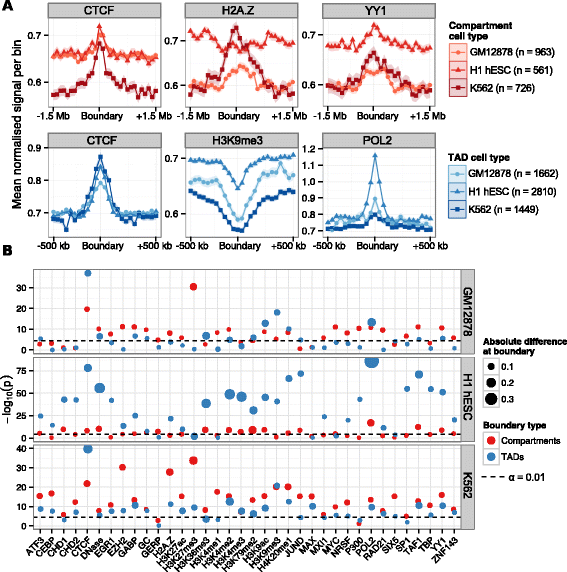
Results: Here we collate large collections of matched locus-level chromatin features and Hi-C interaction data, representing higher-order organization, across three human cell types. We use quantitative modeling approaches to assess whether locus-level features are sufficient to explain higher-order structure, and identify the most influential underlying features. We identify structurally variable domains between cell types and examine the underlying features to discover a general association with cell-type-specific enhancer activity. We also identify the most prominent features marking the boundaries of two types of higher-order domains at different scales: topologically associating domains and nuclear compartments. We find parallel enrichments of particular chromatin features for both types, including features associated with active promoters and the architectural proteins CTCF and YY1.
Conclusions: We show that integrative modeling of large chromatin dataset collections using random forests can generate useful insights into chromosome structure. The models produced recapitulate known biological features of the cell types involved, allow exploration of the antecedents of higher-order structures and generate testable hypotheses for further experimental studies.
Figures
Similar articles
-
Topologically associating domains are stable units of replication-timing regulation.Nature. 2014 Nov 20;515(7527):402-5. doi: 10.1038/nature13986. Nature. 2014. PMID: 25409831 Free PMC article.
-
Genetic sequence-based prediction of long-range chromatin interactions suggests a potential role of short tandem repeat sequences in genome organization.BMC Bioinformatics. 2017 Apr 18;18(1):218. doi: 10.1186/s12859-017-1624-x. BMC Bioinformatics. 2017. PMID: 28420341 Free PMC article.
-
Three-dimensional disorganization of the cancer genome occurs coincident with long-range genetic and epigenetic alterations.Genome Res. 2016 Jun;26(6):719-31. doi: 10.1101/gr.201517.115. Epub 2016 Apr 6. Genome Res. 2016. PMID: 27053337 Free PMC article.
-
Chromosome territories, interchromatin domain compartment, and nuclear matrix: an integrated view of the functional nuclear architecture.Crit Rev Eukaryot Gene Expr. 2000;10(2):179-212. Crit Rev Eukaryot Gene Expr. 2000. PMID: 11186332 Review.
-
Making Sense of the Tangle: Insights into Chromatin Folding and Gene Regulation.Genes (Basel). 2016 Sep 23;7(10):71. doi: 10.3390/genes7100071. Genes (Basel). 2016. PMID: 27669308 Free PMC article. Review.
Cited by
-
Towards a predictive model of chromatin 3D organization.Semin Cell Dev Biol. 2016 Sep;57:24-30. doi: 10.1016/j.semcdb.2015.11.013. Epub 2015 Dec 3. Semin Cell Dev Biol. 2016. PMID: 26658098 Free PMC article. Review.
-
Quantitative prediction of enhancer-promoter interactions.Genome Res. 2020 Jan;30(1):72-84. doi: 10.1101/gr.249367.119. Epub 2019 Dec 2. Genome Res. 2020. PMID: 31804952 Free PMC article.
-
In silico prediction of high-resolution Hi-C interaction matrices.Nat Commun. 2019 Dec 6;10(1):5449. doi: 10.1038/s41467-019-13423-8. Nat Commun. 2019. PMID: 31811132 Free PMC article.
-
Machine and deep learning methods for predicting 3D genome organization.ArXiv [Preprint]. 2024 Mar 4:arXiv:2403.03231v1. ArXiv. 2024. Update in: Methods Mol Biol. 2025;2856:357-400. doi: 10.1007/978-1-0716-4136-1_22 PMID: 38495565 Free PMC article. Updated. Preprint.
-
When TADs go bad: chromatin structure and nuclear organisation in human disease.F1000Res. 2017 Mar 24;6:F1000 Faculty Rev-314. doi: 10.12688/f1000research.10792.1. eCollection 2017. F1000Res. 2017. PMID: 28408976 Free PMC article. Review.
References
Publication types
MeSH terms
Substances
Grants and funding
LinkOut - more resources
Full Text Sources
Other Literature Sources

