. 2015 Aug;35(15):2673-83.
doi: 10.1128/MCB.00105-15. Epub 2015 May 26.

Toll-Like Receptor Signaling Induces Nrf2 Pathway Activation through p62-Triggered Keap1 Degradation

Affiliations

Toll-Like Receptor Signaling Induces Nrf2 Pathway Activation through p62-Triggered Keap1 Degradation

Shasha Yin et al. Mol Cell Biol. 2015 Aug.

Abstract

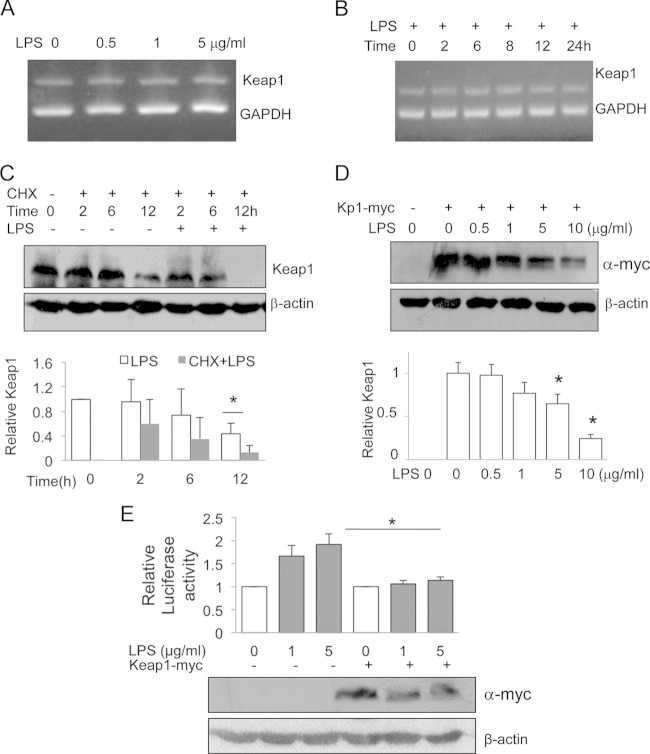
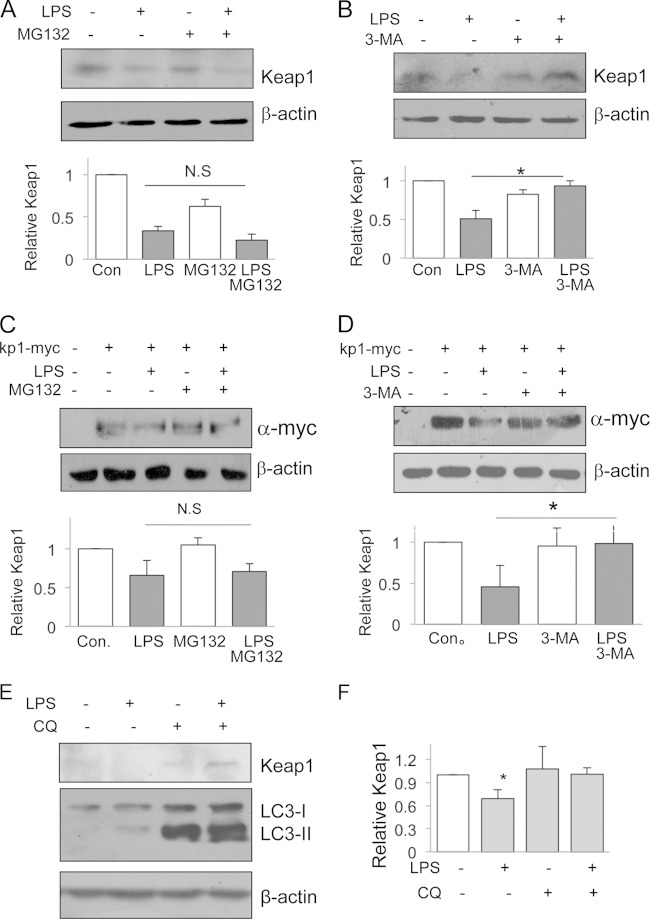
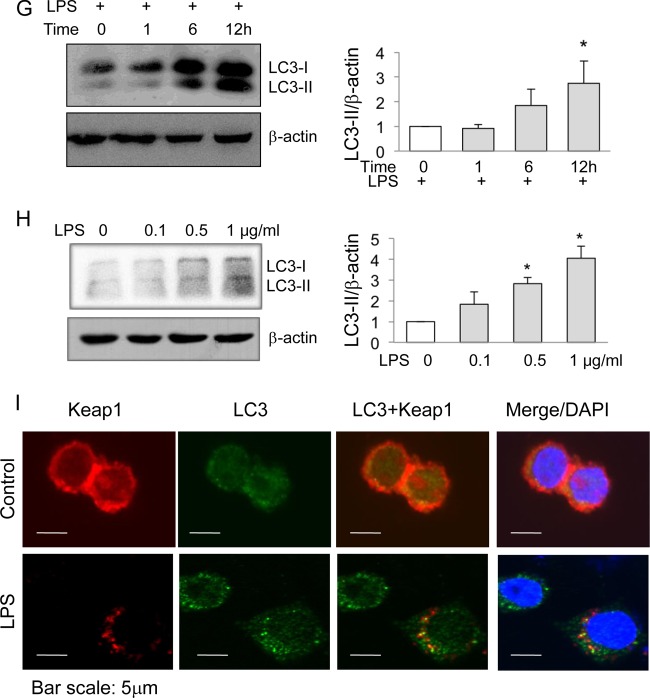
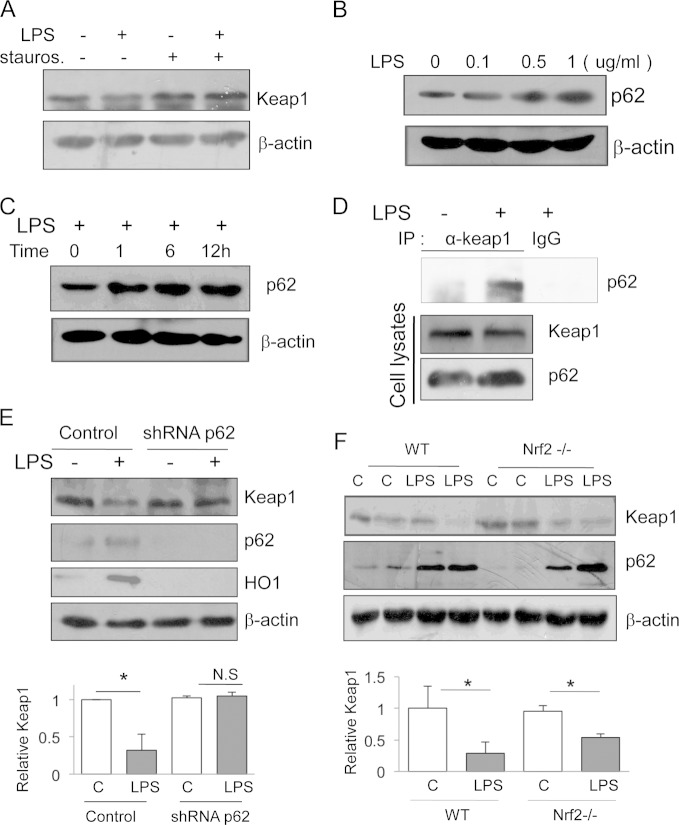
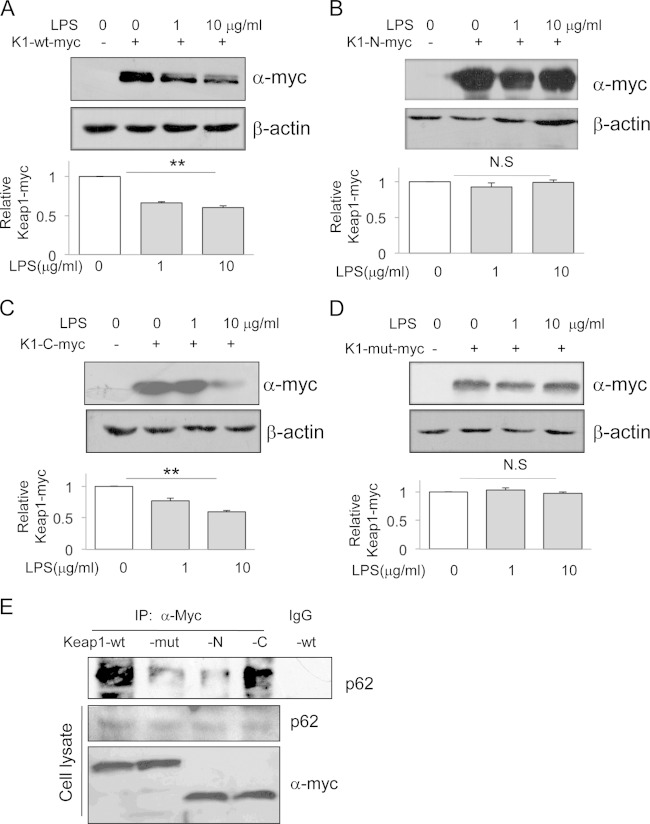
Toll-like receptors (TLRs) induce inflammation and tissue repair through multiple signaling pathways. The Nrf2 pathway plays a key role in defending against the tissue damage incurred by microbial infection or inflammation-associated diseases. The critical event that mediates TLR-induced Nrf2 activation is still poorly understood. In this study, we found that lipopolysaccharide (LPS) and other Toll-like receptor (TLR) agonists activate Nrf2 signaling and the activation is due to the reduction of Keap1, the key Nrf2 inhibitor. TLR signaling-induced Keap1 reduction promoted Nrf2 translocation from the cytoplasm to the nucleus, where it activated transcription of its target genes. TLR agonists modulated Keap1 at the protein posttranslation level through autophagy. TLR signaling increased the expression of autophagy protein p62 and LC3-II and induced their association with Keap1 in the autophagosome-like structures. We also characterized the interaction between p62 and Keap1 and found that p62 is indispensable for TLR-mediated Keap1 reduction: TLR signaling had no effect on Keap1 if cells lacked p62 or if cells expressed a mutant Keap1 that could not interact with p62. Our study indicates that p62-mediated Keap1 degradation through autophagy represents a critical linkage for TLR signaling regulation of the major defense network, the Nrf2 signaling pathway.


Figures

FIG 1
FIG 1
TLR signaling activates the Nrf2 pathway. (A) RAW cells were treated with increasing doses of LPS for 16 h. HO-1 was assayed by Western blotting. (B) RAW cells were treated with 1 μg/ml of LPS for various times. HO-1 and GST were assayed by Western blotting. (C) RAW cells were treated with various doses of PGN for 16 h. HO-1 was assayed by Western blotting. (D) RAW cells were treated with various doses of poly(I·C) for 16 h. HO-1 was assayed by Western blotting. (E) WT mice were treated with LPS (10 μg/kg of body weight) by intraperitoneal injection for 24 h. Kidneys from two mice in each group were removed, and HO-1 was assayed by Western blotting. Con., control mice. (F and G) Time-dependent (F) and dose-dependent (G) study of Nrf2 protein levels. RAW cells were treated with 1 μg/ml LPS for different times or with different doses of LPS for 16 h, and the Nrf2 protein level was assayed by Western blotting. (H) RAW cells were treated with 0.1 and 1 μg/ml LPS for 3 h. Nuclear Nrf2 (N. Nfr2) was assayed by Western blotting. (I) Luciferase assay. HEK293 cells were transfected with the HO-1 promoter reporter plasmid pHO-1p/Luc, followed by treatment with increasing doses of LPS for 16 h. Cell lysates were assayed for luciferase activity. The experiments were repeated at least three times, and representative results are shown. *, P < 0.05 compared to the results for the control. (J) Cell viability assay. RAW cells were treated with various doses of LPS for 24 h. A cell counting kit (CCK-8) was used to measure the living cells. The assay was performed with cells in triplicate.
FIG 2
FIG 2
TLR signaling reduces the Keap1 protein level. (A and B) RAW cells were treated with LPS (1 μg/ml) for various times (A) or with different doses of LPS for 16 h (B). Keap1 was assayed by Western blotting. (C to E) RAW cells were treated with various doses of PGN (C), poly(I·C) (D), or E. coli (E). Keap1 was assayed by Western blotting. (F) A WT mouse was treated with LPS (10 μg/kg of body weight) by intraperitoneal injection for 24 h. The mouse kidneys were removed, and Keap1 was assayed by Western blotting.
FIG 3
FIG 3
LPS induces Keap1 degradation. (A and B) RAW cells were treated with different doses of LPS for 16 h (A) or with 1 μg/ml of LPS for various times (B). Keap1 and GAPDH (glyceraldehyde-3-phosphate dehydrogenase) mRNAs were simultaneously analyzed by RT-PCR in a single PCR and visualized by agarose gel electrophoresis. (C) RAW cells were pretreated with CHX (0.5 μg/ml) alone or in the presence of LPS (200 ng/ml) for various times. Keap1 protein was examined by Western blotting (top), and Keap1 levels were quantified (bottom). The experiments were repeated at least three times, and representative results are shown. *, P < 0.05. (D) HEK293 cells were transfected with a plasmid carrying WT-Keap1-myc (Kp1-myc) and treated with various amounts of LPS for another 16 h. The cell lysates were subjected to Western blotting analysis using anti-myc antibody (top), and Keap1 levels were quantified (bottom). (E) HEK293 cells were cotransfected with WT-Keap1-myc and an HO-1 promoter reporter. Then, the cells were treated with LPS for 16 h and the luciferase activities were measured (top). The expression of exogenous Keap1-myc was monitored by Western blotting (bottom). The experiments were repeated at least three times, and representative results are shown. *, P < 0.05.
FIG 4
FIG 4
Autophagy mediates LPS-induced Keap1 degradation. (A and B) RAW cells were treated with MG132 (1 μM) (A) or 3-MA (1 mM) (B) for 1 h, and then LPS (200 ng/ml) was added to some cells for 12 h. Expression of endogenous Keap1 protein was examined by Western blotting (top). Keap1 quantities are shown at the bottom. *, P < 0.05; N.S, no significant difference. (C and D) HEK293 cells were first transfected with plasmids encoding myc-tagged Keap1 and then treated with MG132 (2.5 μM) (C) or 3-MA (1 mM) (D) for 1 h in the presence or absence of LPS (200 ng/ml) for an additional 12 h. Cell lysates were analyzed for exogenous Keap1 expression by Western blotting with an anti-myc antibody (top). Keap1 quantities are shown at the bottom. The experiments were repeated at least three times, and representative results are shown. *, P < 0.05; N.S, no significant difference. (E and F) RAW cells were treated with LPS (200 ng/ml) or CQ (25 μM), or both, for 12 h. Keap1 and LC3 were analyzed by Western blotting (E), and Keap1 levels were quantified (F). (G) RAW cells were treated with LPS (200 ng/ml) for various times, and LC3 was analyzed by Western blotting (left). The ratio of LC3-II to β-actin was calculated and plotted (right). *, P < 0.05 compared to the results for the control. (H) RAW cells were treated with various doses of LPS for 12 h, and LC3 was analyzed by Western blotting (left). The ratio of LC3-II to β-actin was calculated and plotted (right). *, P < 0.05 compared to the results for the control. (I) RAW cells were treated with LPS (200 ng/ml) for 12 h, and then LC3 and Keap1 proteins were examined by immunostaining. DAPI (4′,6-diamidino-2-phenylindole) stain was applied as a nuclear marker.
FIG 4
FIG 4
Autophagy mediates LPS-induced Keap1 degradation. (A and B) RAW cells were treated with MG132 (1 μM) (A) or 3-MA (1 mM) (B) for 1 h, and then LPS (200 ng/ml) was added to some cells for 12 h. Expression of endogenous Keap1 protein was examined by Western blotting (top). Keap1 quantities are shown at the bottom. *, P < 0.05; N.S, no significant difference. (C and D) HEK293 cells were first transfected with plasmids encoding myc-tagged Keap1 and then treated with MG132 (2.5 μM) (C) or 3-MA (1 mM) (D) for 1 h in the presence or absence of LPS (200 ng/ml) for an additional 12 h. Cell lysates were analyzed for exogenous Keap1 expression by Western blotting with an anti-myc antibody (top). Keap1 quantities are shown at the bottom. The experiments were repeated at least three times, and representative results are shown. *, P < 0.05; N.S, no significant difference. (E and F) RAW cells were treated with LPS (200 ng/ml) or CQ (25 μM), or both, for 12 h. Keap1 and LC3 were analyzed by Western blotting (E), and Keap1 levels were quantified (F). (G) RAW cells were treated with LPS (200 ng/ml) for various times, and LC3 was analyzed by Western blotting (left). The ratio of LC3-II to β-actin was calculated and plotted (right). *, P < 0.05 compared to the results for the control. (H) RAW cells were treated with various doses of LPS for 12 h, and LC3 was analyzed by Western blotting (left). The ratio of LC3-II to β-actin was calculated and plotted (right). *, P < 0.05 compared to the results for the control. (I) RAW cells were treated with LPS (200 ng/ml) for 12 h, and then LC3 and Keap1 proteins were examined by immunostaining. DAPI (4′,6-diamidino-2-phenylindole) stain was applied as a nuclear marker.
FIG 5
FIG 5
p62 mediates LPS-induced Keap1 degradation. (A) RAW cells were treated with LPS in the presence or absence of the PKC inhibitor staurosporine (stauros.; 15 nM) or LPS (200 ng/ml) for 16 h. Keap1 was assayed by Western blotting. (B and C) RAW cells were treated with different doses of LPS for 12 h (B) or with 200 ng/ml LPS for various times (C). p62 was assayed by Western blotting. (D) RAW cells were treated with LPS (200 ng/ml) for 3 h. The cell lysates were subjected to coimmunoprecipitation with anti-Keap1 or an isoform control antibody. The level of p62 was assayed by Western blotting. Nonimmunoprecipitated cell lysates were assayed for p62 and Keap1 as controls. IP, immunoprecipitation. (E) RAW cells were transfected with shRNA specific for p62 or a nonspecific control shRNA for 36 h and then treated with LPS (200 ng/ml) for 12 h. Keap1, p62, and HO-1 proteins were assayed by Western blotting (top). The results of quantification analysis are also shown (bottom). The experiments were repeated at least three times, and representative results are shown. *, P < 0.05; N.S, no significant difference. (F) Nrf2−/− and WT mice were treated with LPS (10 μg/kg of body weight) by injection for 24 h, and then Keap1 and p62 from mouse kidney were analyzed by Western blotting (top). C, control. The results of quantification analysis are also shown (bottom). The experiments were repeated at least three times, and representative results are shown. *, P < 0.05.
FIG 6
FIG 6
Arginines R380, R415, and R483 on Keap1 are crucial for LPS-induced Keap1 degradation. HEK293 cells were transfected with plasmids carrying myc-tagged wild-type Keap1 (K1-wt-myc) (A), the Keap1 N-terminal fragment from aa 1 to 314 (K1-N-myc) (B), the Keap1 C-terminal fragment from aa 314 to 624 (K1-C-myc) (C), or a mutant Keap1 in which the three arginines at positions 380, 415, and 483 were replaced with alanines (K1-mut-myc) (D). After transfection for 12 h, the cells were treated with 1 or 10 μg/ml LPS for an additional 12 h. The myc-tagged Keap1 proteins were assayed by Western blotting with an anti-Myc antibody (top). The results of quantification analysis are also shown (bottom). The experiments were repeated at least three times, and representative results are shown, *, P < 0.05; N.S, no significant difference. (E) Coimmunoprecipitation and Western blotting assays. HEK293 cells were transfected with a plasmid carrying K1-wt-myc, K1-N-myc, K1-C-myc, or K1-mut-myc. After 18 h, cells were treated with 1 μg/ml LPS for an additional 4 h. The cell lysates were precipitated with an anti-myc antibody, and immunoprecipitates were analyzed by Western blotting with an anti-p62 antibody. As loading and transfection controls, cell lysates were also analyzed by Western blotting with anti-p62 and anti-myc antibodies. The experiments were repeated at least three times, and representative results are shown.

Similar articles

Cited by

References

    1. Akira S. 2003. Toll-like receptor signaling. J Biol Chem 278:38105–38108. doi:10.1074/jbc.R300028200. - DOI - PubMed
    1. Sabroe I, Parker LC, Dower SK, Whyte MK. 2008. The role of TLR activation in inflammation. J Pathol 214:126–135. doi:10.1002/path.2264. - DOI - PubMed
    1. Kobayashi M, Yamamoto M. 2006. Nrf2-Keap1 regulation of cellular defense mechanisms against electrophiles and reactive oxygen species. Adv Enzyme Regul 46:113–140. doi:10.1016/j.advenzreg.2006.01.007. - DOI - PubMed
    1. Takaya K, Suzuki T, Motohashi H, Onodera K, Satomi S, Kensler TW, Yamamoto M. 2012. Validation of the multiple sensor mechanism of the Keap1-Nrf2 system. Free Radic Biol Med 53:817–827. doi:10.1016/j.freeradbiomed.2012.06.023. - DOI - PMC - PubMed
    1. Rangasamy T, Guo J, Mitzner WA, Roman J, Singh A, Fryer AD, Yamamoto M, Kensler TW, Tuder RM, Georas SN, Biswal S. 2005. Disruption of Nrf2 enhances susceptibility to severe airway inflammation and asthma in mice. J Exp Med 202:47–59. doi:10.1084/jem.20050538. - DOI - PMC - PubMed

Publication types

MeSH terms

LinkOut - more resources