

Epidermal Growth Factor Receptor (EGFR) Pathway Biomarkers in the Randomized Phase III Trial of Erlotinib Versus Observation in Ovarian Cancer Patients with No Evidence of Disease Progression after First-Line Platinum-Based Chemotherapy
- PMID: 26004768
- PMCID: PMC4661131
- DOI: 10.1007/s11523-015-0369-6
Epidermal Growth Factor Receptor (EGFR) Pathway Biomarkers in the Randomized Phase III Trial of Erlotinib Versus Observation in Ovarian Cancer Patients with No Evidence of Disease Progression after First-Line Platinum-Based Chemotherapy
Erratum in
-
Erratum to: Epidermal Growth Factor Receptor (EGFR) Pathway Biomarkers in the Randomized Phase III Trial of Erlotinib Versus Observation in Ovarian Cancer Patients with No Evidence of Disease Progression after First-Line Platinum-Based Chemotherapy.Target Oncol. 2016 Jun;11(3):429. doi: 10.1007/s11523-016-0433-x. Target Oncol. 2016. PMID: 27056749 No abstract available.
Abstract
Background: In this work, we aimed to identify molecular epidermal growth factor receptor (EGFR) tissue biomarkers in patients with ovarian cancer who were treated within the phase III randomized European Organisation for Research and Treatment of Cancer-Gynaecological Cancer Group (EORTC-GCG) 55041 study comparing erlotinib with observation in patients with no evidence of disease progression after first-line platinum-based chemotherapy.
Methods: Somatic mutations in KRAS, BRAF, NRAS, PIK3CA, EGFR, and PTEN were determined in 318 (38 %) and expression of EGFR, pAkt, pMAPK, E-cadherin and Vimentin, and EGFR and HER2 gene copy numbers in 218 (26 %) of a total of 835 randomized patients. Biomarker data were correlated with progression-free survival (PFS) and overall survival (OS).
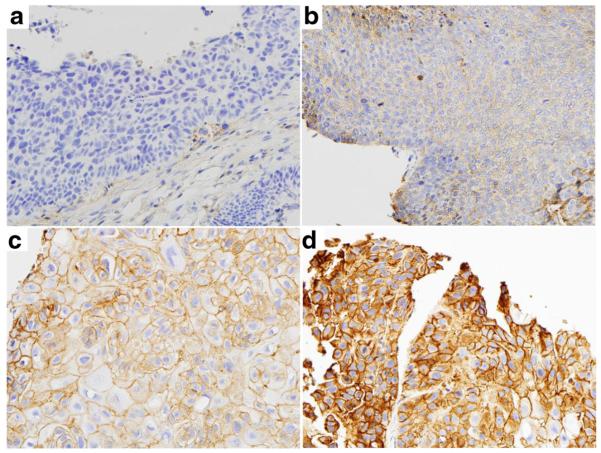
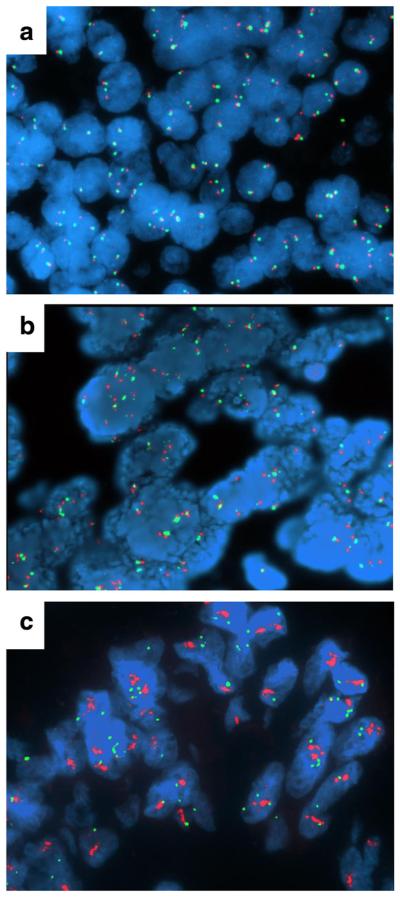
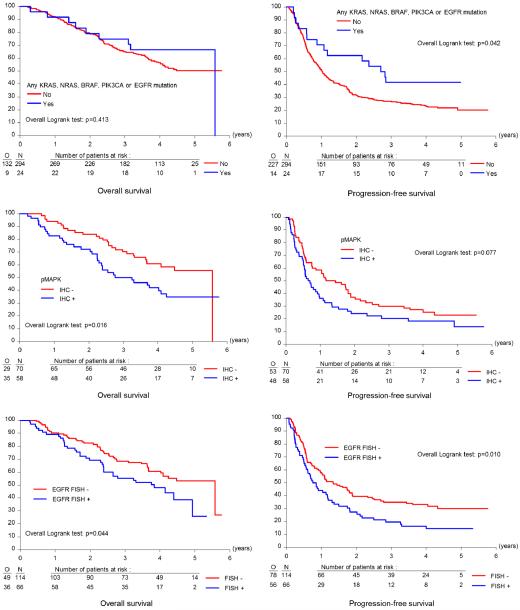
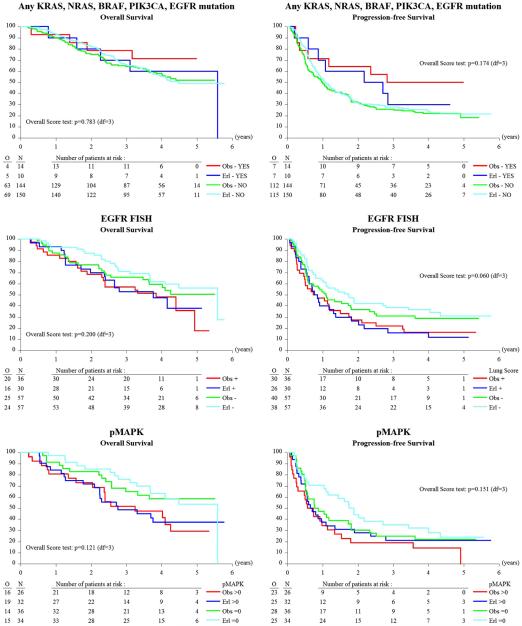
Results: Only 28 mutations were observed among KRAS, BRAF, NRAS, PIK3CA, EGFR, and PTEN (in 7.5 % of patients), of which the most frequent were in KRAS and PIK3CA. EGFR mutations occurred in only three patients. When all mutations were pooled, patients with at least one mutation in KRAS, NRAS, BRAF, PIK3CA, or EGFR had longer PFS (33.1 versus 12.3 months; HR 0.57; 95 % CI 0.33 to 0.99; P = 0.042) compared to those with wild-type tumors. EGFR overexpression was detected in 93 of 218 patients (42.7 %), and 66 of 180 patients (36.7 %) had EGFR gene amplification or high levels of copy number gain. Fifty-eight of 128 patients had positive pMAPK expression (45.3 %), which was associated with inferior OS (38.9 versus 67.0 months; HR 1.81; 95 % CI 1.11 to 2.97; P = 0.016). Patients with positive EGFR fluorescence in situ hybridization (FISH) status had worse OS (46.1 months) than those with negative status (67.0 months; HR 1.56; 95 % CI 1.01 to 2.40; P = 0.044) and shorter PFS (9.6 versus 16.1 months; HR 1.57; 95 % CI 1.11 to 2.22; P = 0.010). None of the investigated biomarkers correlated with responsiveness to erlotinib.
Conclusions: In this phase III study, increased EGFR gene copy number was associated with worse OS and PFS in patients with ovarian cancer. It remains to be determined whether this association is purely prognostic or is also predictive.
Figures
Similar articles
-
Prospective molecular marker analyses of EGFR and KRAS from a randomized, placebo-controlled study of erlotinib maintenance therapy in advanced non-small-cell lung cancer.J Clin Oncol. 2011 Nov 1;29(31):4113-20. doi: 10.1200/JCO.2010.31.8162. Epub 2011 Oct 3. J Clin Oncol. 2011. PMID: 21969500 Clinical Trial.
-
Epidermal growth factor receptor-related tumor markers and clinical outcomes with erlotinib in non-small cell lung cancer: an analysis of patients from german centers in the TRUST study.J Thorac Oncol. 2008 Dec;3(12):1446-53. doi: 10.1097/JTO.0b013e31818ddcaa. J Thorac Oncol. 2008. PMID: 19057271 Clinical Trial.
-
Biomarker analyses from a randomized, placebo-controlled, phase IIIb trial comparing bevacizumab with or without erlotinib as maintenance therapy for the treatment of advanced non-small-cell lung cancer (ATLAS).J Thorac Oncol. 2014 Sep;9(9):1411-7. doi: 10.1097/JTO.0000000000000274. J Thorac Oncol. 2014. PMID: 25122437 Clinical Trial.
-
The emerging role of epidermal growth factor receptor inhibitors in ovarian cancer.Int J Gynecol Cancer. 2008 Sep-Oct;18(5):879-90. doi: 10.1111/j.1525-1438.2007.01144.x. Epub 2007 Dec 5. Int J Gynecol Cancer. 2008. PMID: 18053062 Review.
-
Predictive and Prognostic Biomarkers for Patients Treated with Anti-EGFR Agents in Lung Cancer: A Systemic Review and Meta-Analysis.Asian Pac J Cancer Prev. 2015;16(11):4759-68. doi: 10.7314/apjcp.2015.16.11.4759. Asian Pac J Cancer Prev. 2015. PMID: 26107237 Review.
Cited by
-
Targeting receptor tyrosine kinases in ovarian cancer: Genomic dysregulation, clinical evaluation of inhibitors, and potential for combinatorial therapies.Mol Ther Oncolytics. 2023 Feb 19;28:293-306. doi: 10.1016/j.omto.2023.02.006. eCollection 2023 Mar 16. Mol Ther Oncolytics. 2023. PMID: 36911068 Free PMC article. Review.
-
Human epidermal growth factor receptor targeted inhibitors for the treatment of ovarian cancer.Cancer Biol Med. 2018 Nov;15(4):375-388. doi: 10.20892/j.issn.2095-3941.2018.0062. Cancer Biol Med. 2018. PMID: 30766749 Free PMC article.
-
Targeting Tyrosine Kinases in Ovarian Cancer: Small Molecule Inhibitor and Monoclonal Antibody, Where Are We Now?Biomedicines. 2022 Aug 29;10(9):2113. doi: 10.3390/biomedicines10092113. Biomedicines. 2022. PMID: 36140214 Free PMC article. Review.
-
Association of KRAS, NRAS, BRAF and PIK3CA gene mutations with clinicopathological features, prognosis and ring finger protein 215 expression in patients with colorectal cancer.Biomed Rep. 2023 Oct 31;19(6):104. doi: 10.3892/br.2023.1686. eCollection 2023 Dec. Biomed Rep. 2023. PMID: 38025833 Free PMC article.
-
Biological and clinical impact of membrane EGFR expression in a subgroup of OC patients from the phase IV ovarian cancer MITO-16A/MANGO-OV2A trial.J Exp Clin Cancer Res. 2023 Apr 11;42(1):83. doi: 10.1186/s13046-023-02651-y. J Exp Clin Cancer Res. 2023. PMID: 37041632 Free PMC article.
References
-
- Ciardiello F, Tortora G. EGFR antagonists in cancer treatment. N Engl J Med. 2008;358(11):1160–74. doi:10.1056/NEJMra0707704. - PubMed
-
- Yarden Y, Sliwkowski MX. Untangling the ErbB signalling network. Nat Rev Mol Cell Biol. 2001;2(2):127–37. - PubMed
-
- Skirnisdóttir I, Sorbe B, Seidal T. The growth factor receptors HER-2/neu and EGFR, their relationship, and their effects on the prognosis in early stage (FIGO I-II) epithelial ovarian carcinoma. Int J Gynecol Cancer. 2001;11(2):119–29. - PubMed
-
- Fischer-Colbrie J, Witt A, Heinzl H, Speiser P, Czerwenka K, Sevelda P, Zeillinger R. EGFR and steroid receptors in ovarian carcinoma: comparison with prognostic parameters and outcome of patients. Anticancer Res. 1997;17(1B):613–9. - PubMed
-
- Berchuck A, Rodriguez GC, Kamel A, Dodge RK, Soper JT, Clarke-Pearson DL, Bast RC., Jr Epidermal growth factor receptor expression in normal ovarian epithelium and ovarian cancer. I. Correlation of receptor expression with prognostic factors in patients with ovarian cancer. Am J Obstet Gynecol. 1991;164(2):669–74. - PubMed
Publication types
MeSH terms
Substances
Grants and funding
LinkOut - more resources
Full Text Sources
Other Literature Sources
Medical
Research Materials
Miscellaneous
