Droplet barcoding for single-cell transcriptomics applied to embryonic stem cells
- PMID: 26000487
- PMCID: PMC4441768
- DOI: 10.1016/j.cell.2015.04.044
Droplet barcoding for single-cell transcriptomics applied to embryonic stem cells
Abstract
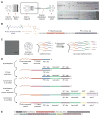
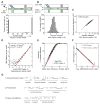
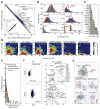
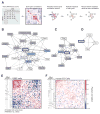
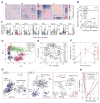
It has long been the dream of biologists to map gene expression at the single-cell level. With such data one might track heterogeneous cell sub-populations, and infer regulatory relationships between genes and pathways. Recently, RNA sequencing has achieved single-cell resolution. What is limiting is an effective way to routinely isolate and process large numbers of individual cells for quantitative in-depth sequencing. We have developed a high-throughput droplet-microfluidic approach for barcoding the RNA from thousands of individual cells for subsequent analysis by next-generation sequencing. The method shows a surprisingly low noise profile and is readily adaptable to other sequencing-based assays. We analyzed mouse embryonic stem cells, revealing in detail the population structure and the heterogeneous onset of differentiation after leukemia inhibitory factor (LIF) withdrawal. The reproducibility of these high-throughput single-cell data allowed us to deconstruct cell populations and infer gene expression relationships. VIDEO ABSTRACT.
Copyright © 2015 Elsevier Inc. All rights reserved.
Figures


Comment in
-
Single-cell transcriptomics enters the age of mass production.Mol Cell. 2015 May 21;58(4):563-4. doi: 10.1016/j.molcel.2015.05.019. Mol Cell. 2015. PMID: 26000840
-
GENE EXPRESSION. Single-cell variability guided by microRNAs.Science. 2016 Jun 17;352(6292):1390-1. doi: 10.1126/science.aag1097. Science. 2016. PMID: 27313022 No abstract available.
Similar articles
-
Single-cell transcriptomics enters the age of mass production.Mol Cell. 2015 May 21;58(4):563-4. doi: 10.1016/j.molcel.2015.05.019. Mol Cell. 2015. PMID: 26000840
-
BGP: identifying gene-specific branching dynamics from single-cell data with a branching Gaussian process.Genome Biol. 2018 May 29;19(1):65. doi: 10.1186/s13059-018-1440-2. Genome Biol. 2018. PMID: 29843817 Free PMC article.
-
Comparative Analysis of Droplet-Based Ultra-High-Throughput Single-Cell RNA-Seq Systems.Mol Cell. 2019 Jan 3;73(1):130-142.e5. doi: 10.1016/j.molcel.2018.10.020. Epub 2018 Nov 21. Mol Cell. 2019. PMID: 30472192
-
Single-cell sequencing of miRNAs: A modified technology.Cell Biol Int. 2020 Sep;44(9):1773-1780. doi: 10.1002/cbin.11376. Epub 2020 May 18. Cell Biol Int. 2020. PMID: 32379363 Review.
-
Single-cell RNA-seq: advances and future challenges.Nucleic Acids Res. 2014 Aug;42(14):8845-60. doi: 10.1093/nar/gku555. Epub 2014 Jul 22. Nucleic Acids Res. 2014. PMID: 25053837 Free PMC article. Review.
Cited by
-
Interplay between materials and microfluidics.Nat Rev Mater. 2017 May;2(5):17016. doi: 10.1038/natrevmats.2017.16. Epub 2017 Apr 20. Nat Rev Mater. 2017. PMID: 38993477 Free PMC article.
-
Image-Based Feedback of Multi-Component Microdroplets for Ultra-Monodispersed Library Preparation.Micromachines (Basel). 2023 Dec 22;15(1):27. doi: 10.3390/mi15010027. Micromachines (Basel). 2023. PMID: 38258146 Free PMC article.
-
Inhibitory Mechanism of Trichoderma virens ZT05 on Rhizoctonia solani.Plants (Basel). 2020 Jul 19;9(7):912. doi: 10.3390/plants9070912. Plants (Basel). 2020. PMID: 32707691 Free PMC article.
-
Asymmetric Cell Division of Fibroblasts is An Early Deterministic Step to Generate Elite Cells during Cell Reprogramming.Adv Sci (Weinh). 2021 Feb 25;8(7):2003516. doi: 10.1002/advs.202003516. eCollection 2021 Apr. Adv Sci (Weinh). 2021. PMID: 33854891 Free PMC article.
-
Defining the Emerging Blood System During Development at Single-Cell Resolution.Front Cell Dev Biol. 2021 May 12;9:660350. doi: 10.3389/fcell.2021.660350. eCollection 2021. Front Cell Dev Biol. 2021. PMID: 34055791 Free PMC article. Review.
References
-
- Abate AR, Chen CH, Agresti JJ, Weitz DA. Beating Poisson encapsulation statistics using close-packed ordering. Lab on a chip. 2009;9:2628–2631. - PubMed
-
- Baker SC, Bauer SR, Beyer RP, Brenton JD, Bromley B, Burrill J, Causton H, Conley MP, Elespuru R, Fero M, et al. The External RNA Controls Consortium: a progress report. Nature methods. 2005;2:731–734. - PubMed
-
- Baret JC, Miller OJ, Taly V, Ryckelynck M, El-Harrak A, Frenz L, Rick C, Samuels ML, Hutchison JB, Agresti JJ, et al. Fluorescence-activated droplet sorting (FADS): efficient microfluidic cell sorting based on enzymatic activity. Lab on a chip. 2009;9:1850–1858. - PubMed
Publication types
MeSH terms
Associated data
- Actions
Grants and funding
LinkOut - more resources
Full Text Sources
Other Literature Sources
Molecular Biology Databases

