Review
. 2015 Apr 27;5(8):863-81.
doi: 10.7150/thno.11852. eCollection 2015.

Cell or cell membrane-based drug delivery systems

Affiliations
Review

Cell or cell membrane-based drug delivery systems

Songwei Tan et al. Theranostics. .

Abstract

Natural cells have been explored as drug carriers for a long period. They have received growing interest as a promising drug delivery system (DDS) until recently along with the development of biology and medical science. The synthetic materials, either organic or inorganic, are found to be with more or less immunogenicity and/or toxicity. The cells and extracellular vesicles (EVs), are endogenous and thought to be much safer and friendlier. Furthermore, in view of their host attributes, they may achieve different biological effects and/or targeting specificity, which can meet the needs of personalized medicine as the next generation of DDS. In this review, we summarized the recent progress in cell or cell membrane-based DDS and their fabrication processes, unique properties and applications, including the whole cells, EVs and cell membrane coated nanoparticles. We expect the continuing development of this cell or cell membrane-based DDS will promote their clinic applications.

Keywords: cell membrane; drug delivery system; extracellular vesicle; nanoparticle; tumor.


Conflict of interest statement

Competing Interests: The authors have declared that no competing interest exists.

Figures

Figure 1
Figure 1
Schematic illustration of drug loading methods for RBC. (a) electroporation, (b) osmosis-based methods, (c) co-incubation, (d) bio-bridge methods and (e) CPP-mediation method.
Figure 2
Figure 2
Schematic of the fabrication and controlled release of carrier RBCs: (1) encapsulation: two molecules (Rh-dextran (in red) and 5(6)-CF (in green)) are simultaneously encapsulated. Red, green, and overlay fluorescence channels are shown in the schematics; (2) adsorption of nanoparticle aggregates onto the surface of loaded RBCs (cuvettes demonstrating the behavior of Au NPs in water (right) and after transfer in PBS (left)); and (3) release of both molecules by a near-IR laser. Reproduced with permission. Copyright 2014, ACS.
Figure 3
Figure 3
RBC-bound allophycocyanin uptake by splenic DC subsets and nonprofessional APCs in the liver. (a) Increased cellular uptake of ERY1-allophycocyanin by MHC II+ CD11b- CD11c+ and MHC II+ CD8α+ CD11c+ CD205+ splenic DCs at 12 and 36 h postinjection, compared with MIS-allophycocyanin. (b) Increased cellular uptake of ERY1-allophycocyanin in the liver by hepatocytes (CD45- MHC IIlow CD1d-) and hepatic stellate cells (CD45- MHC II+ CD1d+) but not by liver DCs (CD45+ CD11c+) or Kupffer cells (CD45+ MHC II+ F4/80+), compared with MIS-allophycocyanin, 36 h following i.v. administration (n = 2). *P ≤ 0.05; **P ≤ 0.01; ***P ≤ 0.001. Data represent mean ± SE. (c) Spleen microscopy images of mice 24 h following administration of 10 μg OVA(Left) or ERY1-OVA(Right), stained for OVA (green), F4/80 (red), and DAPI nuclear staining (blue). (Scale bar = 50 μm.) (d) Liver microscopy images of mice 24 h following administration of 10 μg OVA (Left) or ERY1-OVA (Right), stained for MHC I H-2Kb-SIINFEKL (green), CD45 (red), and DAPI for nuclear staining (blue). (Scale bar = 50 μm.) Reproduced with permission. Copyright 2014, ACS.
Figure 4
Figure 4
Neural stem cell-mediated intratumoral delivery of AuNRs. (a) Schematic depicting AuNR uptake by NSCs. (b-g) Comparison of free AuNR and NSC.AuNR distribution after intratumoral injection. Three days after AuNR injection, tumors were sectioned. Every 150 μm, sections were imaged using dark-field microscopy. (b, c) Tiled, flattened, dark-field micrographs of entire cross sections of tumors injected with free AuNRs (d) or NSC.AuNRs (e). AuNRs are visible as dense, bright gold signals. (c, d) Mapped cross sections of tumors injected with free AuNRs (d) or NSC.AuNRs (e). (f, g) 3D projection of all mapped AuNR (red) and tumor (blue) traces generated using Reconstruct software in tumors that received free AuNR (f) or NSC.AuNR (g). Scale bar = 1 mm and applies to all images. Reproduced with permission. Copyright 2014, ACS.
Figure 5
Figure 5
Fabrication and characterization of shedding vesicles and exosomes. (a) Intracellular origin of EVs. Shedding vesicles derive directly from the cell membrane. Exosomes originate from the cell membrane through the endosomal pathway and form via inward budding of the limiting membrane of the multivesicular body, a late endosomal compartment. Exosomes are secreted via fusion of multivesicular bodies with the plasma membrane. (b) TEM imaging, (c) purification procedure and (d) membrane protein analysis of exosomes. Reproduced and modified with permission, , . Copyright 2014, Elsevier, Nature.
Figure 6
Figure 6
Tumor cell-derived MPs for anti-cancer drug delivery. (a) TEM image of MPs. (b) Tumor cells treated with chemotherapeutic drugs released drug-packaging MPs. H22 cells or A2780 cells were incubated with 100 μg/mL doxorubicin and irradiated with UBV. MPs were isolated and observed under two-photon laser scanning fluorescence microscope. DOX was shown as the red color. (c) Cisplatin-packaging MPs inhibited ovarian cancer growth in SCID mice. Survival observation A2780 cells were i.p. injected to SCID mice (n=6 per group). From the next day, mouse was administered with MPs or with single cisplatin (2 μg/g) or PBS by i.p. injection once per day for continuous 5 days. Reproduced with permission. Copyright 2014, Nature.
Figure 7
Figure 7
MSC NGs can specifically target tumor. (a) Representative Cryo-TEM images (n > 3) of hMSC-NGs (b) Binding of NGs (white arrows) to PC3 cells (NGs, red (DiI); cell, green (GFP); nucleolus, blue (DAPI)) evaluated using confocal microscopy. (c) In vivo prostate tumor targeting, and biodistribution of hMSC-NGs. Harvested tumors were dissociated into single cells and analyzed by flow cytometry for human CD90 as an indicator of NG fusion. Positive expression is calculated in the designated markers normalized to the untreated control group (black curves) based on the test events following ip (blue curves) or iv (purple curves) administration. Reproduced with permission. Copyright 2014, ACS.
Figure 8
Figure 8
DC-mvB16/LLC vaccine induced strong lymphocytotoxicity against both B16 and LLC tumor. (a) Schematic diagram of methods used to generate DC-mvB16/LLC dual vaccine and assess anti-tumor effect. Tumor sizes of (b) B16 or (c) LLC at day 30 after tumor cell challenge. Mice were vaccinated twice at week intervals. Mice were then injected with tumor cells 7 days after the last vaccination. Tumor volume was determined at the end of the study (day 30). Significant difference vs. saline group (**p<0.05). Significant difference vs. DC-mvblank group (++p<0.05). Significant difference vs. DC-mvB16 group (##p<0.05). Reproduced with permission. Copyright 2014, Elsevier.
Figure 9
Figure 9
Targeting peptide expressed with Lamp2b was expressed on the external surface of exosomes. (a) Schematic representation of production, harvest and re-administration of targeted self-exosomes for gene delivery. (b) Size distribution of RVG exosomes as measured by NTA peaking at 88 nm diameter. (c) Electron micrograph of phosphotungstic acid stained RVG exosomes. Reproduced with permission. Copyright 2014, Nature.
Figure 10
Figure 10
Generation of exosome-mimetic nanovesicles (NV) in different ways (a) Schematic illustration of the procedure for the generation of chemotherapeutics-loaded NV. (b) Schematic illustration of microfluidic fabrication of NV. (c) Sectional view of centrifuge device and schematic process of NV generation. Reproduced with permission-. Copyright 2014, ACS, RSC.
Figure 11
Figure 11
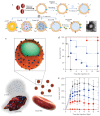
RBCm-cloaking NPs systems. (a) Fabricating illustration and model structure of RBCm-cloaking NPs: RBCm-cloaking Au NPs, DOX-loaded RBCm-cloaking PLA NPs, Van-loaded RBCm-cloaking gelatin NPs, RBCm-cloaking PLGA NPs, Targeting RBCm-cloaking PLGA NPs and toxin-detainment RBCm-cloaking PLGA NPs. (b) TEM image of folic acid modified RBCm-cloaking PLGA NPs (unpublished data). (c) Schematic structure of toxin nanosponges and their mechanism of neutralizing PFTs. The nanosponges consist of substrate-supported RBC bilayer membranes into which PFTs can incorporate. After being absorbed and arrested by the nanosponges, the PFTs are diverted away from their cellular targets, thereby avoiding target cells and preventing toxin-mediated haemolysis. (d) Survival rates of mice over a 15-day period following intravenous injections of 120 μg/kg Hla on day 21 via the tail vein (n=10). Unvaccinated mice were used as negative control and mice vaccinated with heat-treated Hla served as positive controls. Both the prime-only schedule and prime-boost schedule were conducted. (e) Comparison of skin lesion size following subcutaneous injections of 5 μg of Hla on day 21. Lesion size was measured for 14 days following the challenge (n=6). (Unvaccinated mice (black triangles, solid line) and mice vaccinated with heattreated Hla (prime; blue squares, dashed line), nanotoxoid(Hla) (prime; blue circles, solid line), heat-treated Hla (prime+boost; red squares, dashed line) or nanotoxoid(Hla) (prime+boost; red circle, solid line) received intravenous or subcutaneous administration of Hla.) Reproduced with permission, . Copyright 2014, Nature.
Figure 12
Figure 12
Leukocyte-like vectors. (a). SEM images of bare NPS, leukocyte (LC) and an NPS camouflaged with leukocyte-derived membranes LLV, Scale bar 1μm. (b) After treatment with NPS and LLV (particles, yellow), ICAM-1 clusters (green, arrows) on the surface of TNF-α stimulated HUVEC cells only in proximity to the LLV. Scale bars, 15 mm. High-magnification images and colorimetric analysis of receptor clustering is shown to the right (particle size, 3 mm). (c) Schematic of a transwell chamber for assaying transport across an endothelial monolayer. Particles were counted in the upper chamber (1, supernatant), endothelial layer (2, intracellular) and lower chamber (3, filtered). (d) Studies of HUVEC (endothelial) and MDA-MB-231 (cancer) cell viability in a transwell system. LLV-loaded doxorubicin (DOX LLV) showed enhanced tumor cell killing and decreased endothelial cell death following 48 h incubation compared with free doxorubicin (free DOX) and NPS-loaded doxorubicin (DOX NPS). Error bars represent standard deviation. *P<0.05. Reproduced with permission. Copyright 2014, Nature.

Similar articles

Cited by

References

    1. Chertok B, Webber MJ, Succi MD. et al. Drug delivery interfaces in the 21st century: From science fiction ideas to viable technologies. Mol Pharm. 2013;10:3531–43. - PMC - PubMed
    1. Hubbell JA, Langer R. Translating materials design to the clinic. Nat Mater. 2013;12:963–6. - PubMed
    1. Hu C-MJ, Fang RH, Luk BT. et al. Polymeric nanotherapeutics: clinical development and advances in stealth functionalization strategies. Nanoscale. 2013;6:65–75. - PubMed
    1. Wicki A, Witzigmann D, Balasubramanian V. et al. Nanomedicine in cancer therapy: Challenges, opportunities, and clinical applications. J Control Release. 2015;200:138–157. - PubMed
    1. Tan SW, Li X, Guo Y. et al. Lipid-enveloped hybrid nanoparticles for drug delivery. Nanoscale. 2013;5:860–72. - PubMed

Publication types