. 2015 May 20;10(5):e0124650.
doi: 10.1371/journal.pone.0124650. eCollection 2015.

Fluorescent-protein stabilization and high-resolution imaging of cleared, intact mouse brains

Affiliations

Fluorescent-protein stabilization and high-resolution imaging of cleared, intact mouse brains

Martin K Schwarz et al. PLoS One. .

Abstract

In order to observe and quantify long-range neuronal connections in intact mouse brain by light microscopy, it is first necessary to clear the brain, thus suppressing refractive-index variations. Here we describe a method that clears the brain and preserves the signal from proteinaceous fluorophores using a pH-adjusted non-aqueous index-matching medium. Successful clearing is enabled through the use of either 1-propanol or tert-butanol during dehydration whilst maintaining a basic pH. We show that high-resolution fluorescence imaging of entire, structurally intact juvenile and adult mouse brains is possible at subcellular resolution, even following many months in clearing solution. We also show that axonal long-range projections that are EGFP-labelled by modified Rabies virus can be imaged throughout the brain using a purpose-built light-sheet fluorescence microscope. To demonstrate the viability of the technique, we determined a detailed map of the monosynaptic projections onto a target cell population in the lateral entorhinal cortex. This example demonstrates that our method permits the quantification of whole-brain connectivity patterns at the subcellular level in the uncut brain.


Conflict of interest statement

Competing Interests: The authors have declared that no competing interests exist.

Figures

Fig 1
Fig 1. Changes in EGFP fluorescence in E.coli during dehydration and clearing.
(A) Fluorescence of fixed, EGFP-expressing E. coli cells during dehydration and clearing. Dehydration steps: 2.5 h each (80%: 16 hours); clearing steps as indicated, all steps at RT, pH unadjusted. (B) Fluorescence of fixed, EGFP-expressing E. coli cells after dehydration in pH-adjusted alcohol solutions as indicated, followed by 5 d clearing at the respective pH (all steps at RT, data from different experiment). (C) LSFM recording (sagittal optical slice) of olfactory bulb EGFP fluorescence of a brain from a two weeks old transgenic Tg CamKII-EGFP mouse. After fixation, the two hemispheres of the brain were separated. One hemisphere was dehydrated and cleared according to Dodt et al. (“E-BABB”, left) [4], the other hemisphere using 1-propanol for dehydration and BABB for clearing, all steps at pH 9.5 (“1P-BABB”, right). For both samples, dehydration steps were 8h and 16h alternating; clearing step: 7 hours; all steps at RT. The brightness and contrast settings were set to two different linear ranges (indicated on the left) which were chosen to show the 1P-BABB sample intensity range (upper panels) and the E-BABB sample intensity range (lower panels). gl, glomerular layer; aob, accessory olfactory bulb. Scale bar, 1mm. (D) Fluorescence of fixed, EGFP-expressing E. coli cells after dehydration with 1-propanol, or tert-butanol, and additional five days in clearing solution, all steps at the indicated temperatures, all solutions at pH 9.5.
Fig 2
Fig 2. Clearing of brains using different alcohols and clearing solutions / pH adjustments.
(A) Transmitted light images of whole mouse brains (age: P44) dehydrated with different alcohols as indicated (EtOH: pH unadjusted; other alcohols: pH adjusted to 9.5) and incubated in BABB clearing solution at the respective pH for 150 days (all incubations at RT). Brains were either placed on top of a transparent ruler (big panels; small ticks, 1 mm), or on the top of a 1951 USAF light-transmissive target (inserts; Scale bar, 1 mm). (B) Transmitted light images of forebrains and cerebella of adult mouse brains at different ages (P44, P250 and P673) dehydrated with tert-butanol (pH 9.5) and cleared with BABB pH 9.5 for 3 d; all incubations at RT (upper row) or 30°C (bottom row). P44 brains were recorded after additional 100 d storage at 4°C. The ages of the mice analyzed are indicated on the top of the image.
Fig 3
Fig 3. Light-sheet microscope (LSFM) setup and shadow suppression.
(A) Beam path for light sheet-generation / fluorescence excitation (blue: left panels, top views) and for fluorescence excitation (blue) and detection (green) (right panel, side view). Scanner 1 generates the light sheet, while scanner 2 controls the illumination angle rotation. During recording, both scanners are active simultaneously. (B, C) Suppression of shadow stripes by scanner 2. Single xy-plane Venus FP fluorescence images from a fluorescent mouse brain prepared from a Tg Y5RitTA⁄Y1RVenus [39] mouse at P13, cleared with the 1P-BABB method and recorded with our LSFM (excitation. 514 nm; emission, bandpass 520–550 nm) demonstrate the effect of scanner 2 that rotates the light sheet (for technical details, see Fig 3A). (B) scanner 1 ON, scanner 2 OFF; (C) both scanners ON. Illumination from lateral side of left hemisphere (from top of panels), imaging from dorsal (from viewer’s direction). Scale bar, 1 mm.
Fig 4
Fig 4. Long term preservation of fluorescence and sample geometry.
Light sheet microscope horizontal recordings of green fluorescence (RABVΔG-EGFP) from a p70 mouse brain were taken at day 32 and day 264, respectively, after the onset of clearing. Corresponding subvolumes of the entorhinal cortex / hippocampus region were selected with ImageJ and upscaled to a cubic voxelsize of 1.61 microns with AMIRA software. The day 264 dataset was 3D aligned to the day 32 dataset by affine transformation with AMIRA (Lanczos interpolation). Since the day 32 dataset images had been recorded at three times the excitation power (4.65 microjoule per mm light sheet width) compared with the day 264 dataset images (1.55 microjoule per mm light sheet width), we accounted for this difference by adjusting the image display range with ImageJ accordingly (Set Display Range (32d): 70–1269; (264d): 63–462; with the lower value of each range representing the image background outside the brain tissue signal area). All other recording and image analysis parameters were maintained. Image shows overlapping z maximum projections (50 microns z projection size) of day 32 (A), day 264 (B) and an overlay of day 32 (red) and day 264 (green) EGFP fluorescence (C). Bar, 100 microns.
Fig 5
Fig 5. Visualization of neurons monosynaptically connected to RABVΔG-EGFP(EnvA) infected neurons in EC.
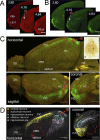
The fixed brain was cleared with tB-BABB/30°C for 64d. Red fluorescence (rAAV- mRFP1-IRES-TVA) and green fluorescence (RABVΔG-EGFP) were recorded with the LSFM(xy pixel size, 1.61 μm; z-step size, 3.23 μm). Maximum projections were generated after correction for tissue-generated signal attenuation. (A, B) Maximum projections (50 μm) from coronal re-slices of the horizontal recording of red fluorescence (A, rAAV- mRFP1-IRES-TVA) and green fluorescence (B, RABVΔG-EGFP). The precise position of each projection is given as distance to bregma according to [44]. Injection site and direction are indicated by a white arrow. Prh, Perirhinal Cortex; LEnt, Lateral Entorhinal Cortex; MEnt, Medial Entorhinal Cortex; IS, injection site. Scale bar, 0.5 mm. (C) Red/green overlays of maximum intensity projections generated from z stacks of stitched xy horizontal mosaic planes (top), and from sagittal (bottom left) and coronal re-slices (bottom right) of these z stacks. Bright green structures show RABVΔG-EGFP-positive cells. The red circle and the red arrow indicate the positions of the dorsoventral virus injection channel in horizontal and sagittal views, respectively. The transmission image of the whole cleared brain located on top of a translucent USAF 1951 resolution target is shown in the upper right corner. Scale bars, 0.5 mm. (D) Maximum projections (left, horizontal; right, coronal) of a KNOSSOS 3D skeleton dataset generated from the green channel dataset. Each dot indicates the position of an EGFP-labeled, manually marked cell. Color coding: grey, cells in injection region (EC area); marked cells located outside the injection area are color coded as indicated. Respective greyscale maximum projections of the green channel fluorescence were overlaid to depict tissue location. OB, Olfactory bulb; DBB, Diagonal Band of Broca; PiC, Piriform Cortex; SS, Somatosensory Cortex; HC, Hippocampus; EC, Entorhinal Cortex; IS, injection site. Scale bars, 0.5 mm.
Fig 6
Fig 6. Visualization of cell bodies and neurites in a tB-BABB cleared mouse brain.
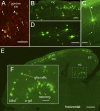
Brain sample same as Fig 4; original dataset (LSFM recording, horizontal): same as Fig 4, except for (A). (A) Confocal recording (single plane) from EC layer 3 near the injection site taken after 271 days in clearing solution. Overlay of red channel (rAAV-driven mRFP1 fluorescence, arrows) and green channel (RABVΔG-EGFP fluorescence). Double-infected cells expressing rAAV-driven mRFP1 plus RABVΔG-EGFP fluorescence are indicated by orange to green color (arrowheads). Recording direction: from brain surface (positioned perpendicular to optical axis) to interior. Scale bar, 100 μm. (B) LSFM 50 μm z range maximum projection from a subvolume of the PiC area (RABVΔG-EGFP fluorescence). Arrowheads indicate some Layer 2 neurons, arrows some interneurons. Scale bar, 100 μm. (C) LSFM 50 μm z range maximum z projection from a subvolume of the auditory cortex region (RABVΔG-EGFP fluorescence) showing a cortical layer 5 cell with a big apical dendrite (arrowheads), basal dendrites at the soma, and a basal axon (long arrows). Scale bar, 100 μm. (D) LSFM 90 μm z range maximum projection from a subvolume of the septal area (RABVΔG-EGFP fluorescence) 2.3 mm below brain surface revealing neurite structures (arrowheads). Scale bar, 100 μm. (E) LSFM 20 μm z range maximum projection (RABVΔG-EGFP fluorescence) from a subvolume of the PiC/EC/HC region, showing neurons from cortical EC and the PiC regions and glia from the HC region projecting to the injected EC neurons. Scale bar, 500 μm. (F) Hippocampal DG area enlarged from (E), showing glia cells in the outer granule cell layer (o-gcl) and stratum lacunosum moleculare (LMol), and neurons in the DG hilus region (arrowheads). PiC, Piriform cortex; EC, Entorhinal cortex. Scale bar, 100 μm.
Fig 7
Fig 7. Neuronal cells and neurites in the ipsilateral injected EC/hippocampal area.
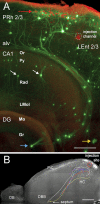
Brain sample same as Fig 4; original dataset (LSFM recording, horizontal): same as Fig 4. (A) Green/red overlay of LSFM 50 μm z range maximum projections from a subvolume of the EC/HC area. Green channel: RABVΔG-EGFP fluorescence revealing different cell types with dendrites and axon bundles. Red channel, rAAV-labeled cells (red arrow) below the brain periphery, which shows red autofluorescence. Dotted circle encloses the red fluorescence of the injection channel, which runs almost perpendicular to the image plane. White arrows, interneurons; blue arrow, granule cell; yellow arrow, glia cell. PRh 2/3, layers 2/3 of perirhinal cortex; alv, alveus of the hippocampus; CA1, Ammons Horn field CA1; Or, oriens layer; Py, pyramidal cell layer; Rad, radiatum layer; LMol, lacunosum moleculare; DG, dentate gyrus; Mo, molecular layer, Gr, granular layer; LEnt 2/3, layers 2/3 of lateral entorhinal cortex. Colors representing fluorescence signals were partially desaturated with Adobe Photoshop. Scale bar, 200 μm. (B) Long-range axonal projections traced in 3D with KNOSSOS and overlaid onto a green channel maximum z projection rendered as greyscale (cf. Fig 4C, top panel). Colored axon trajectories were generated with Amira from 3D KNOSSOS datasets. Arrow points to septum. Scale bar, 1 mm.

Similar articles

Cited by

References

    1. Spalteholz W (1914) Über das Durchsichtigmachen von menschlichen und tierischen Präparaten und seine theoretischen Bedingungen Leipzig: S. Hierzel. 1 v. p.
    1. Dent JA, Polson AG, Klymkowsky MW (1989) A whole-mount immunocytochemical analysis of the expression of the intermediate filament protein vimentin in Xenopus. Development 105: 61–74. - PubMed
    1. Voie AH, Burns DH, Spelman FA (1993) Orthogonal-Plane Fluorescence Optical Sectioning—3-Dimensional Imaging of Macroscopic Biological Specimens. Journal of Microscopy-Oxford 170: 229–236. - PubMed
    1. Dodt HU, Leischner U, Schierloh A, Jahrling N, Mauch CP, Deininger K, et al. (2007) Ultramicroscopy: three-dimensional visualization of neuronal networks in the whole mouse brain. Nat Methods 4: 331–336. - PubMed
    1. Erturk A, Mauch CP, Hellal F, Forstner F, Keck T, Becker K, et al. (2011) Three-dimensional imaging of the unsectioned adult spinal cord to assess axon regeneration and glial responses after injury. Nat Med 18: 166–171. 10.1038/nm.2600 - DOI - PubMed

Publication types

Grants and funding

This work was supported by Grants SCH 15578/1-1 and SFB 1089 (P02) by Deutsche Forschungsgemeinschaft (www.dfg.de) to MKS and by general funding by the Max-Plank Society, Germany (www.mpg.de) to GG, AS, MKS, and RS. The funders had no role in study design, data collection and analysis, decision to publish, or preparation of the manuscript.