. 2016 Mar 3;35(9):1111-21.
doi: 10.1038/onc.2015.164. Epub 2015 May 18.

IMP3 promotes stem-like properties in triple-negative breast cancer by regulating SLUG

Affiliations

IMP3 promotes stem-like properties in triple-negative breast cancer by regulating SLUG

S Samanta et al. Oncogene. .

Abstract

IMP3 (insulin-like growth factor-2 mRNA binding protein 3) is an oncofetal protein whose expression is prognostic for poor outcome in several cancers. Although IMP3 is expressed preferentially in triple-negative breast cancer (TNBC), its function is poorly understood. We observed that IMP3 expression is significantly higher in tumor initiating than in non-tumor initiating breast cancer cells and we demonstrate that IMP3 contributes to self-renewal and tumor initiation, properties associated with cancer stem cells (CSCs). The mechanism by which IMP3 contributes to this phenotype involves its ability to induce the stem cell factor SOX2. IMP3 does not interact with SOX2 mRNA significantly or regulate SOX2 expression directly. We discovered that IMP3 binds avidly to SNAI2 (SLUG) mRNA and regulates its expression by binding to the 5' UTR. This finding is significant because SLUG has been implicated in breast CSCs and TNBC. Moreover, we show that SOX2 is a transcriptional target of SLUG. These data establish a novel mechanism of breast tumor initiation involving IMP3 and they provide a rationale for its association with aggressive disease and poor outcome.


Conflict of interest statement

Conflicts of Interest: DLG and LDS are consultants for Viacord, Inc. The other authors declare that they have no conflict of interest.

Figures

Figure 1
Figure 1
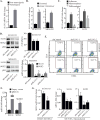
IMP3 expression is elevated in breast CSCs. (A) Expression of IMP1, IMP2 and IMP3 was analyzed in the CD44+CD24ESA+ and bulk populations of breast tumor cells using a published database (GEO accession no. GSE6883). Gene expression was analyzed in GEO2R. (B) IMP3 expression was depleted using shRNAs (shIMP3-1 and shIMP3-2) in SUM1315 and MDA435 cells and analyzed for CD44+CD24ESA+ population by FACS. Immunoblots show IMP3 protein expression. shGFP infected cells were used as control (shControl). FACS profiles represent CD44+ESA+ population which were preselected for CD24. See Fig. S1A. (C) Total RNA was extracted from SUM1315 cells grown as either adherent cultures or mammospheres and expression of the genes indicated in the figures was quantified by qPCR. Glyceraldehyde 3-phosphate dehydrogenase (GAPDH) was used as reference gene. (D) Flow cytometric analysis of CD44+CD24ESA+ population in SUM1315 cells grown as adherent culture or mammospheres. Immonoblot shows IMP3 protein expression in SUM1315 cells grown as mammospheres. (E) Total RNA was isolated from SUM159 and T47D cells grown as either adherent cultures, mammospheres or differentiated mammospheres induced by collagen-1, and assayed for IMP3 expression by qPCR. (F) Control or IMP3-depleted SUM1315 cells were labelled with PKH26 dye and quantified for PKH26+ cells by FACS after 3 weeks of culture. 7-AAD was used to discriminate dead cells. p value (*) < 0.05.
Figure 2
Figure 2
IMP3 regulates self-renewal and tumor initiation. (A) Control and IMP3-depleted SUM1315 cells were grown as mammospheres for 7 days and quantified. (B) IMP3-depleted SUM1315 cells (SUM1315-shIMP3-1) were transfected with constructs expressing either wild type (IMP3-wt) or a mutated IMP3 (shIMP3-1 resistant) and evaluated for mammosphere formation. (C) IMP3 expression was depleted in CD44+CD24ESA+ population isolated from SUM1315 cells, grown as mammospheres for 7 days and quantified. (D) SUM1315 cells were grown as mammospheres (P1), quantified and serially passaged (P2, P3 & P4) every 7 days. (E) Control, IMP3-depleted SUM1315 cells (left panel, 7 mice per group) or IMP3-depleted cells expressing either mutant IMP3 (pIMP3) or empty vector (control) (right panel, 6 mice per group) were transplanted into the mammary fat pads of NSG mice. Formation of palpable tumors was used to evaluate tumor initiation. The curve comparison was done using Log-rank test. (F) Total RNA and protein extracts were prepared from the epithelial or mesenchymal population of CD44+CD24 cells isolated from SRC-transformed MCF10A cells and the expression of IMP1, IMP2 and IMP3 was quantified by qPCR (left) and immunoblotting (right). (G) IMP3 expression was depleted in mesenchymal cells using shRNAs (immunoblot, left), grown as mammospheres, serially passaged every 7 days and quantified (right). p value (*) < 0.05.
Figure 3
Figure 3
IMP3 regulation of SOX2 underlies its contribution to mammosphere formation. (A) SOX2 mRNA was quantified by qPCR using total RNA isolated from CD44+CD24ESA+ population sorted from SUM1315 (left), MDA435 (middle) and the mesenchymal population of SRC-transformed MCF10A cells (right). (B) Total RNA was isolated from SUM159 and T47Dcells grown as either adherent cultures, mammospheres or differentiated mammospheres induced by collagen-1, and assayed for SOX2 expression by qPCR. (C) Nuclear and cytoplasmic extracts were prepared from IMP3-depleted or control SUM1315 and MDA435 cells, and SOX2 expression was assessed by immunoblotting and qPCR. (D) IMP3 expression was depleted in the CD44+CD24ESA+ population sorted from SUM1315 cells and the mesenchymal population of SRC-transformed MCF10A cells, and SOX2 mRNA was quantified by qPCR. (E) IMP3 and SOX2 expression was quantified by qPCR in SKBR3 cells transiently transfected with an empty vector or IMP3 expression construct (pIMP3). (F) SOX2 expression was rescued in IMP3-depleted SUM1315 cells (shIMP3-1 & shIMP3-2) using a lentivirus- based expression construct (pSOX2, left). These IMP3-depleted and SOX2 rescued cells were grown as mammospheres for 7 days and quantified (right). (G) SOX2 expression was depleted in SUM1315 cells using shRNAs (shSOX2-1 & shSOX2-2, left) and these cells were evaluated for mammosphere formation in comparison to control cells (right). (H) SOX2 expression and mammosphere formation were evaluated using IMP3-depleted and IMP3-depleted cells that had been transfected with wild-type IMP3 (IMP3-wt) or a mutant construct that is resistant to shIMP3-1 (IMP3-mut). (I) RIP was performed on extracts prepared from SUM1315 cells using an IMP3-specific antibody or isotype matched IgG. SOX2, NANOG and IGF2 mRNAs were quantified by qPCR. IGF2 mRNA was used as positive control and NANOG was used as negative control. Immunoblot shows the specificity of IMP3 antibody. p value (*) < 0.05.
Figure 4
Figure 4
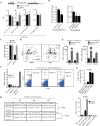
SLUG phenocopies the functions of IMP3. (A) SLUG expression was analyzed in the CD44+CD24ESA+ and bulk populations of breast tumor cells using a published database (GEO accession no. GSE6883). (B) SLUG mRNA was quantified by qPCR using total RNA prepared from CD44+CD24ESA+ population sorted from SUM1315 (left) and MDA435 cells (right). (C) Total RNA was isolated from SUM159 and T47D cells grown as either adherent cultures, mammospheres or differentiated mammospheres induced by collagen-1, and assayed for SLUG expression by qPCR. (D) SLUG expression was depleted in SUM1315 and MDA435 cells using shRNAs (shSLUG-1 & shSLUG-2) and these cells were maintained in mammosphere culture for 7 days. SOX2 expression was assessed in these SLUG-depleted cells by immunoblotting and qPCR. (E) FACS analysis of the CD44+CD24ESA+ population in shControl and SLUG-depleted SUM1315 and MDA435 cells. (F) SLUG and SOX2 expression was quantified by qPCR in SKBR3 cells transiently transfected with a SLUG expression construct (pSLUG). (G) SLUG expression was depleted in CD44+CD24ESA+ population sorted from SUM1315 cells (left) and the mesenchymal population of SRC-transformed MCF10A cells (right) using shRNAs and these SLUG- depleted cells were used for quantifying SOX2 mRNA by qPCR. p value (*) < 0.05.
Figure 5
Figure 5
IMP3 regulation of SOX2 and tumor initiation is mediated by SLUG. (A) Parental (transfected with an empty vector) or IMP3-expressing SUM159 cells were transiently transfected with renilla luciferase reporter constructs carrying the 3′ & 5′ UTRs of SLUG mRNA or corresponding empty vector and luciferase expression was measured 24 h post-transfection. A construct expressing firefly luciferase (PGL3 control vector) was used as transfection control. The relative luminescence unit (RLU) was determined as renilla luciferase normalized to firefly luciferase activity. (B) SLUG mRNA was quantified by qPCR using total RNA prepared from IMP3-depleted CD44+CD24 ESA+ population sorted from SUM1315 cells (left) and the mesenchymal CD44+CD24 population of Src-transformed MCF10A cells (right). (C) Expression of IMP2 and SLUG was measured by qPCR using total RNA extracted from control or IMP2-depleted SUM1315 cells. IMP2 was depleted using smart-pool siRNA (20 nM) and transfection was carried out using Dharmafect-4 for 72 h. An off-target siRNA pool (20 nM) was used as control. (D) Expression of IMP3, IMP2 and SLUG was correlated using a published gene expression database comprising 81 BLBCs (cBioportal). Correlation coefficient (r) was calculated using Pearson’s correlation. (E) IMP3-depleted SUM1315 cells (shIMP3-1 & shIMP3-2) were transiently transfected with either an empty vector or a SLUG expression construct (pSLUG). SLUG and SOX2 mRNA expression was quantified by qPCR. (F) IMP3-depleted SUM1315 cells (shIMP3-1) were transiently transfected with either an empty vector or a SLUG expression construct and these cells were used to quantify CD44+CD24ESA+ population by FACS (right). IMP3 and SLUG expression was measured by qPCR (left). (G) SKBR3 cells pre-transfected with either control shRNA (shControl) or SLUG specific shRNAs (shSLUG-1 & shSLUG-2) were transfected with an empty vector or IMP3-expressing construct. RNA isolated from these cells was used to quantify IMP3, SLUG and SOX2 expression by qPCR. (H) Control, IMP3-depleted or IMP3-depleted SUM1315 cells, stably infected with a SLUG-expressing lentivirus construct, were mixed with Matrigel (1:1, v/v) and injected into the mammary fat pads of NSG mice. Number of cells injected is indicated in the figure. Each group comprised 7 mice. p value (*) < 0.05.
Figure 6
Figure 6
SLUG binds to the SOX2 promoter. (A) IMP3, SLUG and SOX2 mRNA expression was correlated in a published database comprising 327 samples (GEO accession no. GSE6532). Statistical significance was determined using Pearson’s correlation. (B) ChIP was performed using genomic DNA isolated from SUM1315 cells using a SLUG-specific antibody, and the SLUG-bound SOX2 fragments were quantified by qPCR. Isotype matched IgG was used as control for this experiment.

Similar articles

Cited by

References

    1. Al-Hajj M, Wicha MS, Benito-Hernandez A, Morrison SJ, Clarke MF. Prospective identification of tumorigenic breast cancer cells. Proceedings of the National Academy of Sciences of the United States of America. 2003;100:3983–3988. - PMC - PubMed
    1. Basu-Roy U, Seo E, Ramanathapuram L, Rapp TB, Perry JA, Orkin SH, et al. Sox2 maintains self renewal of tumor-initiating cells in osteosarcomas. Oncogene. 2012;31:2270–2282. - PMC - PubMed
    1. Ben-Porath I, Thomson MW, Carey VJ, Ge R, Bell GW, Regev A, et al. An embryonic stem cell-like gene expression signature in poorly differentiated aggressive human tumors. Nature genetics. 2008;40:499–507. - PMC - PubMed
    1. Bhola NE, Balko JM, Dugger TC, Kuba MG, Sanchez V, Sanders M, et al. TGF-beta inhibition enhances chemotherapy action against triple-negative breast cancer. J Clin Invest. 2013;123:1348–1358. - PMC - PubMed
    1. Bolos V, Peinado H, Perez-Moreno MA, Fraga MF, Esteller M, Cano A. The transcription factor Slug represses E-cadherin expression and induces epithelial to mesenchymal transitions: a comparison with Snail and E47 repressors. Journal of cell science. 2003;116:499–511. - PubMed

Publication types

MeSH terms