

An animal model for chorioamnionitis at term
- PMID: 25979619
- PMCID: PMC4806536
- DOI: 10.1016/j.ajog.2015.05.007
An animal model for chorioamnionitis at term
Abstract
Objective: The purpose of this study was to develop an animal model for intrapartum inflammation at term to investigate the interactions between maternal and fetal inflammatory responses and adverse neurologic outcome.
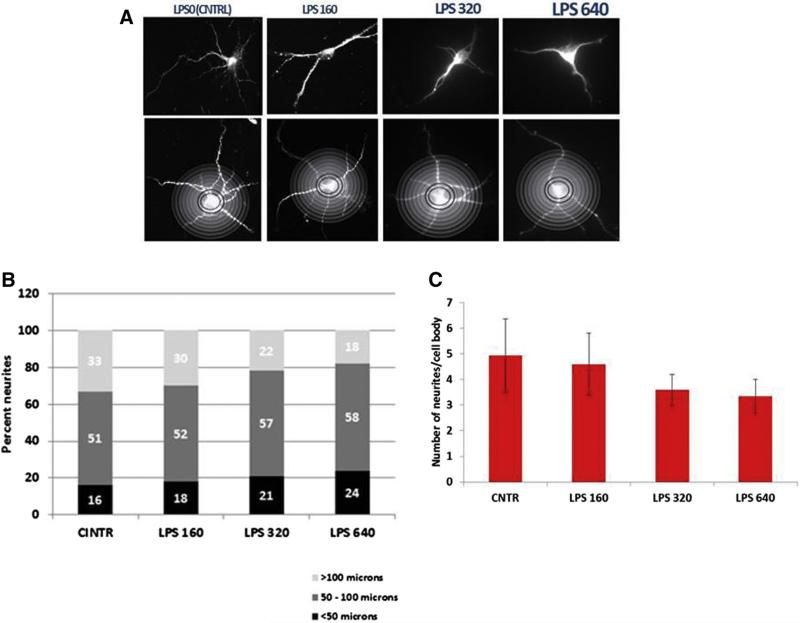
Study design: Lipopolysaccharide (160, 320, or 640 μg/kg) was administered intraperitoneally to day 20 term-pregnant Sprague Dawley rat dams 2, 4, and 6 hours before sample collection. Maternal outcomes included dam core temperature and plasma interleukin 6 (IL-6). Fetal outcomes included plasma IL-6, brain IL-6 messenger RNA expression, and brain IL-6 protein expression. Primary cortical cell cultures were prepared to examine neuronal morphologic condition. Neurite counts were obtained with the use of automated Sholl analysis.
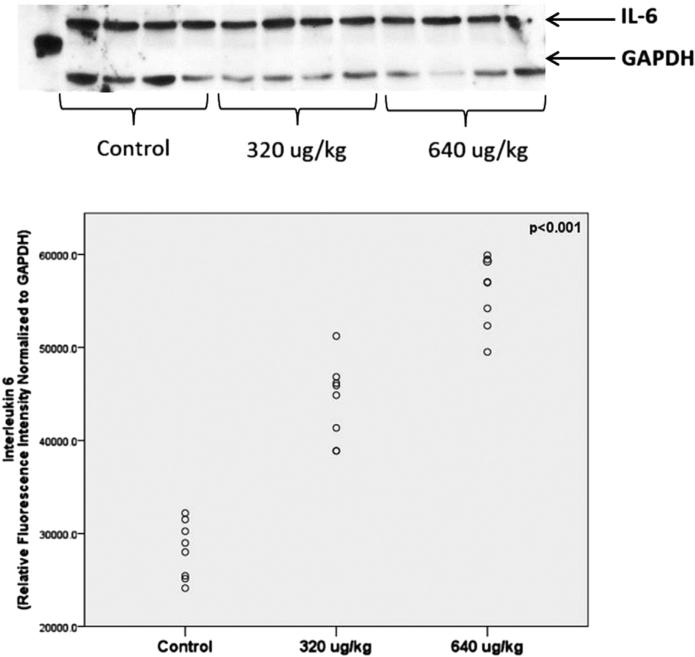
Results: Maternal plasma IL-6 levels peaked 2 hours after lipopolysaccharide stimulus and rapidly resolved, except for an observed low level persistence at 6 hours with 640 μg/kg. Fetal plasma and placental IL-6 expression also peaked rapidly but only persisted in placental samples. Fetal brain IL-6 RNA and protein expression was significantly higher than control litters at 6 hours after the exposure to both 320 μg/kg (P ≤ .05) and 640 μg/kg (P ≤ .01). Cortical cells from fetuses that were exposed for 6 hours to maternal systemic inflammation showed reduced neurite number and neurite length (P < .001) with increasing lipopolysaccharide dose.
Conclusion: Our results demonstrate that fetal brain injury follows isolated systemic maternal inflammation and that fetal brain inflammation lags after maternal stimulus, which creates a potential 4-hour clinical window for therapeutic intervention.
Keywords: brain injury; cerebral palsy; chorioamnionitis.
Copyright © 2015 Elsevier Inc. All rights reserved.
Figures


Similar articles
-
Chorioamnionitis, IL-17A, and fetal origins of neurologic disease.Am J Reprod Immunol. 2018 May;79(5):e12803. doi: 10.1111/aji.12803. Epub 2017 Dec 22. Am J Reprod Immunol. 2018. PMID: 29271527 Free PMC article. Review.
-
Combined in utero hypoxia-ischemia and lipopolysaccharide administration in rats induces chorioamnionitis and a fetal inflammatory response syndrome.Placenta. 2015 Dec;36(12):1378-84. doi: 10.1016/j.placenta.2015.10.009. Epub 2015 Oct 23. Placenta. 2015. PMID: 26601766
-
Pharmacological blockade of the interleukin-1 receptor suppressed Escherichia coli lipopolysaccharide-induced neuroinflammation in preterm fetal sheep.Am J Obstet Gynecol MFM. 2023 Nov;5(11):101124. doi: 10.1016/j.ajogmf.2023.101124. Epub 2023 Aug 18. Am J Obstet Gynecol MFM. 2023. PMID: 37597799
-
The fetal response to maternal inflammation is dependent upon maternal IL-6 in a murine model.Cytokine. 2023 Jul;167:156210. doi: 10.1016/j.cyto.2023.156210. Epub 2023 Apr 30. Cytokine. 2023. PMID: 37130487 Free PMC article.
-
Acute chorioamnionitis and funisitis: definition, pathologic features, and clinical significance.Am J Obstet Gynecol. 2015 Oct;213(4 Suppl):S29-52. doi: 10.1016/j.ajog.2015.08.040. Am J Obstet Gynecol. 2015. PMID: 26428501 Free PMC article. Review.
Cited by
-
Clinical chorioamnionitis at term is characterized by changes in the plasma concentration of CHCHD2/MNRR1, a mitochondrial protein.J Matern Fetal Neonatal Med. 2023 Dec;36(2):2222333. doi: 10.1080/14767058.2023.2222333. J Matern Fetal Neonatal Med. 2023. PMID: 37349086 Free PMC article.
-
Prenatal inflammation impairs intestinal microvascular development through a TNF-dependent mechanism and predisposes newborn mice to necrotizing enterocolitis.Am J Physiol Gastrointest Liver Physiol. 2019 Jul 1;317(1):G57-G66. doi: 10.1152/ajpgi.00332.2018. Epub 2019 May 24. Am J Physiol Gastrointest Liver Physiol. 2019. PMID: 31125264 Free PMC article.
-
Clinical chorioamnionitis at term V: umbilical cord plasma cytokine profile in the context of a systemic maternal inflammatory response.J Perinat Med. 2016 Jan;44(1):53-76. doi: 10.1515/jpm-2015-0121. J Perinat Med. 2016. PMID: 26360486 Free PMC article.
-
Chorioamnionitis, IL-17A, and fetal origins of neurologic disease.Am J Reprod Immunol. 2018 May;79(5):e12803. doi: 10.1111/aji.12803. Epub 2017 Dec 22. Am J Reprod Immunol. 2018. PMID: 29271527 Free PMC article. Review.
-
Risks associated with viral infections during pregnancy.J Clin Invest. 2017 May 1;127(5):1591-1599. doi: 10.1172/JCI87490. Epub 2017 May 1. J Clin Invest. 2017. PMID: 28459427 Free PMC article. Review.
References
-
- Rosenbaum P, Paneth N, Leviton A, et al. A report: the definition and classification of cerebral palsy April 2006. Dev Med Child Neurol. 2007;109(suppl):8–14. - PubMed
-
- Himmelmann K, Uvebrant P. The panorama of cerebral palsy in Sweden: XI, changing patterns in the birth-year period 2003-2006. Acta paediatr. 2014;103:618–24. - PubMed
-
- Fairhurst C. Cerebral palsy: the whys and hows. Arch Dis Child Educ Pract Ed. 2012;97:122–31. - PubMed
-
- Soleimani F, Vameghi R, Biglarian A. Ante-natal and intrapartum risk factors for cerebral palsy in term and near-term newborns. Arch Iran Med. 2013;16:213–6. - PubMed
-
- Grether JK, Nelson KB. Maternal infection and cerebral palsy in infants of normal birth weight. JAMA. 1997;278:207–11. - PubMed
Publication types
MeSH terms
Substances
Grants and funding
LinkOut - more resources
Full Text Sources
Other Literature Sources
Miscellaneous
