

Social evolution. Genomic signatures of evolutionary transitions from solitary to group living
- PMID: 25977371
- PMCID: PMC5471836
- DOI: 10.1126/science.aaa4788
Social evolution. Genomic signatures of evolutionary transitions from solitary to group living
Abstract
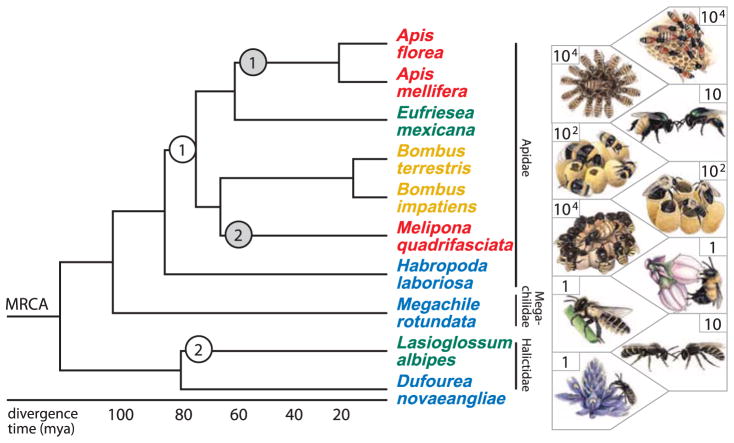
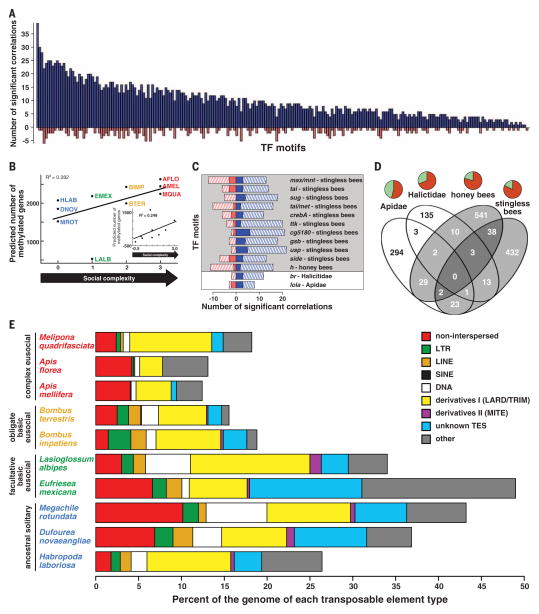
The evolution of eusociality is one of the major transitions in evolution, but the underlying genomic changes are unknown. We compared the genomes of 10 bee species that vary in social complexity, representing multiple independent transitions in social evolution, and report three major findings. First, many important genes show evidence of neutral evolution as a consequence of relaxed selection with increasing social complexity. Second, there is no single road map to eusociality; independent evolutionary transitions in sociality have independent genetic underpinnings. Third, though clearly independent in detail, these transitions do have similar general features, including an increase in constrained protein evolution accompanied by increases in the potential for gene regulation and decreases in diversity and abundance of transposable elements. Eusociality may arise through different mechanisms each time, but would likely always involve an increase in the complexity of gene networks.
Copyright © 2015, American Association for the Advancement of Science.
Figures
Similar articles
-
Rate variation in the evolution of non-coding DNA associated with social evolution in bees.Philos Trans R Soc Lond B Biol Sci. 2019 Jul 22;374(1777):20180247. doi: 10.1098/rstb.2018.0247. Epub 2019 Jun 3. Philos Trans R Soc Lond B Biol Sci. 2019. PMID: 31154980 Free PMC article.
-
Sociality sculpts similar patterns of molecular evolution in two independently evolved lineages of eusocial bees.Commun Biol. 2021 Feb 26;4(1):253. doi: 10.1038/s42003-021-01770-6. Commun Biol. 2021. PMID: 33637860 Free PMC article.
-
Phylogeny of the carpenter bees (Apidae: Xylocopinae) highlights repeated evolution of sociality.Biol Lett. 2023 Aug;19(8):20230252. doi: 10.1098/rsbl.2023.0252. Epub 2023 Aug 30. Biol Lett. 2023. PMID: 37643643 Free PMC article.
-
Molecular Evolution of Insect Sociality: An Eco-Evo-Devo Perspective.Annu Rev Entomol. 2017 Jan 31;62:419-442. doi: 10.1146/annurev-ento-031616-035601. Epub 2016 Nov 28. Annu Rev Entomol. 2017. PMID: 27912247 Review.
-
Genomic sources of phenotypic novelty in the evolution of eusociality in insects.Curr Opin Insect Sci. 2016 Feb;13:24-32. doi: 10.1016/j.cois.2015.10.009. Epub 2015 Nov 12. Curr Opin Insect Sci. 2016. PMID: 27436550 Review.
Cited by
-
Dedicated developmental programing for group-supporting behaviors in eusocial honeybees.Sci Adv. 2024 Nov;10(44):eadp3953. doi: 10.1126/sciadv.adp3953. Epub 2024 Nov 1. Sci Adv. 2024. PMID: 39485851 Free PMC article.
-
Insects Provide Unique Systems to Investigate How Early-Life Experience Alters the Brain and Behavior.Front Behav Neurosci. 2021 Apr 21;15:660464. doi: 10.3389/fnbeh.2021.660464. eCollection 2021. Front Behav Neurosci. 2021. PMID: 33967715 Free PMC article. Review.
-
Comparative analyses of mitogenomes in the social bees with insights into evolution of long inverted repeats in the Meliponini.Zool Res. 2024 Jan 18;45(1):160-175. doi: 10.24272/j.issn.2095-8137.2023.169. Zool Res. 2024. PMID: 38199971 Free PMC article.
-
Genome of the bee Holcopasites calliopsidis-a species showing the common apid trait of brood parasitism.G3 (Bethesda). 2022 Jul 29;12(8):jkac160. doi: 10.1093/g3journal/jkac160. G3 (Bethesda). 2022. PMID: 35762966 Free PMC article.
-
Evolution of five environmentally responsive gene families in a pine-feeding sawfly, Neodiprion lecontei (Hymenoptera: Diprionidae).Ecol Evol. 2023 Oct 1;13(10):e10506. doi: 10.1002/ece3.10506. eCollection 2023 Oct. Ecol Evol. 2023. PMID: 37791292 Free PMC article.
References
-
- Maynard Smith J, Szathmáry E. The Major Transitions in Evolution. Oxford Univ. Press; Oxford, UK: 1995.
-
- Michener CD. The Social Behavior of the Bees. Harvard Univ. Press; Cambridge, MA: 1974.
-
- Hölldobler H, Wilson EO. The Superorganism: The Beauty, Elegance and Strangeness of Insect Societies. Norton; New York: 2009.
-
- Johnson BR, Linksvayer TA. Q Rev Biol. 2010;85:57–79. - PubMed
Publication types
MeSH terms
Substances
Associated data
Grants and funding
LinkOut - more resources
Full Text Sources
Other Literature Sources
