

Paracrine co-delivery of TGF-β and IL-2 using CD4-targeted nanoparticles for induction and maintenance of regulatory T cells
- PMID: 25974747
- PMCID: PMC5997248
- DOI: 10.1016/j.biomaterials.2015.04.003
Paracrine co-delivery of TGF-β and IL-2 using CD4-targeted nanoparticles for induction and maintenance of regulatory T cells
Abstract
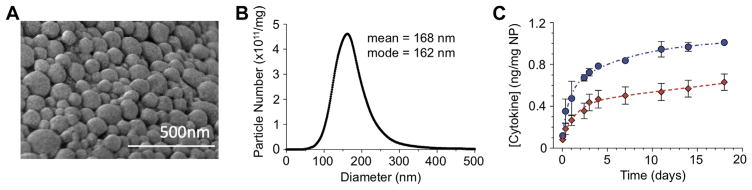
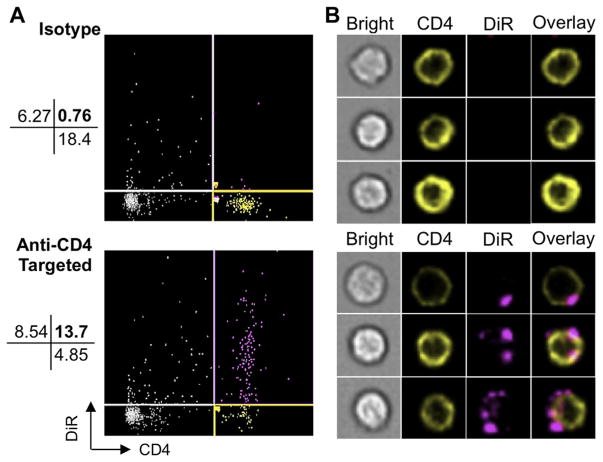
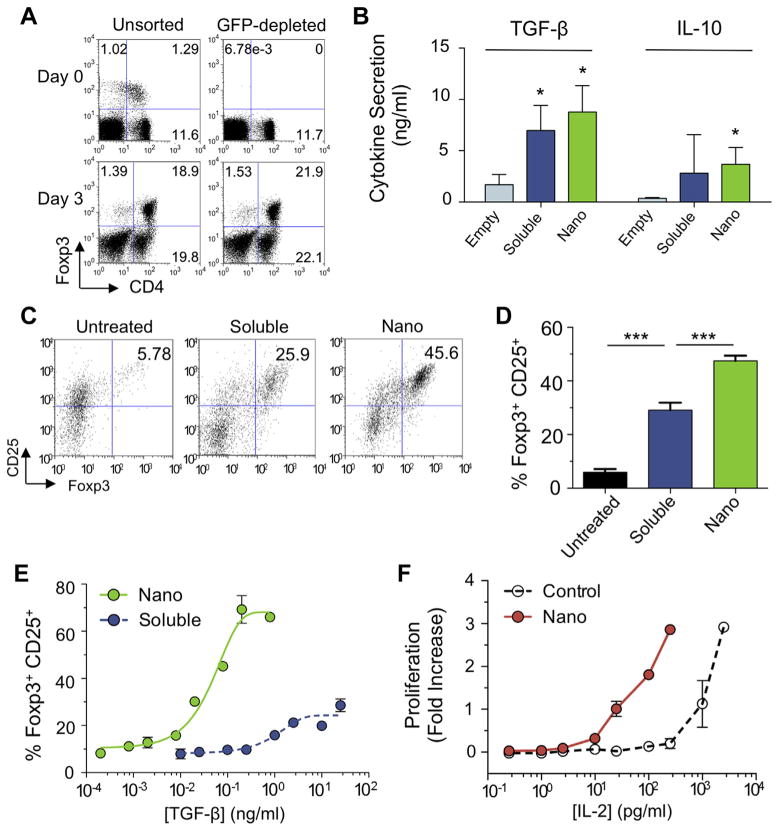
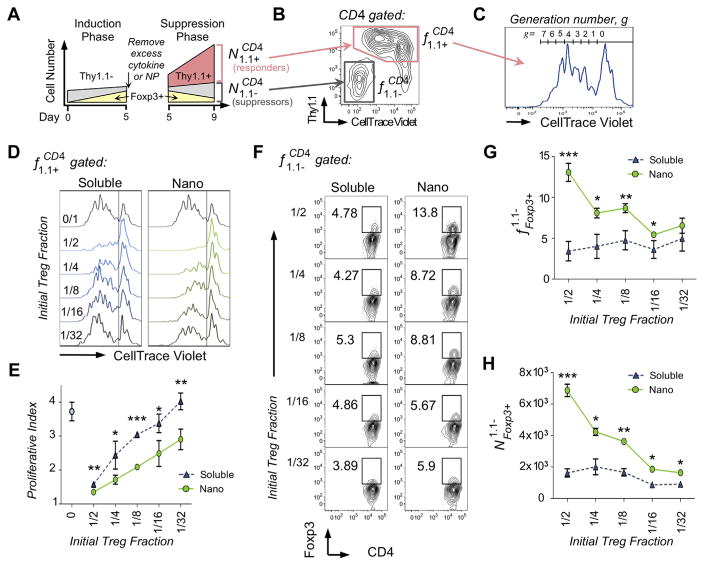
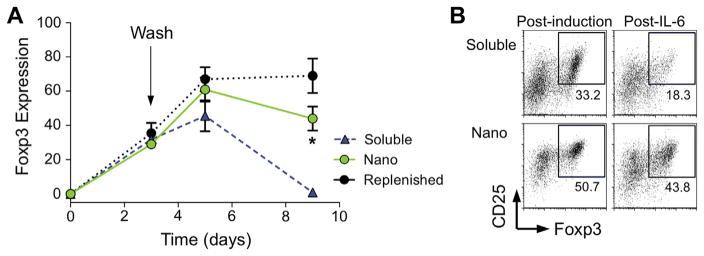
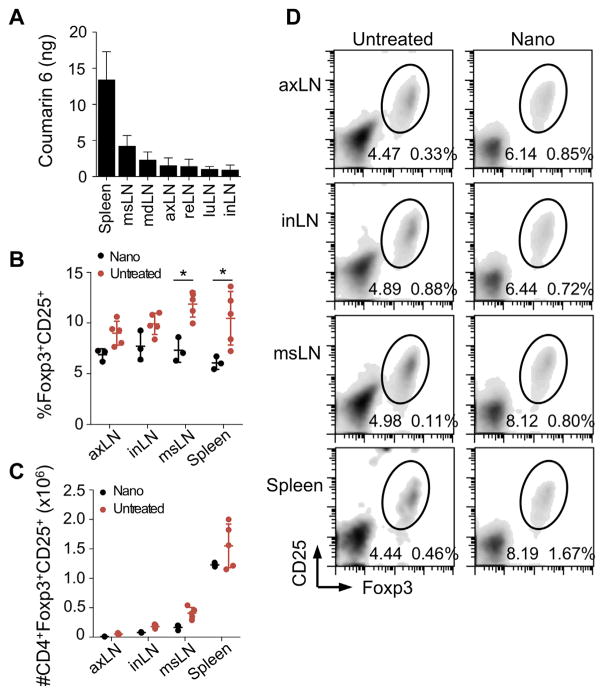
The cytokine milieu is critical for orchestration of lineage development towards effector T cell (Teff) or regulatory T cell (Treg) subsets implicated in the progression of cancer and autoimmune disease. Importantly, the fitness and survival of the Treg subset is dependent on the cytokines Interleukin-2 (IL-2) and transforming growth factor beta (TGF-β). The production of these cytokines is impaired in autoimmunity increasing the probability of Treg conversion to aggressive effector cells in a proinflammatory microenvironment. Therapy using soluble TGF-β and IL-2 administration is hindered by the cytokines' toxic pleiotropic effects and hence bioavailability to CD4(+) T cell targets. Thus, there is a clear need for a strategy that rectifies the cytokine milieu in autoimmunity and inflammation leading to enhanced Treg stability, frequency and number. Here we show that inert biodegradable nanoparticles (NP) loaded with TGF-β and IL-2 and targeted to CD4(+) cells can induce CD4(+) Tregs in-vitro and expand their number in-vivo. The stability of induced Tregs with cytokine-loaded NP was enhanced leading to retention of their suppressive phenotype even in the presence of proinflammatory cytokines. Our results highlight the importance of a nanocarrier-based approach for stabilizing and expanding Tregs essential for cell-immunotherapy of inflammation and autoimmune disease.
Keywords: Autoimmunity; Drug delivery; Immunomodulation; Interleukin-2; Nanoparticles; TGF-β.
Copyright © 2015. Published by Elsevier Ltd.
Figures
Similar articles
-
Suppression of Murine Lupus by CD4+ and CD8+ Treg Cells Induced by T Cell-Targeted Nanoparticles Loaded With Interleukin-2 and Transforming Growth Factor β.Arthritis Rheumatol. 2019 Apr;71(4):632-640. doi: 10.1002/art.40773. Epub 2019 Mar 5. Arthritis Rheumatol. 2019. PMID: 30407752 Free PMC article.
-
Blockade of TGF-β signaling to enhance the antitumor response is accompanied by dysregulation of the functional activity of CD4+CD25+Foxp3+ and CD4+CD25-Foxp3+ T cells.J Transl Med. 2019 Jul 9;17(1):219. doi: 10.1186/s12967-019-1967-3. J Transl Med. 2019. PMID: 31288845 Free PMC article.
-
Distinct regulatory roles of transforming growth factor-beta and interleukin-4 in the development and maintenance of natural and induced CD4+ CD25+ Foxp3+ regulatory T cells.Immunology. 2009 Sep;128(1 Suppl):e670-8. doi: 10.1111/j.1365-2567.2009.03060.x. Epub 2009 Jan 24. Immunology. 2009. PMID: 19740328 Free PMC article.
-
The role of T helper 17 (Th17) and regulatory T cells (Treg) in human organ transplantation and autoimmune disease.Clin Exp Immunol. 2007 Apr;148(1):32-46. doi: 10.1111/j.1365-2249.2007.03356.x. Clin Exp Immunol. 2007. PMID: 17328715 Free PMC article. Review.
-
The role of the combination of IL-2 and TGF-beta or IL-10 in the generation and function of CD4+ CD25+ and CD8+ regulatory T cell subsets.J Leukoc Biol. 2003 Oct;74(4):471-8. doi: 10.1189/jlb.0503228. J Leukoc Biol. 2003. PMID: 14519757 Free PMC article. Review.
Cited by
-
Artificial Mini Dendritic Cells Boost T Cell-Based Immunotherapy for Ovarian Cancer.Adv Sci (Weinh). 2020 Feb 5;7(7):1903301. doi: 10.1002/advs.201903301. eCollection 2020 Apr. Adv Sci (Weinh). 2020. PMID: 32274314 Free PMC article.
-
Surface engineering for lymphocyte programming.Adv Drug Deliv Rev. 2017 May 15;114:102-115. doi: 10.1016/j.addr.2017.05.005. Epub 2017 May 10. Adv Drug Deliv Rev. 2017. PMID: 28501510 Free PMC article. Review.
-
The CXCL10/CXCR3 Axis and Cardiac Inflammation: Implications for Immunotherapy to Treat Infectious and Noninfectious Diseases of the Heart.J Immunol Res. 2016;2016:4396368. doi: 10.1155/2016/4396368. Epub 2016 Oct 3. J Immunol Res. 2016. PMID: 27795961 Free PMC article. Review.
-
Drug nanocarriers to treat autoimmunity and chronic inflammatory diseases.Semin Immunol. 2017 Dec;34:61-67. doi: 10.1016/j.smim.2017.08.010. Epub 2017 Aug 30. Semin Immunol. 2017. PMID: 28855088 Free PMC article. Review.
-
Engineering Immune Tolerance with Biomaterials.Adv Healthc Mater. 2019 Feb;8(4):e1801419. doi: 10.1002/adhm.201801419. Epub 2019 Jan 3. Adv Healthc Mater. 2019. PMID: 30605264 Free PMC article. Review.
References
-
- Sakaguchi S, Yamaguchi T, Nomura T, Ono M. Regulatory T cells and immune tolerance. Cell. 2008;133(5):775–87. - PubMed
-
- Maloy KJ, Powrie F. Regulatory T cells in the control of immune pathology. Nat Immunol. 2001;2(9):816–22. - PubMed
-
- Wildin RS, Ramsdell F, Peake J, Faravelli F, Casanova JL, Buist N, et al. X-linked neonatal diabetes mellitus, enteropathy and endocrinopathy syndrome is the human equivalent of mouse scurfy. Nat Genet. 2001;27(1):18–20. - PubMed
Publication types
MeSH terms
Substances
Grants and funding
LinkOut - more resources
Full Text Sources
Other Literature Sources
Research Materials
Miscellaneous
