. 2015 Jun 15;194(12):6082-9.
doi: 10.4049/jimmunol.1402469. Epub 2015 May 11.

Pyruvate dehydrogenase kinase 1 participates in macrophage polarization via regulating glucose metabolism

Affiliations

Pyruvate dehydrogenase kinase 1 participates in macrophage polarization via regulating glucose metabolism

Zheng Tan et al. J Immunol. .

Abstract

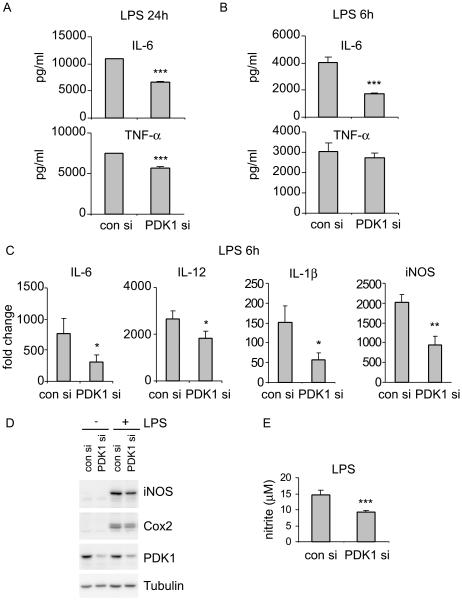
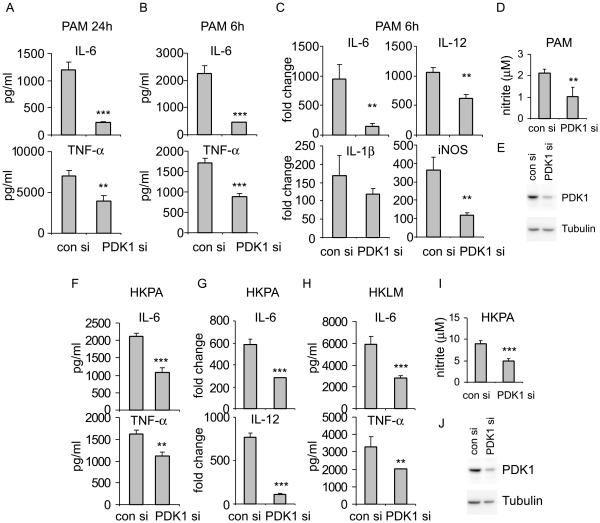
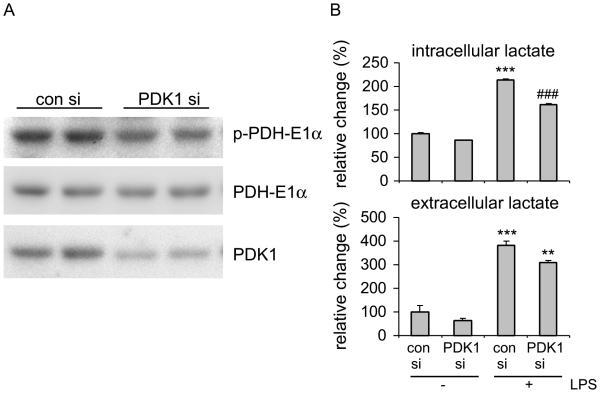
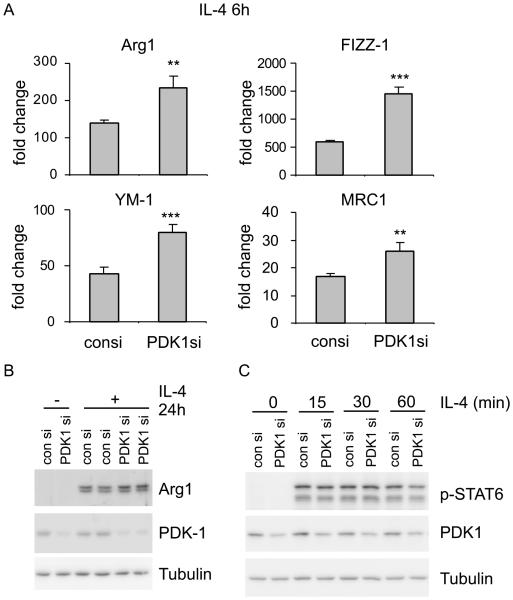
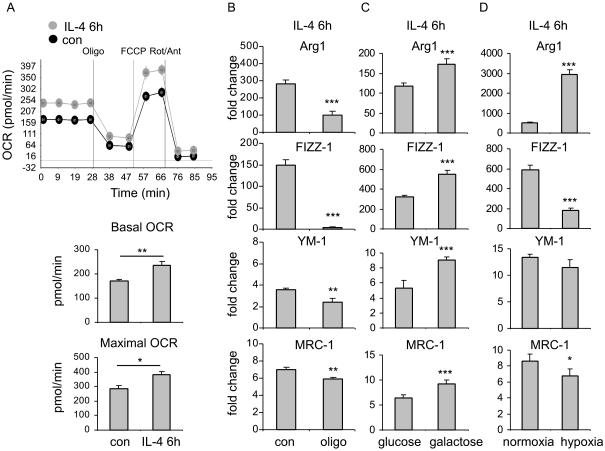
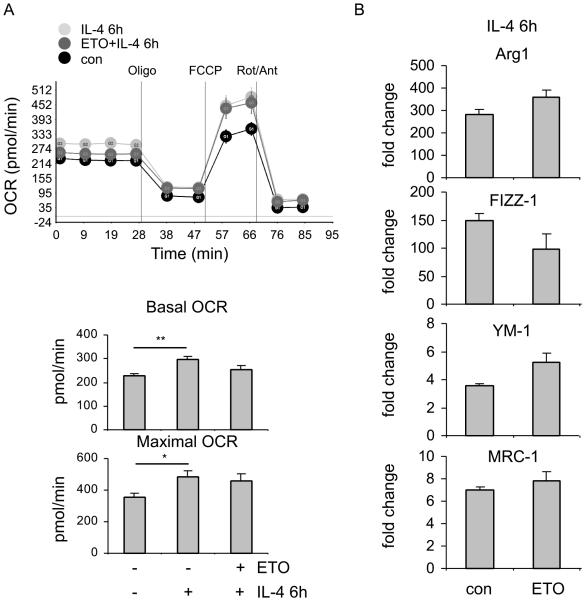
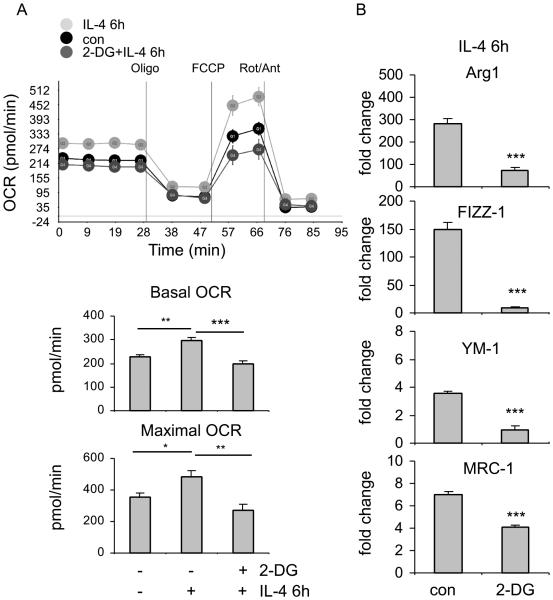
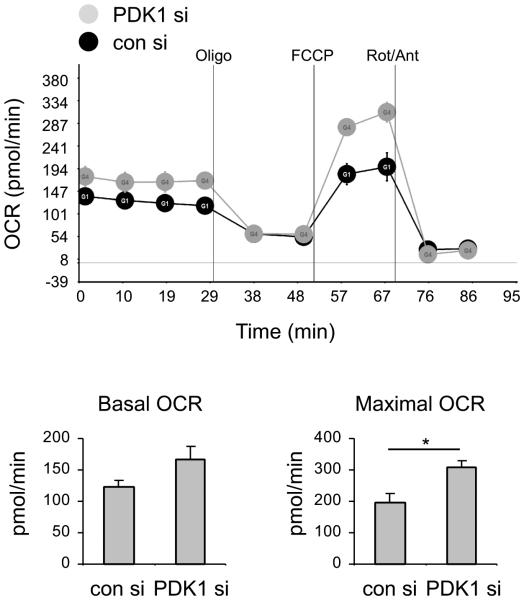
The M1 and M2 polarized phenotypes dictate distinctive roles for macrophages as they participate in inflammatory disorders. There has been growing interest in the role of cellular metabolism in macrophage polarization. However, it is currently unclear whether different aspects of a specific metabolic program coordinately regulate this cellular process. In this study, we found that pyruvate dehydrogenase kinase 1 (PDK1), a key regulatory enzyme in glucose metabolism, plays an important role in the differential activation of macrophages. Knockdown of PDK1 diminished M1, whereas it enhanced M2 activation of macrophages. Mechanistically, PDK1 knockdown led to diminished aerobic glycolysis in M1 macrophages, which likely accounts for the attenuated inflammatory response in these cells. Furthermore, we found that mitochondrial respiration is enhanced during and required by the early activation of M2 macrophages. Suppression of glucose oxidation, but not that of fatty acids, inhibits this process. Consistent with its inhibitory role in early M2 activation, knockdown of PDK1 enhanced mitochondrial respiration in macrophages. Our data suggest that two arms of the glucose metabolism synergistically regulate the differential activation of macrophages. Our findings also highlight the central role of PDK1 in this event via controlling glycolysis and glucose oxidation.


Figures

Figure 1
Figure 1. Knockdown of PDK1 diminishes LPS induced M1 macrophage activation
(A-B) Mouse BMDMs were transfected with 20 nM control siRNA or PDK1 siRNA. 48h after transfection, the cells were treated without or with 100 ng/ml LPS for 24 (A) or 6h (B). Levels of IL-6 and TNF-α in the cell culture supernatants were determined by ELISA assays. *** p<0.001 compared to "con si" group. (C) Mouse BMDMs were transfected with 20 nM control siRNA or PDK1 siRNA. 48h after transfection, the cells were treated without or with 100 ng/ml LPS for 6h. mRNA levels of IL-6, IL-12, IL-1β and iNOS were determined by realtime PCR. * p<0.05, ** p<0.01 compared to "con si" group. (D) The experiments were performed as in B and protein levels of iNOS, Cox2, PDK1 and Tubulin determined by Western blotting. (E) The experiments were performed as in B and NO production represented by nitrite concentrations in culture media was determined. *** p<0.001 compared to "con si". The experiments were performed three times with similar results obtained.
Figure 2
Figure 2. PDK1 is required for M1 macrophage activation by TLR2 activation
(A-B) Mouse BMDMs were transfected with 20 nM control siRNA or PDK1 siRNA. 48h after transfection, the cells were treated without or with 1 μg/ml PAM for 24 (A) or 6h (B). Levels of IL-6 and TNF-α in the cell culture supernatants were determined by ELISA assays. ** p<0.01, *** p<0.001 compared to "con si" group. (C) Mouse BMDMs were transfected with 20 nM control siRNA or PDK1 siRNA. 48h after transfection, the cells were treated without or with 1 μg/ml PAM for 6h. mRNA levels of IL-6, IL-12, IL-1β and iNOS were determined by realtime PCR. ** p<0.01 compared to "con si" group. The experiments were performed three times with similar results obtained. (D) Experiments were performed as in B. NO production was determined. ** p<0.01 compared to "con si". (E) Representative blot of PDK1 knockdown in A-D is shown. (F-H) Mouse BMDMs were transfected with 20 nM control siRNA or PDK1 siRNA. 48h after transfection, the cells were treated without or with 1 × 10⁷/ml HKPA (F, G) or HKLM (H) for 6h. Protein (F, H) and mRNA (G) levels of TNF-α, IL-6 and IL-12 were determined by ELISA assays or real-time PCR. ** p<0.01, *** p<0.001 compared to "con siRNA". (I) Experiments were performed as in F. NO production was determined. *** p<0.001 compared to "con si". (J) Representative blot of PDK1 knockdown in F-I is shown. The experiments were repeated twice.
Figure 3
Figure 3. PDK1 knockdown inhibits glycolysis in macrophages
(A) Mouse BMDMs were transfected with 20 nM control siRNA or PDK1 siRNA. 48h after transfection, cellular extracts were prepared and levels of p-PDH-E1α, PDH-E1α and PDK1 determined by Western blotting. (B) BMDMs were transfected with 20 nM control siRNA or PDK1 siRNA. 48h after transfection, the cells were treated without or with 100 ng/ml LPS for 6h. The cell supernatants were collected. Cells were lysed in lactate assay buffer. Levels of lactate in the supernatants and in the cellular extracts were determined by lactate assay kit. *** p<0.001 compared to "con si-"; ** p<0.01 compared to "con si+"; ### p<0.001 compared to "con si+". The experiments were performed three times with similar results obtained.
Figure 4
Figure 4. PDK1 knockdown enhances M2 macrophage activation
Mouse BMDMs were transfected with 20 nM control siRNA or PDK1 siRNA. 48h after transfection, the cells were treated without or with 2 ng/ml IL-4 for 6h. Levels of Arg1, YM-1, FIZZ-1, and MRC1 were determined by realtime PCR. ** p<0.01, *** p<0.001 compared to "con si" group. (B) Mouse BMDMs were transfected with 20 nM control siRNA or PDK1 siRNA. 48h after transfection, the cells were treated without or with 2 ng/ml IL-4 for 24h. Protein levels of Arg1 and Tubulin were determined by Western blotting. (C) Mouse BMDMs were transfected with 20 nM control siRNA or PDK1 siRNA. 48h after transfection, the cells were treated with 2 ng/ml IL-4 for the indicated periods of time. Levels of p-STAT6, PDK1 and Tubulin were determined by Western blotting. Data are representative of three experiments.
Figure 5
Figure 5. Mitochondrial respiration is increased during and required for the early differentiation of M2 macrophages
(A) BMDMs were seeded in Seahorse XF-24 cell culture microplates (1.5×10⁵ cells/well). The cells were treated without or with 2 ng/ml IL-4 for 6h, followed by sequential treatment (separated by vertical lines) with oligomycin (Oligo), FCCP, and rotenone plus antimycin (Rot + Ant). OCR (basal, non-mitochondrial (after treatment with Oligo), and reserve (after treatment with FCCP)) were then determined. OCR at basal and maximal levels of the indicated conditions were plotted in bar graphs. * p<0.05, ** p<0.01. (B) Mouse BMDMs were pre-treated without or with 0.5 μg/ml oligomycin for 1h. The cells were then treated without or with 2 ng/ml IL-4 for 6h. Levels of Arg1, YM-1, FIZZ-1, and MRC1 were determined by realtime PCR. ** p<0.01, *** p<0.001 compared to "con" group. (C) Mouse BMDMs were cultured in DMEM media containing 25 mM glucose or 25 mM galactose for 24h. The cells were then treated without or with 2 ng/ml IL-4 for 6h. Levels of Arg1, YM-1, FIZZ-1, and MRC1 were determined by realtime PCR. *** p<0.001 compared to "con" group. (D) Mouse BMDMs were pre-exposed to normoxia or hypoxia (1% O2) for 90 min, followed by treatment with with 2 ng/ml IL-4 for 6h. Levels of Arg1, YM-1, FIZZ-1, and MRC1 were determined by realtime PCR. * p<0.05, *** p<0.001 compared to "con" group. Data are representative of three experiments.
Figure 6
Figure 6. Fatty acid oxidation is dispensable to the early differentiation of M2 macrophages
(A) BMDMs were seeded in Seahorse XF-24 cell culture microplates (1.5×10⁵ cells/well). The cells were pre-treated without or with 100 μM etomoxir (ETO) for 1h and then treated without or with 2 ng/ml IL-4 for 6h, followed by sequential treatment with Oligo, FCCP, and Rot plus Ant. OCR at basal and maximal levels of the indicated conditions were plotted in bar graphs. * p<0.05, ** p<0.01. (B) Mouse BMDMs were pre-treated without or with 100 μM ETO for 1h. The cells were then treated without or with 2 ng/ml IL-4 for 6h. Levels of Arg1, YM-1, FIZZ-1, and MRC1 were determined by realtime PCR. The experiments were performed three times with similar results obtained.
Figure 7
Figure 7. Glucose oxidation is required for the early differentiation of M2 macrophages
(A) BMDMs were seeded in Seahorse XF-24 cell culture microplates (1.5×10⁵ cells/well). The cells were pre-treated without or with 1 mM 2-DG for 3h and then treated without or with 2 ng/ml IL-4 for 6h, followed by sequential treatment with Oligo, FCCP, and Rot plus Ant. OCR at basal and maximal levels of the indicated conditions were plotted in bar graphs. * p<0.05, ** p<0.01, *** p<0.001. (B) Mouse BMDMs were pre-treated without or with 1 mM 2-DG for 3h. The cells were then treated without or with 2 ng/ml IL-4 for 6h. Levels of Arg1, FIZZ-1, YM-1 and MRC1 were determined by realtime PCR. *** p<0.001 compared to "con" group. The experiments were performed three times with similar results obtained.
Figure 8
Figure 8. PDK1 knockdown enhances mitochondrial respiration in macrophages
Mouse BMDMs were transfected with 20 nM control siRNA or PDK1 siRNA. 48h after transfection, the cells were seeded in Seahorse XF-24 cell culture microplates (1.5×10⁵ cells/well) for overnight. The cells were then treated sequentially with Oligo, FCCP, and Rot plus Ant. OCR at basal and maximal levels of the indicated conditions were plotted in bar graphs. * p<0.05. The experiments were performed three times with similar results obtained.

Similar articles

Cited by

References

    1. Sica A, Mantovani A. Macrophage plasticity and polarization: in vivo veritas. The Journal of clinical investigation. 2012;122:787–795. - PMC - PubMed
    1. Gordon S, Martinez FO. Alternative activation of macrophages: mechanism and functions. Immunity. 2010;32:593–604. - PubMed
    1. Mosser DM, Edwards JP. Exploring the full spectrum of macrophage activation. Nat Rev Immunol. 2008;8:958–969. - PMC - PubMed
    1. Lawrence T, Natoli G. Transcriptional regulation of macrophage polarization: enabling diversity with identity. Nat Rev Immunol. 2011;11:750–761. - PubMed
    1. Mantovani A, Biswas SK, Galdiero MR, Sica A, Locati M. Macrophage plasticity and polarization in tissue repair and remodelling. J Pathol. 2013;229:176–185. - PubMed

Publication types

MeSH terms