

Long-Term Safety of Repeated Blood-Brain Barrier Opening via Focused Ultrasound with Microbubbles in Non-Human Primates Performing a Cognitive Task
- PMID: 25945493
- PMCID: PMC4422704
- DOI: 10.1371/journal.pone.0125911
Long-Term Safety of Repeated Blood-Brain Barrier Opening via Focused Ultrasound with Microbubbles in Non-Human Primates Performing a Cognitive Task
Erratum in
-
Correction: Long-Term Safety of Repeated Blood-Brain Barrier Opening via Focused Ultrasound with Microbubbles in Non-Human Primates Performing a Cognitive Task.PLoS One. 2015 Jun 18;10(6):e0130860. doi: 10.1371/journal.pone.0130860. eCollection 2015. PLoS One. 2015. PMID: 26087322 Free PMC article. No abstract available.
Abstract
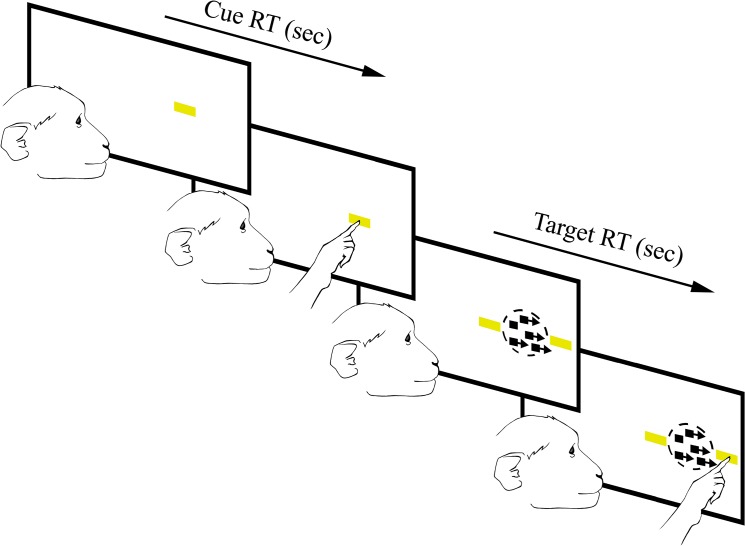
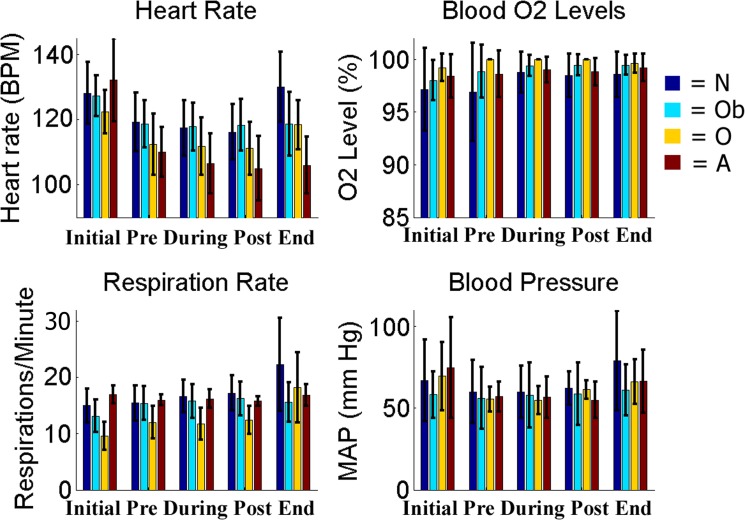
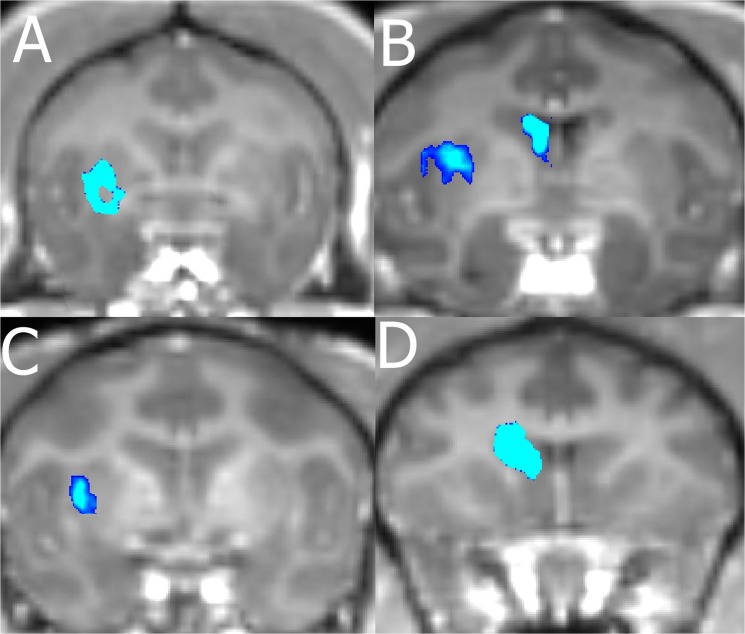
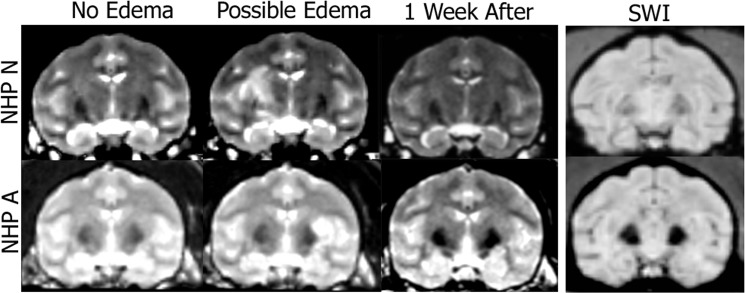
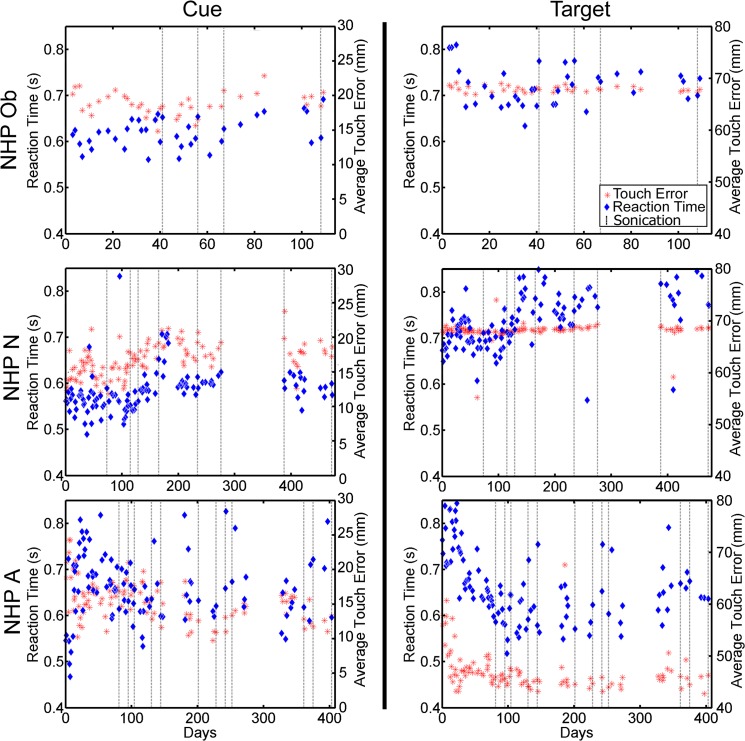
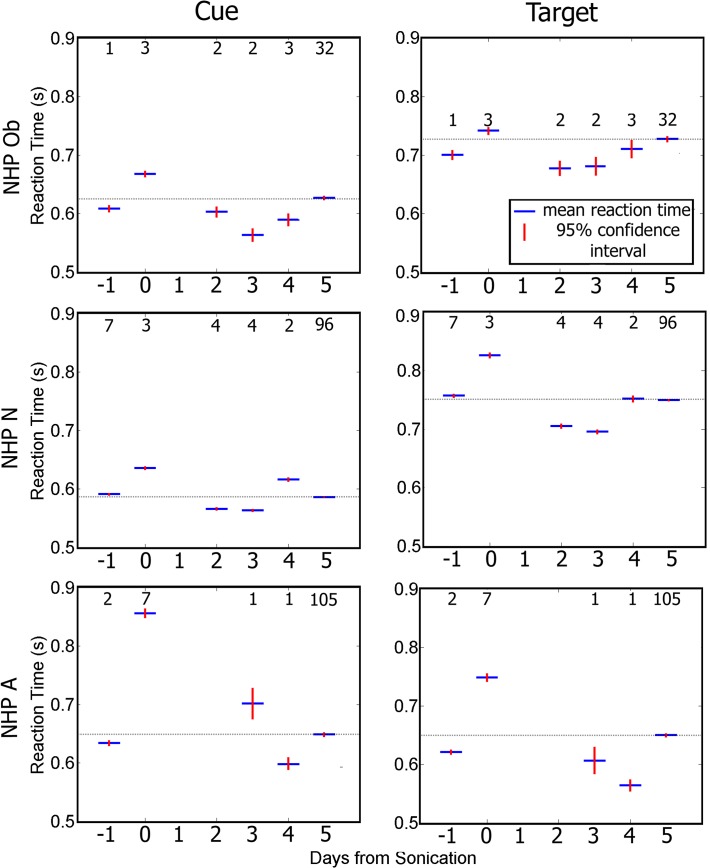
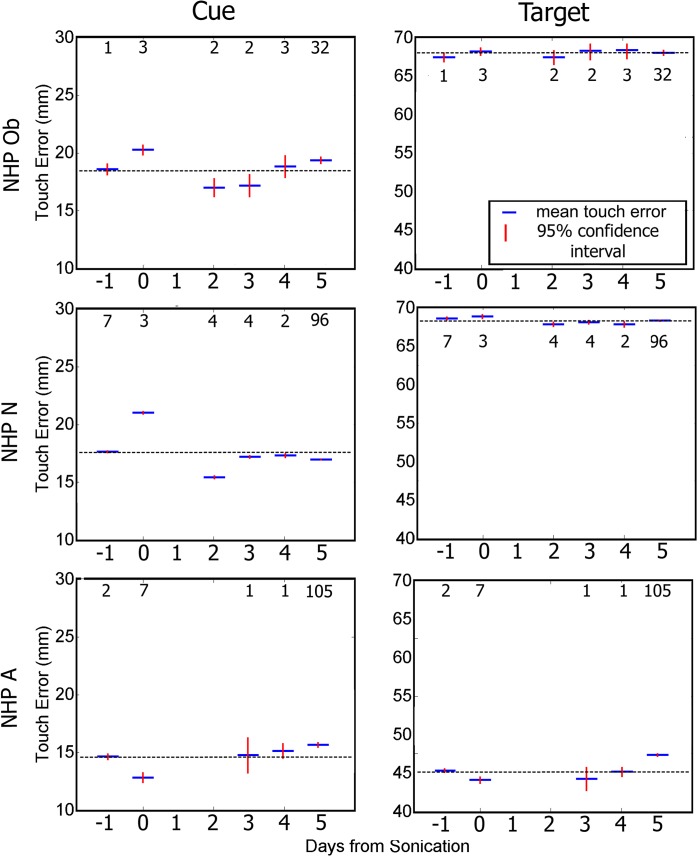
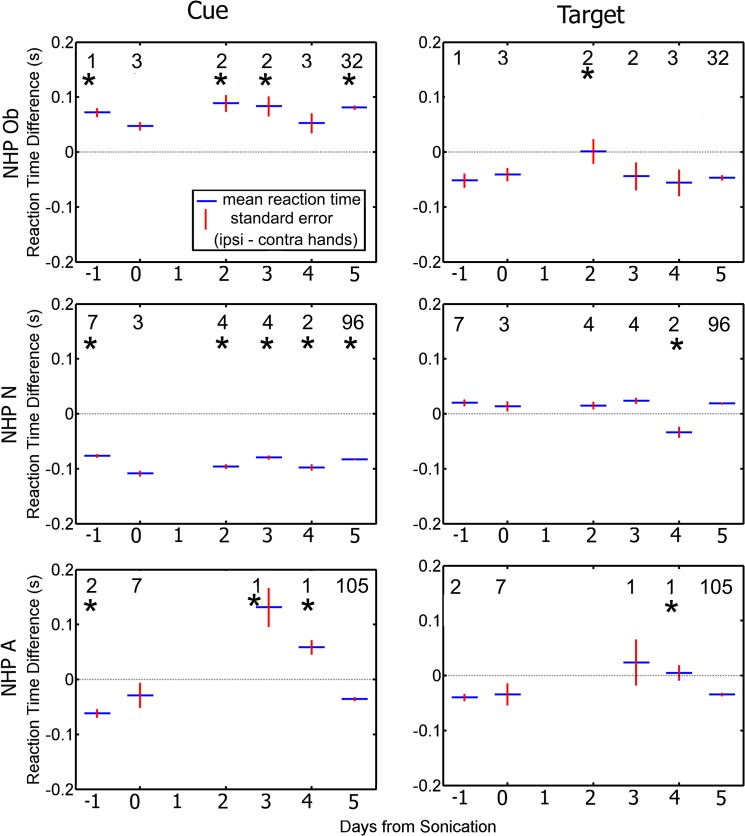
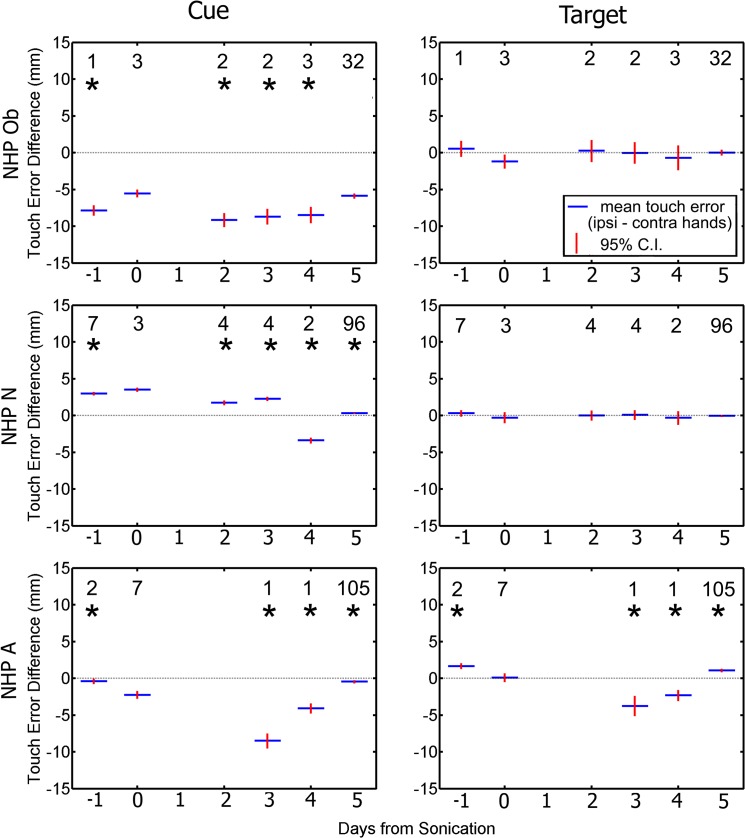
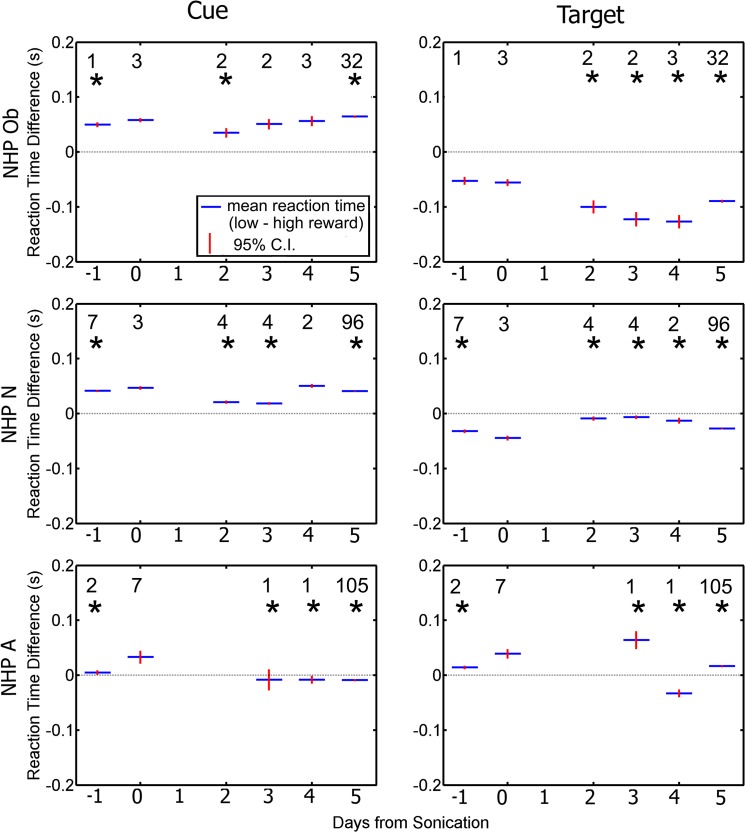
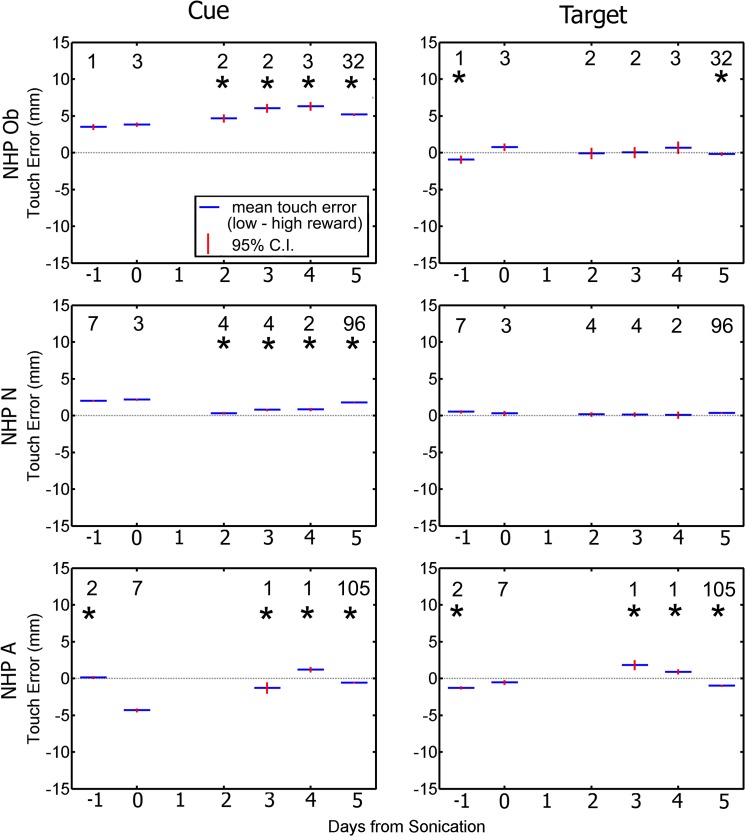
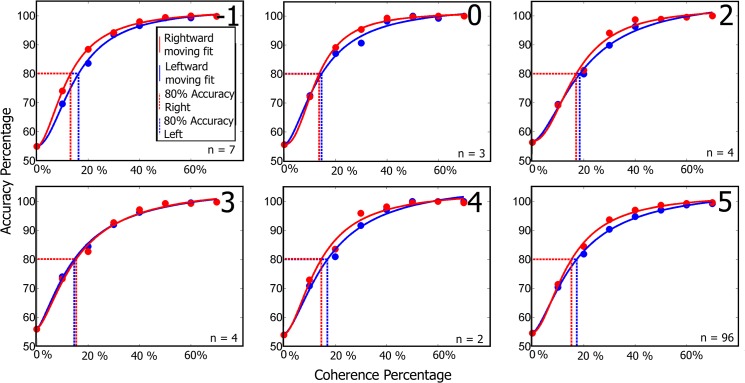
Focused Ultrasound (FUS) coupled with intravenous administration of microbubbles (MB) is a non-invasive technique that has been shown to reliably open (increase the permeability of) the blood-brain barrier (BBB) in multiple in vivo models including non-human primates (NHP). This procedure has shown promise for clinical and basic science applications, yet the safety and potential neurological effects of long term application in NHP requires further investigation under parameters shown to be efficacious in that species (500 kHz, 200-400 kPa, 4-5 μm MB, 2 minute sonication). In this study, we repeatedly opened the BBB in the caudate and putamen regions of the basal ganglia of 4 NHP using FUS with systemically-administered MB over 4-20 months. We assessed the safety of the FUS with MB procedure using MRI to detect edema or hemorrhaging in the brain. Contrast enhanced T1-weighted MRI sequences showed a 98% success rate for openings in the targeted regions. T2-weighted and SWI sequences indicated a lack edema in the majority of the cases. We investigated potential neurological effects of the FUS with MB procedure through quantitative cognitive testing of' visual, cognitive, motivational, and motor function using a random dot motion task with reward magnitude bias presented on a touchpanel display. Reaction times during the task significantly increased on the day of the FUS with MB procedure. This increase returned to baseline within 4-5 days after the procedure. Visual motion discrimination thresholds were unaffected. Our results indicate FUS with MB can be a safe method for repeated opening of the BBB at the basal ganglia in NHP for up to 20 months without any long-term negative physiological or neurological effects with the parameters used.
Conflict of interest statement
Figures
Similar articles
-
Blood-Brain Barrier Opening in Behaving Non-Human Primates via Focused Ultrasound with Systemically Administered Microbubbles.Sci Rep. 2015 Oct 26;5:15076. doi: 10.1038/srep15076. Sci Rep. 2015. PMID: 26496829 Free PMC article.
-
Feedback control of microbubble cavitation for ultrasound-mediated blood-brain barrier disruption in non-human primates under magnetic resonance guidance.J Cereb Blood Flow Metab. 2019 Jul;39(7):1191-1203. doi: 10.1177/0271678X17753514. Epub 2018 Jan 30. J Cereb Blood Flow Metab. 2019. PMID: 29381130 Free PMC article.
-
Focused ultrasound-mediated noninvasive blood-brain barrier modulation: preclinical examination of efficacy and safety in various sonication parameters.Neurosurg Focus. 2018 Feb;44(2):E15. doi: 10.3171/2017.11.FOCUS17627. Neurosurg Focus. 2018. PMID: 29385915
-
Evaluating the safety profile of focused ultrasound and microbubble-mediated treatments to increase blood-brain barrier permeability.Expert Opin Drug Deliv. 2019 Feb;16(2):129-142. doi: 10.1080/17425247.2019.1567490. Epub 2019 Jan 29. Expert Opin Drug Deliv. 2019. PMID: 30628455 Free PMC article. Review.
-
"Focused Ultrasound-mediated Drug Delivery in Humans - a Path Towards Translation in Neurodegenerative Diseases".Pharm Res. 2022 Mar;39(3):427-439. doi: 10.1007/s11095-022-03185-2. Epub 2022 Mar 7. Pharm Res. 2022. PMID: 35257286 Free PMC article. Review.
Cited by
-
A Systematic Review of Nanomedicine in Glioblastoma Treatment: Clinical Efficacy, Safety, and Future Directions.Brain Sci. 2023 Dec 18;13(12):1727. doi: 10.3390/brainsci13121727. Brain Sci. 2023. PMID: 38137175 Free PMC article. Review.
-
Stereotactic modulation of blood-brain barrier permeability to enhance drug delivery.Neuro Oncol. 2016 Dec;18(12):1601-1609. doi: 10.1093/neuonc/now137. Epub 2016 Jul 11. Neuro Oncol. 2016. PMID: 27407134 Free PMC article. Review.
-
Focused Ultrasound Strategies for Brain Tumor Therapy.Oper Neurosurg (Hagerstown). 2020 Jul 1;19(1):9-18. doi: 10.1093/ons/opz374. Oper Neurosurg (Hagerstown). 2020. PMID: 31853548 Free PMC article. Review.
-
MRI and histological evaluation of pulsed focused ultrasound and microbubbles treatment effects in the brain.Theranostics. 2018 Sep 9;8(17):4837-4855. doi: 10.7150/thno.24512. eCollection 2018. Theranostics. 2018. PMID: 30279741 Free PMC article.
-
Claudin-5 binder enhances focused ultrasound-mediated opening in an in vitro blood-brain barrier model.Theranostics. 2022 Jan 31;12(5):1952-1970. doi: 10.7150/thno.65539. eCollection 2022. Theranostics. 2022. PMID: 35265192 Free PMC article.
References
-
- Abbott NJ, Romero IA. Transporting therapeutics across the blood-brain barrier. Mol Med Today. 1996;2(3):106–113. - PubMed
-
- Habgood MD, Begley DJ, Abbott NJ. Determinants of passive drug entry into the central nervous system. Cell Mol Neurobiol. 2000;20(2):231–253. - PubMed
-
- Pardridge WM. Drug targeting to the brain. Pharm Res. 2007;24(9):1733–1744. - PubMed
-
- Drago F, Caldwell JD, Pedersen CA, Continella G, Scapagnini U, Prange AJ. Dopamine neurotransmission in the nucleus accumbens may be involved in oxytocin-enhanced grooming behavior of the rat. Pharmacol Biochem Behav. 1986;24(5):1185–1188. - PubMed
Publication types
MeSH terms
Grants and funding
LinkOut - more resources
Full Text Sources
Other Literature Sources
Miscellaneous
