. 2015 May 5;13(5):e1002142.
doi: 10.1371/journal.pbio.1002142. eCollection 2015 May.

Huntingtin Is Required for Epithelial Polarity through RAB11A-Mediated Apical Trafficking of PAR3-aPKC

Affiliations

Huntingtin Is Required for Epithelial Polarity through RAB11A-Mediated Apical Trafficking of PAR3-aPKC

Salah Elias et al. PLoS Biol. .

Abstract

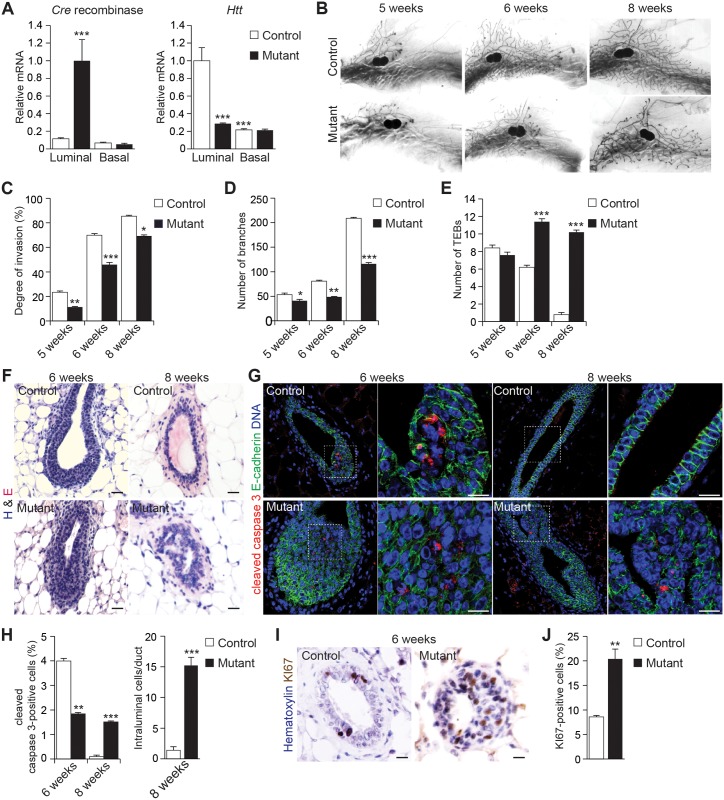
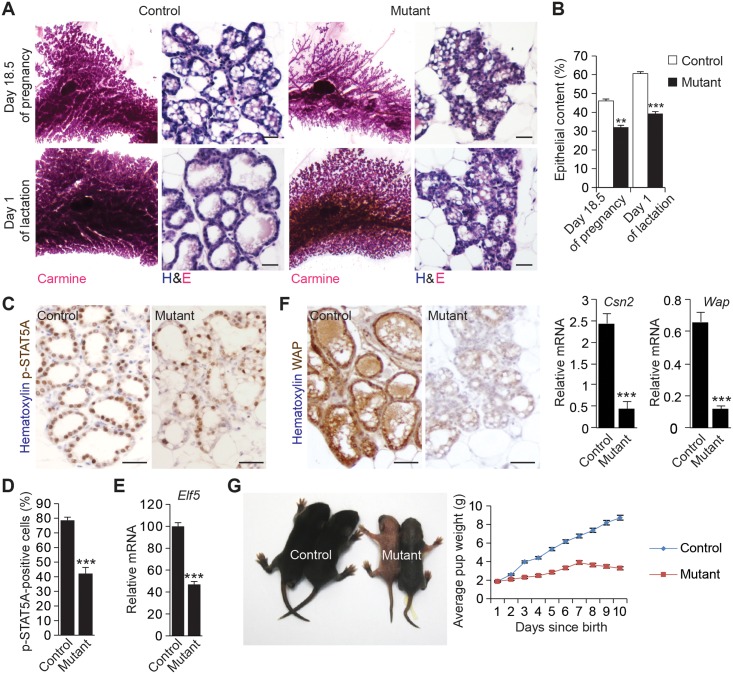
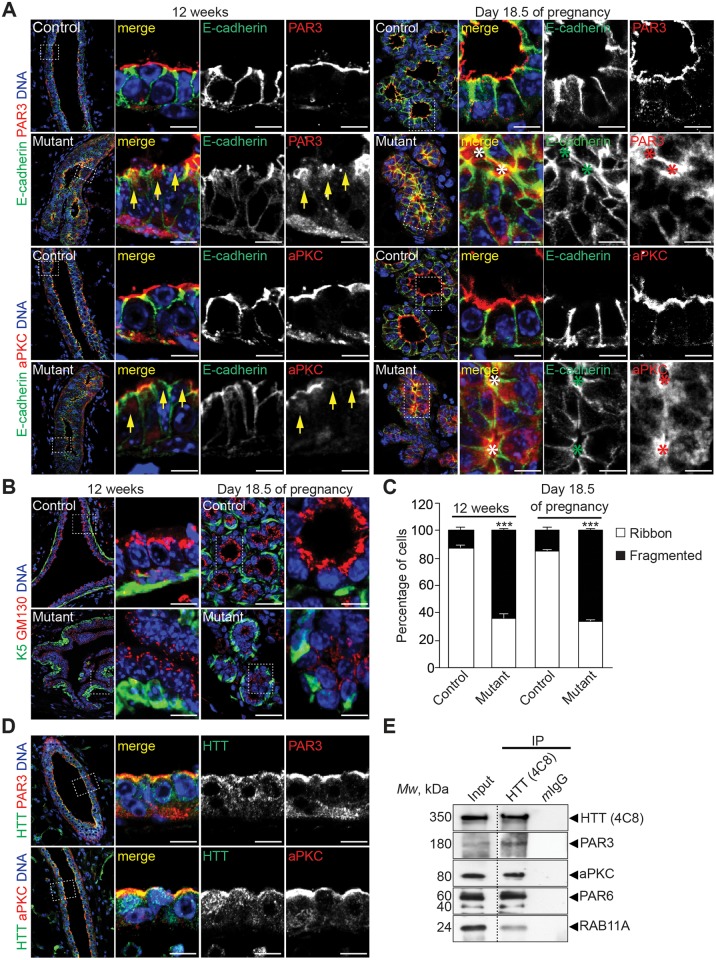
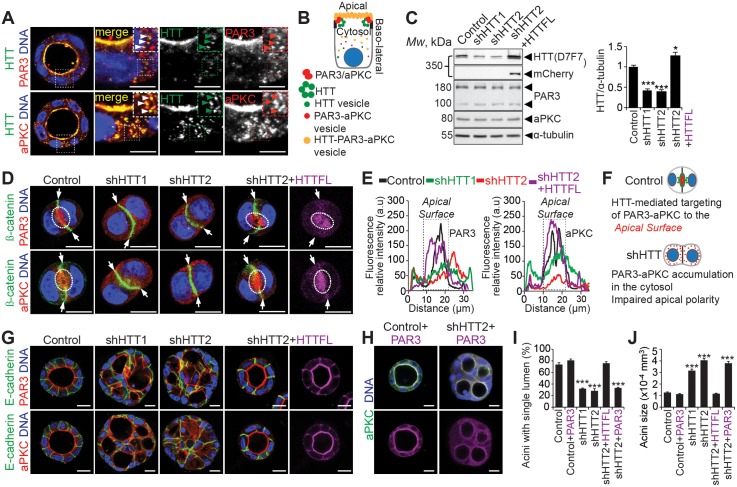
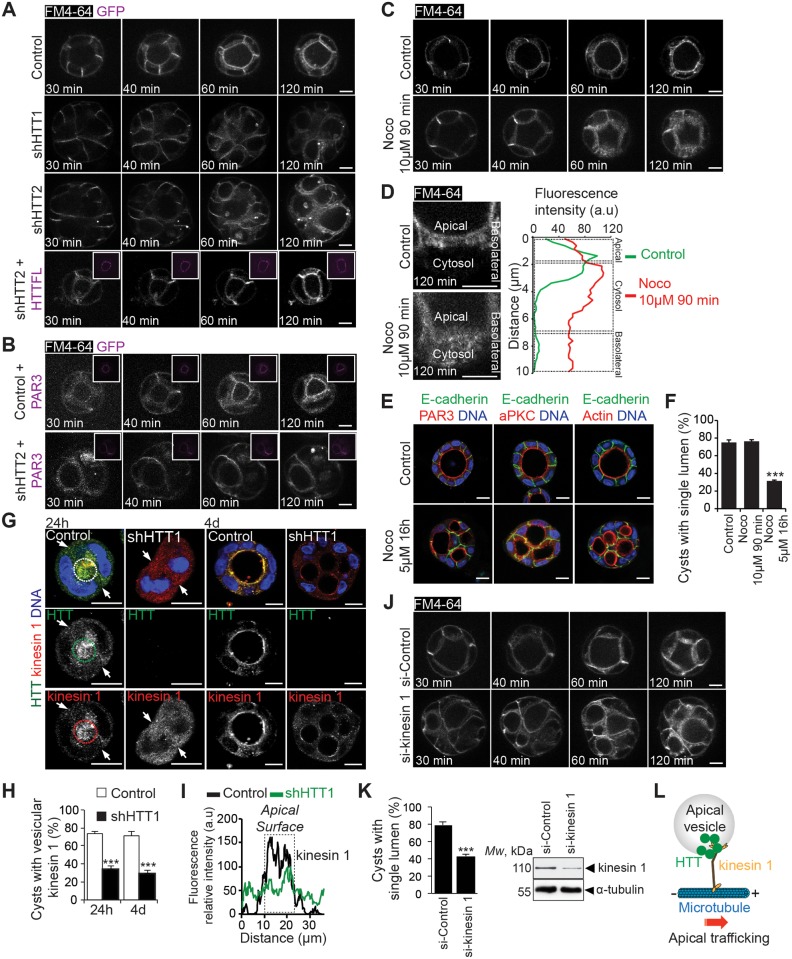
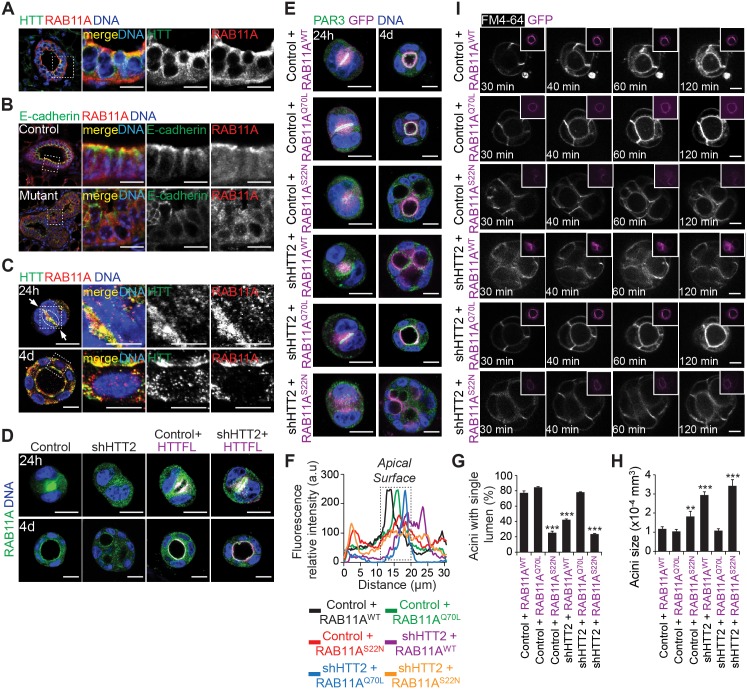
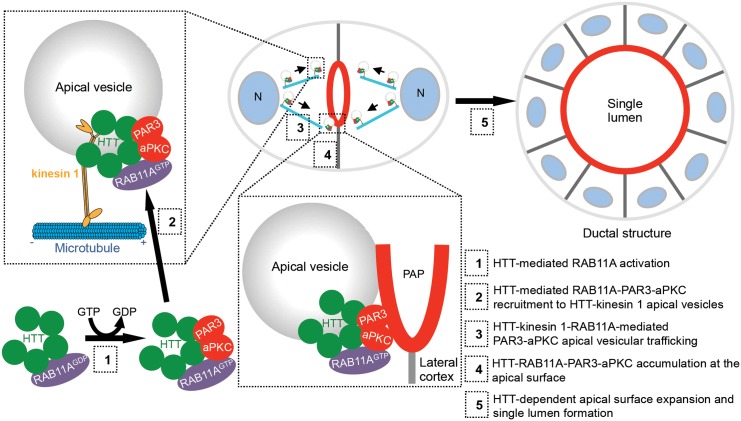
The establishment of apical-basolateral polarity is important for both normal development and disease, for example, during tumorigenesis and metastasis. During this process, polarity complexes are targeted to the apical surface by a RAB11A-dependent mechanism. Huntingtin (HTT), the protein that is mutated in Huntington disease, acts as a scaffold for molecular motors and promotes microtubule-based dynamics. Here, we investigated the role of HTT in apical polarity during the morphogenesis of the mouse mammary epithelium. We found that the depletion of HTT from luminal cells in vivo alters mouse ductal morphogenesis and lumen formation. HTT is required for the apical localization of PAR3-aPKC during epithelial morphogenesis in virgin, pregnant, and lactating mice. We show that HTT forms a complex with PAR3, aPKC, and RAB11A and ensures the microtubule-dependent apical vesicular translocation of PAR3-aPKC through RAB11A. We thus propose that HTT regulates polarized vesicular transport, lumen formation and mammary epithelial morphogenesis.


Conflict of interest statement

The authors have declared that no competing interests exist.

Figures

Fig 1
Fig 1. MMTV-driven loss of HTT affects ductal morphogenesis.
(A) Quantitative real-time RT-PCR analysis of Cre and Htt gene in basal and luminal mammary epithelial cells from 16-wk-old virgin mice. Data are presented as means obtained in three independent experiments (control: five mice per experiment, mutant: five mice per experiment). (B) Carmine-stained whole mounts of mammary glands and hematoxylin and eosin (H&E) staining. (C) Degree of ductal invasion of the fat pad in virgin mammary glands. (D) Number of branches in virgin mammary glands. (E) Number of terminal end buds (TEBs) in virgin mammary glands. (F) H&E staining of mammary gland sections. (G) Mammary gland sections stained for E-cadherin and cleaved caspase 3. (H) Percentage of cleaved caspase 3-positive cells and number of intraluminal cells per duct. (I) Mammary gland sections stained for KI67. (J) Percentage of KI67-positive cells. Number of mice analyzed are the same in C-E, H, J: control: n = 5 mice; mutant: n = 7 mice. All scale bars, 10 μm. Error bars, standard error of the mean (SEM). *p<0.05; **p<0.01; ***p<0.001. Complete statistical analyses with number of measures are detailed in S1 Data.
Fig 2
Fig 2. MMTV-driven loss of HTT affects alveolar morphogenesis.
(A) Carmine-stained whole mounts of mammary glands and hematoxylin and eosin staining (H&E). Scale bars, 50 μm. (B) Quantification of the epithelial content (control: n = 6 mice; mutant: n = 6 mice). (C) Mammary gland sections stained for p-STAT5A. Scale bars, 10 μm. (D) Percentage of p-STAT5A-positive cells (control: n = 6 mice; mutant: n = 6 mice). (E) Quantitative real-time RT-PCR analysis of Elf5 gene expression. Data are presented as means obtained in three independent experiments (control: three mice per experiment, mutant: three mice per experiment). (F) Mammary gland sections stained for WAP. Scale bars, 10 μm. The histograms show quantitative real-time RT-PCR analysis of Csn2 and Wap gene expression. The values were normalized to Krt8 expression. Data are presented as means obtained in three independent experiments (control: three mice per experiment, mutant: three mice per experiment). (G) Average weight of pups. Data are presented as means obtained in two independent experiments (control: three mice per experiment, mutant: three mice per experiment). Error bars, SEM. ** p<0.01; *** p<0.001. Complete statistical analyses with number of measures are detailed in S1 Data.
Fig 3
Fig 3. HTT is required for apical localization of PAR3 and aPKC in vivo.
(A) Mammary gland sections stained for E-cadherin and PAR3 or aPKC. Arrows indicate cytoplasmic accumulation and impaired localization of PAR3 and aPKC to the apical surface; asterisks indicate small lumens. (B) Mammary gland sections stained for keratin 5 (K5) and GM130. (C) Percentage of LCs showing ribbon-like and fragmented localization of GM130 (control: n = 4 mice; mutant: n = 4 mice). (D) Mammary gland sections stained for HTT 4C8 and PAR3 or aPKC. (E) HTT/PAR3/PAR6/aPKC/RAB11A complexes were immunoprecipitated from MCF-10A cells. Mouse IgG (mIgG) was used as a negative control. The immunoprecipitates (IP) were analyzed by western blotting. All scale bars, 10 μm. Error bars, SEM. *** p<0.001. Complete statistical analyses with number of measures are detailed in S1 Data.
Fig 4
Fig 4. HTT regulates apical vesicular trafficking of PAR3-aPKC during cystogenesis.
(A) Four-day MDCK 3-D cultures stained for HTT 4C8 and PAR3 or aPKC. Arrowheads indicate localization of HTT and PAR3 or aPKC to vesicular-like structures. Colocalization of HTT and PAR3 or aPKC is displayed in yellow (merge). (B) Illustration showing the HTT/PAR3/PAR6/aPKC complex localization on apical membrane and vesicles. (C) Western blotting of MDCK cell extracts. The histogram corresponds to the quantification of HTT levels. (D) 24 h MDCK 3-D structures stained for ß-catenin and PAR3 or aPKC. HTTFL is tagged with mCherry and staining is displayed in magenta. Arrows indicate the basolateral compartment and dashed ellipses indicate the apical surface. (E) Representative line-scan analysis (relative fluorescence intensity; at least 20 cells were analyzed per condition). (F) Illustration showing the role of HTT in PAR3-aPKC apical vesicular trafficking. (G) Four-day MDCK 3-D structures stained for E-cadherin and PAR3 or aPKC. (H) Four-day MDCK 3-D structures stained for aPKC. PAR3-GFP staining is displayed in magenta and the colocalization of aPKC and PAR3-GFP appears in white. (I) Percentage of acini with normal lumen. (J) Quantification of acini size. (I and J) Control: n = 125 acini, Control + PAR3: n = 102 acini, shHTT1: n = 149 acini, shHTT2: n = 114 acini, shHTT2 + HTT: n = 163 acini, shHTT2 + PAR3: n = 89 acini. All scale bars, 10 μm. Error bars, SEM. *** p<0.001. Complete statistical analyses with number of measures are detailed in S1 Data.
Fig 5
Fig 5. HTT regulates apical vesicular trafficking in a microtubule-dependent manner.
(A–C) FM64-4 4-day MDCK 3-D structures were video-recorded. Maximum intensity and z projections are shown. Magnifications are shown in (D) (left; 120 min). (D) Representative line-scan analysis (relative fluorescence intensity; at least 20 cells were analyzed per condition). (E) Four-day MDCK 3-D structures stained for E-cadherin and PAR3, aPKC, or F-actin. (F) Percentage of acini with normal lumen (control: n = 94 acini, Noco 10 μM 90 min: n = 67 acini, Noco 5 μM 16h: n = 72 acini). (G) Twenty-four–hour and four-day MDCK 3-D structures stained for HTT and kinesin 1. Arrows indicate the basolateral compartment, and dashed ellipses indicate the apical surface. Colocalization of HTT and kinesin 1 is displayed in yellow (merge). (H) Percentage of 3-D structures with vesicular kinesin 1 staining (control: n = 22 24h-acini and n = 26 day 4-acini, shHTT1: n = 25 24h-acini and n = 25 day 4-acini). (I) Representative line-scan analysis (relative fluorescence intensity; at least 20 cells were analyzed per condition). (J) FM64-4 4-day MDCK 3-D structures were video-recorded. Maximum intensity and z projections are shown. (K) Left: percentage of acini with normal lumen (si-Control: n = 30 acini, si-kinesin 1: n = 28 acini), right: western blotting of MDCK cell extracts. (L) Illustration showing HTT and kinesin 1 during microtubule-dependent apical vesicular trafficking. All scale bars, 10 μm. Error bars, SEM. *** p<0.001. Complete statistical analyses with number of measures are detailed in S1 Data.
Fig 6
Fig 6. HTT colocalizes with RAB11A and regulates RAB11A activity during apical vesicular trafficking.
(A) Mammary gland section stained for HTT 4C8 and RAB11A. (B) Mammary gland section stained for E-cadherin and RAB11A. (C) Twenty-four–hour and four-day MDCK 3-D cultures stained for HTT 4C8 and RAB11A. Colocalization of HTT and RAB11A is displayed in yellow (merge). (D) Twenty-four–hour and four-day MDCK 3-D cultures stained for RAB11A. HTTFL is tagged with mCherry and fluorescence is displayed in magenta and the colocalization of RAB11A and HTTFL appears in white. (E) Twenty-four–hour and four-day MDCK 3-D cultures transfected with RAB11AWT, RAB11AQ70L or RAB11AS22N, stained for PAR3. RAB11 is tagged with GFP and fluorescence is displayed in magenta. The colocalization of aPKC and RAB11A appears in white. (F) Representative line-scan analysis (relative fluorescence intensity; at least 20 cells were analyzed per condition). (G) Percentage of acini with normal lumen. (H) Quantification of acini size. (G and H) Control+RAB11AWT: n = 59 acini, Control+RAB11AQ70L: n = 54 acini, Control+RAB11AS22N: n = 66 acini, shHTT2+RAB11AWT: n = 60 acini, shHTT2+RAB11AQ70L: n = 72 acini, shHTT2+RAB11AS22N: n = 93 acini. (I) FM64-4 4-day MDCK 3-D structures were video recorded. Maximum intensity and z projections are shown. All scale bars, 10 μm. Error bars, SEM. ** p<0.01; *** p<0.001. Complete statistical analyses with number of measures are detailed in S1 Data.
Fig 7
Fig 7. Model for HTT-mediated regulation of apical polarity.
During epithelial morphogenesis, HTT modulates the activation of RAB11A (1). HTT-RAB11A forms a complex with PAR3-aPKC, which may be recruited to HTT-kinesin 1 apical vesicles (2). HTT coordinates apical recycling of PAR3-aPKC vesicles (3). PAR3-aPKC accumulation at the pre-apical patches (PAP) (4) triggers the expansion of the apical membrane, leading to the formation of a central lumen (5).

Similar articles

Cited by

References

    1. Datta A, Bryant DM, Mostov KE Molecular regulation of lumen morphogenesis. Curr Biol. 2011;21: R126–136. 10.1016/j.cub.2010.12.003 - DOI - PMC - PubMed
    1. Weisz OA, Rodriguez-Boulan E Apical trafficking in epithelial cells: signals, clusters and motors. J Cell Sci. 2009;122: 4253–4266. 10.1242/jcs.032615 - DOI - PMC - PubMed
    1. Rodriguez-Fraticelli AE, Galvez-Santisteban M, Martin-Belmonte F Divide and polarize: recent advances in the molecular mechanism regulating epithelial tubulogenesis. Curr Opin Cell Biol. 2011;23: 638–646. 10.1016/j.ceb.2011.07.002 - DOI - PubMed
    1. Martin-Belmonte F, Mostov K Regulation of cell polarity during epithelial morphogenesis. Curr Opin Cell Biol. 2008;20: 227–234. 10.1016/j.ceb.2008.01.001 - DOI - PubMed
    1. Bilder D PDZ domain polarity complexes. Curr Biol. 2003;13: R661–662. - PubMed

Publication types

Grants and funding

Agence Nationale pour la Recherche - Maladies Rares (ANR-09-BLAN-0080, S.H). http://www.agence-nationale-recherche.fr. Association pour la Recherche sur le Cancer (ARC subvention libre n°3188, SH) (http://www.fondation-arc.org). Fondation pour la Recherche Médicale (FRM, équipe labellisée, SH) (http://www.frm.org). Cancéropôle Ile de France (2013-1-PL BIO-02-ICR-1, SH) (http://www.canceropole-idf.fr/). CNRS (SH), INSERM (SH) and Institut Curie (SH) (http://www.cnrs.fr, http://www.inserm.fr, http://www.institut-curie.org/?prehome=0). The funders had no role in study design, data collection and analysis, decision to publish, or preparation of the manuscript.