

Anti-obese effect of glucosamine and chitosan oligosaccharide in high-fat diet-induced obese rats
- PMID: 25942093
- PMCID: PMC4446603
- DOI: 10.3390/md13052732
Anti-obese effect of glucosamine and chitosan oligosaccharide in high-fat diet-induced obese rats
Abstract
Objective: This study is to evaluate the anti-obese effects of glucosamine (GLC) and chitosan oligosaccharide (COS) on high-fat diet-induced obese rats.
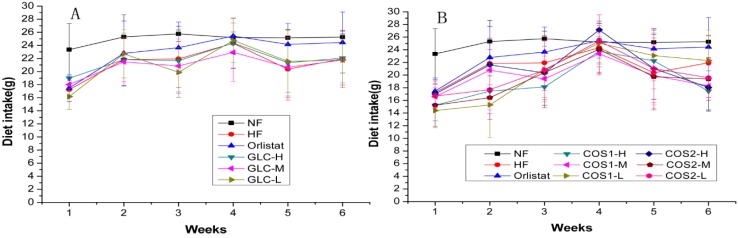
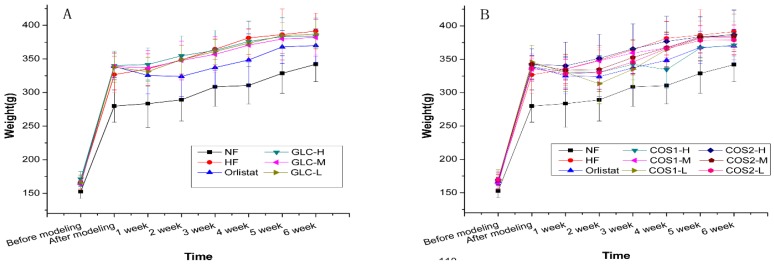
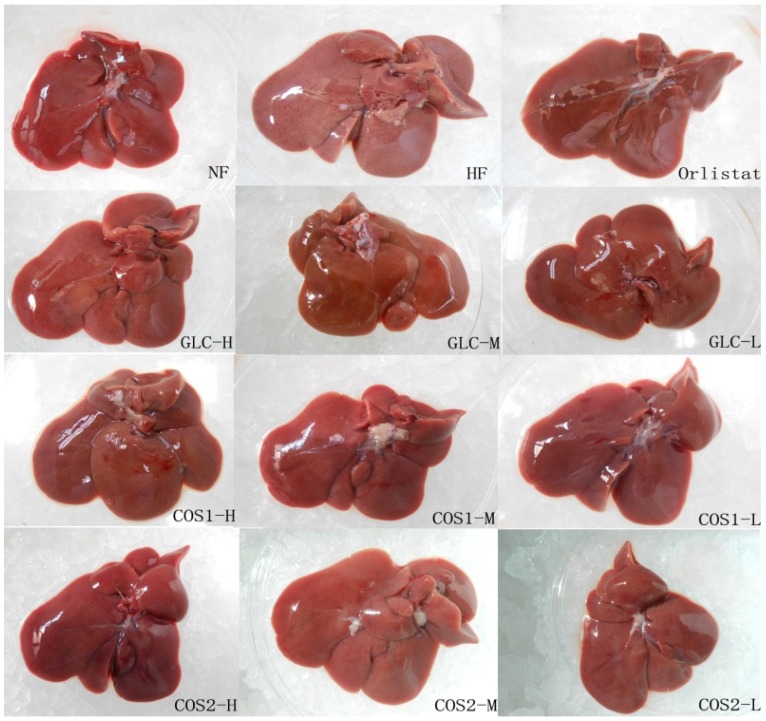
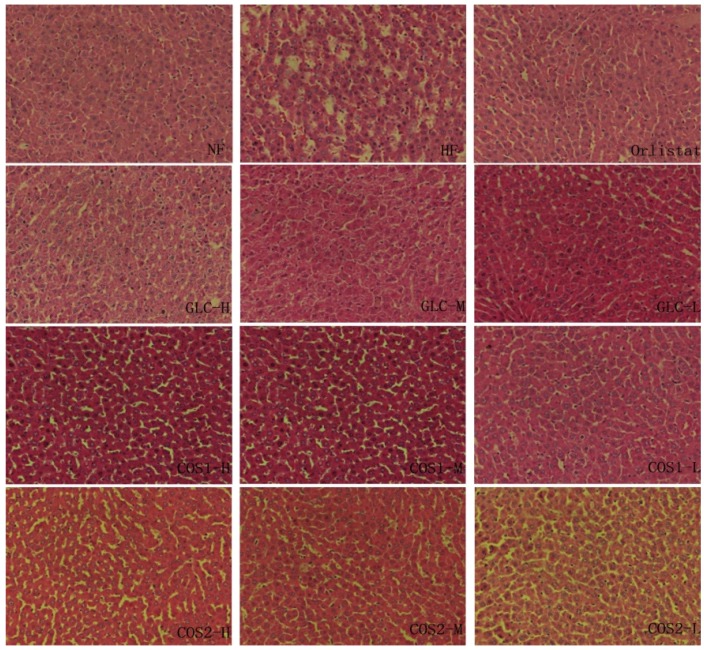
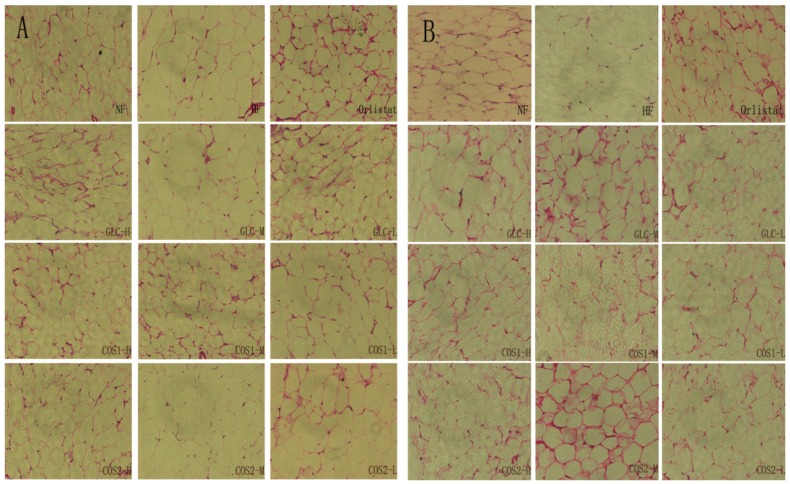
Methods: The rats were randomly divided into twelve groups: a normal diet group (NF), a high-fat diet group (HF), Orlistat group, GLC high-, middle-, and low-dose groups (GLC-H, GLC-M, GLC-L), COS1 (COS, number-average molecular weight ≤1000) high-, middle-, and low-dose groups (COS1-H, COS1-M, COS1-L), and COS2 (COS, number-average molecular weight ≤3000) high-, middle-, and low-dose groups (COS2-H, COS2-M, COS2-L). All groups received oral treatment by gavage once daily for a period of six weeks.
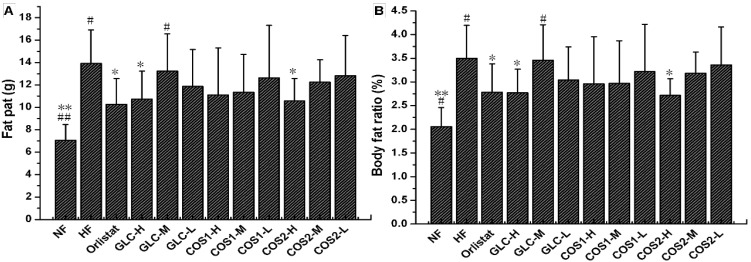
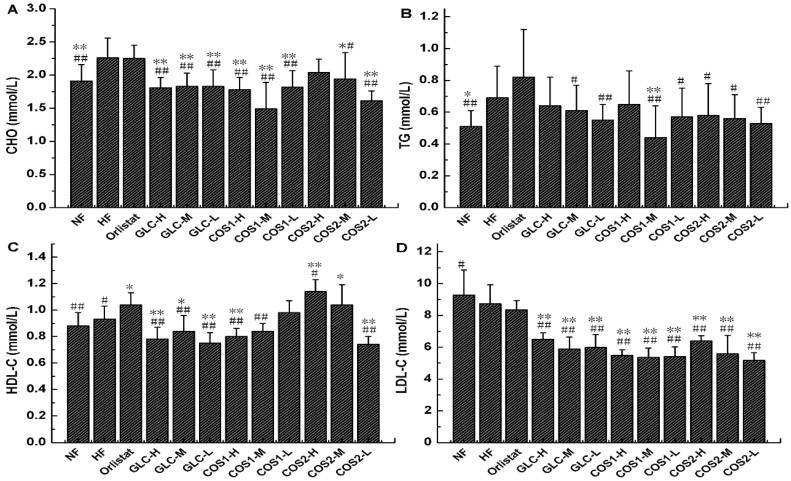
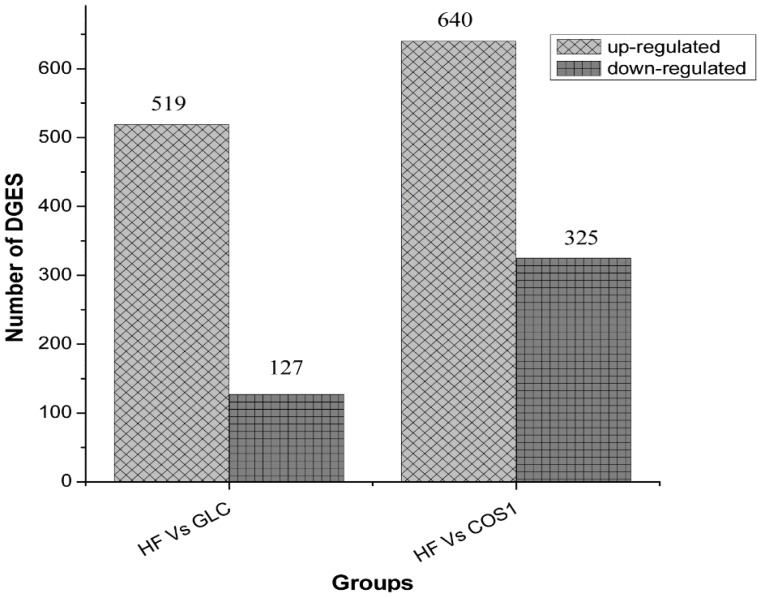
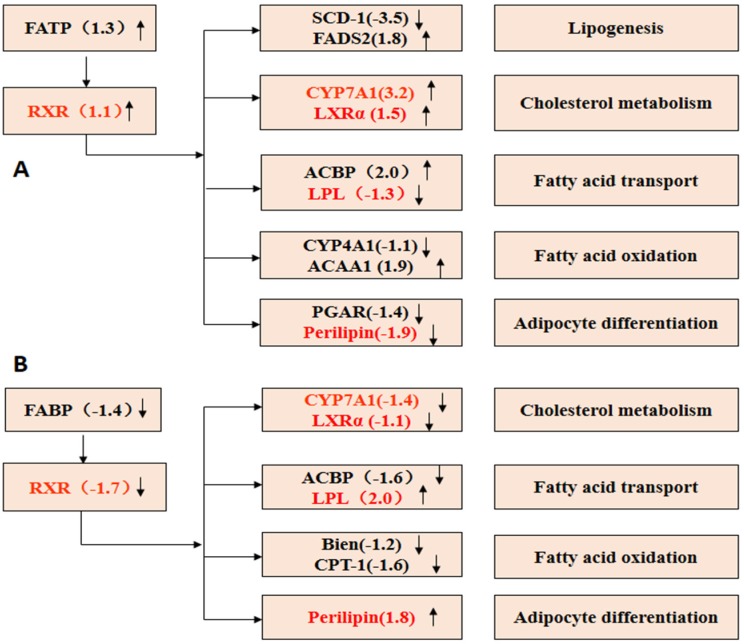
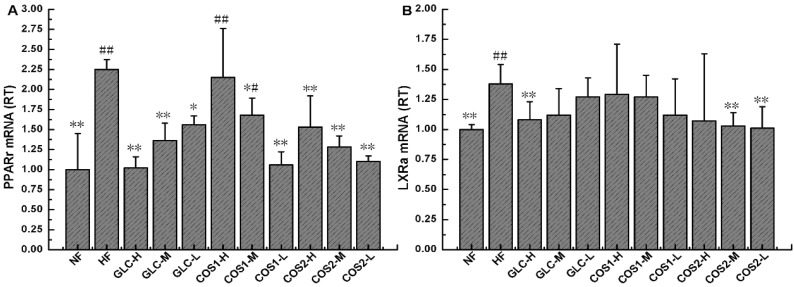
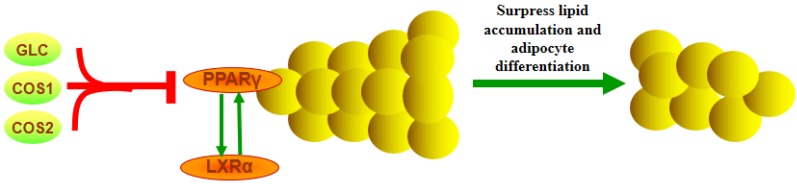
Results: Rats fed with COS1 gained the least weight among all the groups (P < 0.01), and these rats lost more weight than those treated with Orlistat. In addition to the COS2-H and Orlistat groups, the serum total cholesterol (CHO) and low-density lipoprotein cholesterol (LDL-C) levels were significantly reduced in all treatment groups compared to the HF group (P < 0.01). The various doses of GLC, COS1 and COS2 reduced the expression levels of PPARγ and LXRα mRNA in the white adipose tissue.
Conclusions: The results above demonstrated that GLC, COS1, and COS2 improved dyslipidemia and prevented body weight gains by inhibiting the adipocyte differentiation in obese rats induced by a high-fat diet. Thus, these agents may potentially be used to treat obesity.
Figures

Similar articles
-
Anti-Obesity Effect of Chitosan Oligosaccharide Capsules (COSCs) in Obese Rats by Ameliorating Leptin Resistance and Adipogenesis.Mar Drugs. 2018 Jun 5;16(6):198. doi: 10.3390/md16060198. Mar Drugs. 2018. PMID: 29874843 Free PMC article.
-
Dietary D-psicose reduced visceral fat mass in high-fat diet-induced obese rats.J Food Sci. 2012 Feb;77(2):H53-8. doi: 10.1111/j.1750-3841.2011.02571.x. J Food Sci. 2012. PMID: 22339545
-
Chitooligosaccharide ameliorates diet-induced obesity in mice and affects adipose gene expression involved in adipogenesis and inflammation.Nutr Res. 2012 Mar;32(3):218-28. doi: 10.1016/j.nutres.2012.02.004. Nutr Res. 2012. PMID: 22464809
-
Chitosan oligosaccharide (COS): An overview.Int J Biol Macromol. 2019 May 15;129:827-843. doi: 10.1016/j.ijbiomac.2019.01.192. Epub 2019 Jan 29. Int J Biol Macromol. 2019. PMID: 30708011 Review.
-
The Role of Chitosan Oligosaccharide in Metabolic Syndrome: A Review of Possible Mechanisms.Mar Drugs. 2021 Sep 1;19(9):501. doi: 10.3390/md19090501. Mar Drugs. 2021. PMID: 34564163 Free PMC article. Review.
Cited by
-
A review on shellfish polysaccharides: Extraction, characterization and amelioration of metabolic syndrome.Front Nutr. 2022 Sep 13;9:974860. doi: 10.3389/fnut.2022.974860. eCollection 2022. Front Nutr. 2022. PMID: 36176638 Free PMC article. Review.
-
Influence of Degree of Polymerization of Low-Molecular-Weight Chitosan Oligosaccharides on the α-Glucosidase Inhibition.Molecules. 2022 Nov 22;27(23):8129. doi: 10.3390/molecules27238129. Molecules. 2022. PMID: 36500221 Free PMC article.
-
Therapeutic Effect of Chitooligosaccharide Tablets on Lipids in High-Fat Diets Induced Hyperlipidemic Rats.Molecules. 2019 Jan 31;24(3):514. doi: 10.3390/molecules24030514. Molecules. 2019. PMID: 30709014 Free PMC article.
-
Determination of the Deacetylation Degree of Chitooligosaccharides.Mar Drugs. 2017 Oct 25;15(11):332. doi: 10.3390/md15110332. Mar Drugs. 2017. PMID: 29068401 Free PMC article.
-
Potential Medical Applications of Chitooligosaccharides.Polymers (Basel). 2022 Aug 29;14(17):3558. doi: 10.3390/polym14173558. Polymers (Basel). 2022. PMID: 36080631 Free PMC article. Review.
References
-
- WHO Obesity: Preventing and managing the global epidemic. Report of a WHO consultation. World Health Organ. Tech. Rep. Ser. 2000;894:1–253. - PubMed
-
- Low S., Chin M.C., Deurenberg-Yap M. Review on epidemic of obesity. Ann. Acad. Med. Singap. 2009;38:57–59. - PubMed
-
- Lee S.O., Simons A.L., Murphy P.A., Hendrich S. Soyasaponins lowered plasma cholesterol and increased fecal bile acids in female golden Syrian hamsters. Exp. Biol. Med. (Maywood) 2005;230:472–478. - PubMed
Publication types
MeSH terms
Substances
LinkOut - more resources
Full Text Sources
Other Literature Sources
Medical
Research Materials
Miscellaneous
