. 2015 May 1;29(9):934-47.
doi: 10.1101/gad.258350.115.

Loss of the RNA polymerase III repressor MAF1 confers obesity resistance

Affiliations

Loss of the RNA polymerase III repressor MAF1 confers obesity resistance

Nicolas Bonhoure et al. Genes Dev. .

Abstract

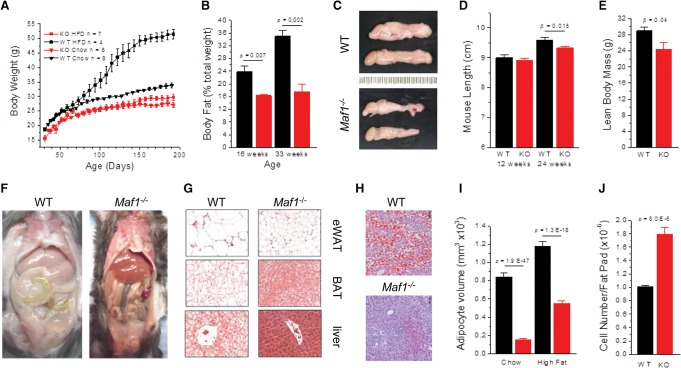
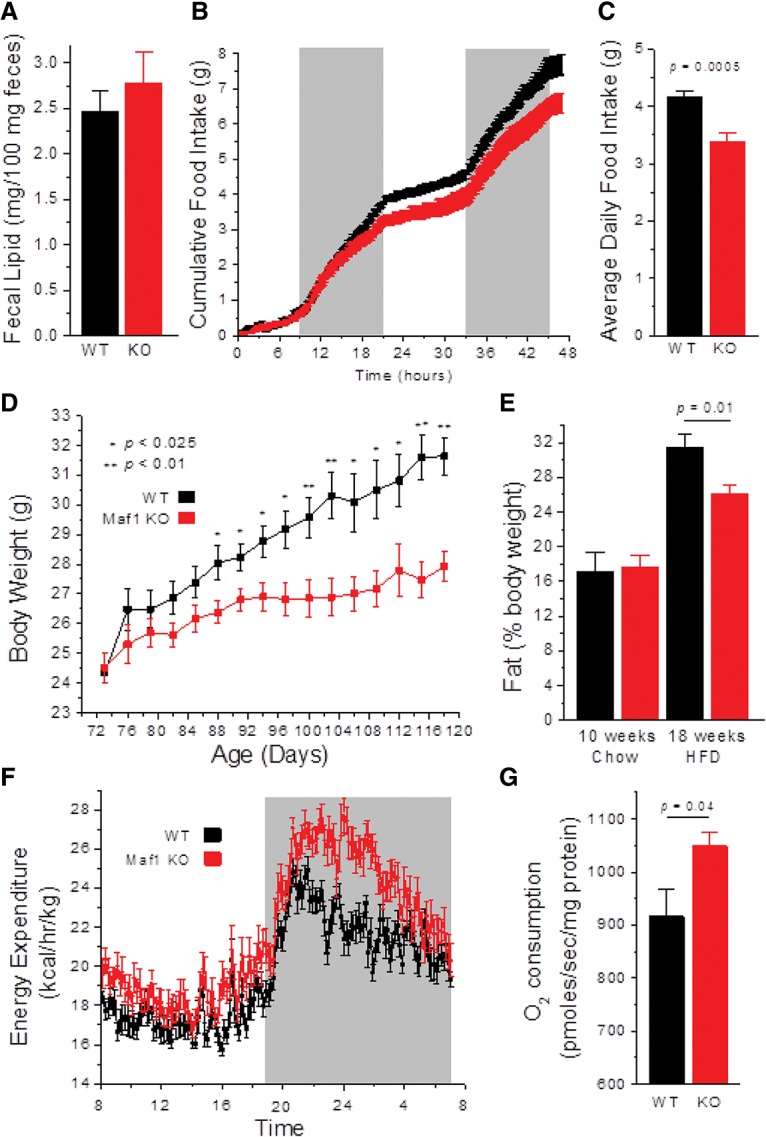
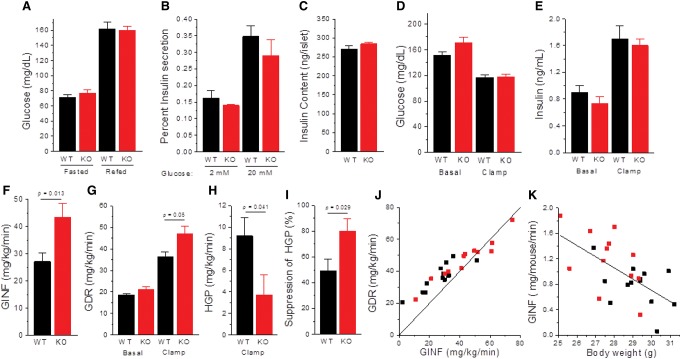
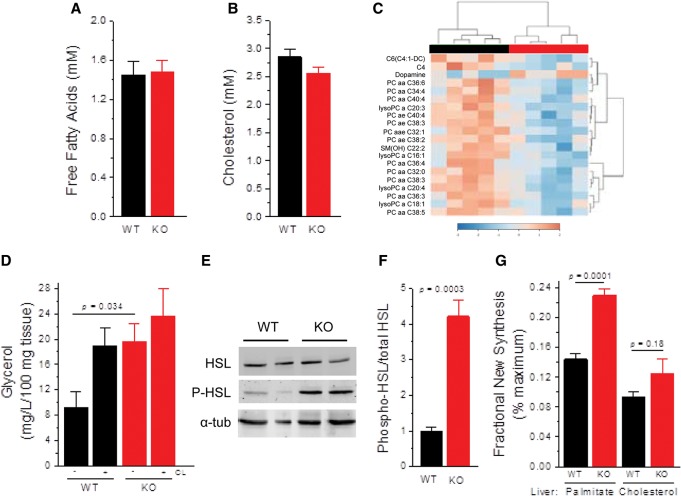
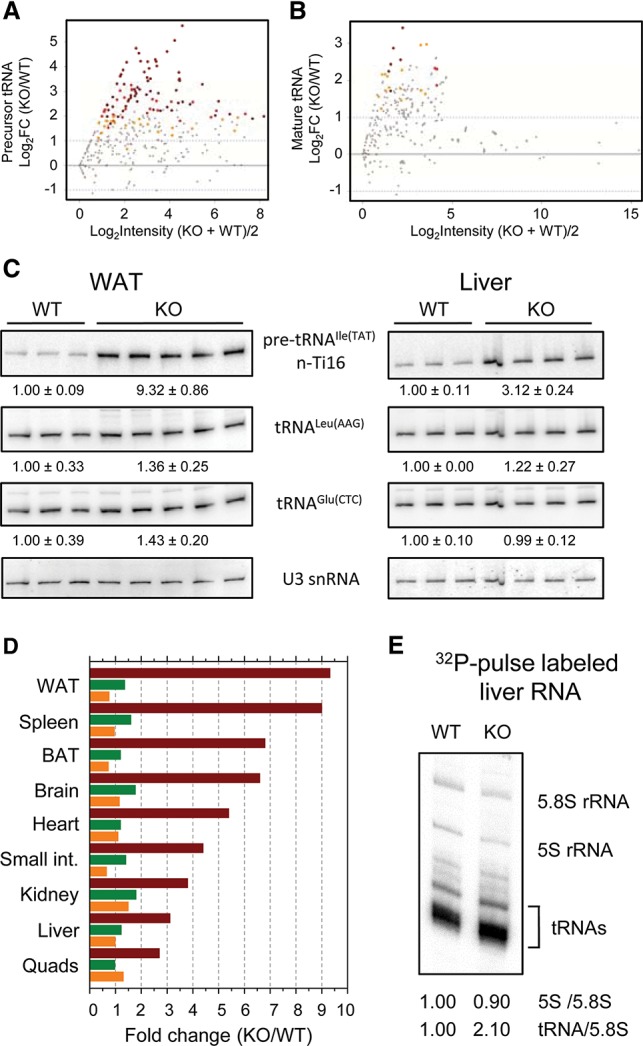
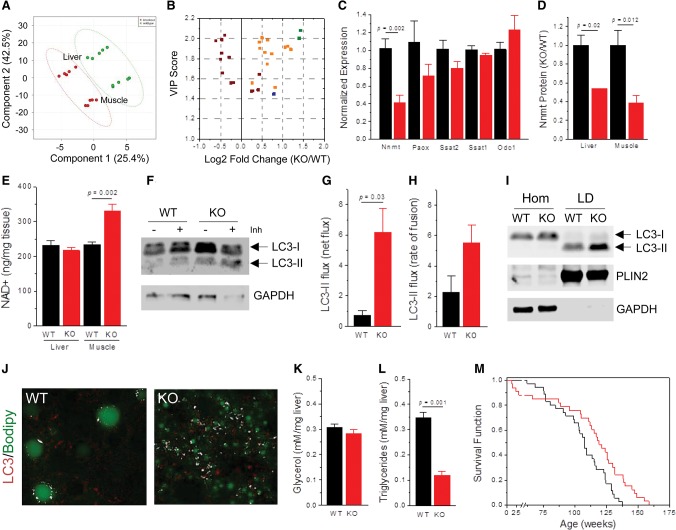
MAF1 is a global repressor of RNA polymerase III transcription that regulates the expression of highly abundant noncoding RNAs in response to nutrient availability and cellular stress. Thus, MAF1 function is thought to be important for metabolic economy. Here we show that a whole-body knockout of Maf1 in mice confers resistance to diet-induced obesity and nonalcoholic fatty liver disease by reducing food intake and increasing metabolic inefficiency. Energy expenditure in Maf1(-/-) mice is increased by several mechanisms. Precursor tRNA synthesis was increased in multiple tissues without significant effects on mature tRNA levels, implying increased turnover in a futile tRNA cycle. Elevated futile cycling of hepatic lipids was also observed. Metabolite profiling of the liver and skeletal muscle revealed elevated levels of many amino acids and spermidine, which links the induction of autophagy in Maf1(-/-) mice with their extended life span. The increase in spermidine was accompanied by reduced levels of nicotinamide N-methyltransferase, which promotes polyamine synthesis, enables nicotinamide salvage to regenerate NAD(+), and is associated with obesity resistance. Consistent with this, NAD(+) levels were increased in muscle. The importance of MAF1 for metabolic economy reveals the potential for MAF1 modulators to protect against obesity and its harmful consequences.

Keywords: MAF1; RNA polymerase III; autophagy; futile cycling; metabolic efficiency; obesity; polyamines.


Figures

Figure 1.
Figure 1.
Maf1−/− mice exhibit resistance to diet-induced obesity and fatty liver disease. (A) Body weight curves of wild-type (WT) and Maf1−/− (KO) animals on chow diets and HFDs. (B) Fat mass as a percentage body weight for chow-fed mice at 16 and 33 wk (n = 3 per group). (C) Epididymal fat pads harvested from chow-fed wild-type and Maf1−/− mice at 5 mo of age. Images are oriented with the testes to the left. (D) Nose to anus body length of chow-fed mice (n = 8 per group at 3 mo; n = 19 per group at 6 mo of age). (E) Lean body mass of chow-fed mice at 12 mo of age (n = 5 wild type; n = 4 knockout). (F) Gross pathology of 7-mo-old HFD-fed mice (representative of three animals per group). (G) Hematoxylin and eosin (H&E)-stained eWAT, BAT, and livers from the HFD-fed mice in F. Images are at the same magnification. (H) Oil-Red-O staining of livers from 12-mo-old chow-fed mice. (I) Estimation of adipocyte cell volumes for mice on chow-fed diets versus HFDs (see also Supplemental Fig. S1G). (J) eWAT fat pad cell counts for 12-mo-old chow-fed mice (n = 5 per group). (Black) Wild-type; (red) Maf1−/−. All values are presented as the mean ± SEM.
Figure 2.
Figure 2.
Hypophagia and metabolic inefficiency of Maf1−/− mice. (A) Fecal lipid content of chow-fed mice (n = 4 per group). (B) Two-day cumulative food intake of weight-matched chow-fed mice (n = 4 per group). (C) Daily food intake of weight-matched mice averaged over 5 d. (D) Body weight curves of pair-fed mice on a HFD (n = 5 per group). (E) Percent body fat before and after 8 wk of HFD pair feeding (n = 5 per group). (F) Energy expenditure in HFD pair-fed animals (24-h averages over 5 d in metabolic cages; n = 4 per group; mice were 18 wk of age). (G) Oxygen consumption from mitochondrial complex 2 was measured on liver homogenates from HFD-fed mice (n = 8 per group). (Black) Wild-type (WT); (red) Maf1−/− (KO). All values are presented as the mean ± SEM.
Figure 3.
Figure 3.
Blood glucose, insulin secretion, and analysis of insulin sensitivity. (A) Blood glucose concentrations were determined from tail vein bleeds after an overnight fast and following a 4-h refeed. Mice were 4 mo of age and were maintained on a breeder chow diet. (n = 7 mice per group). (B) Insulin secretion ex vivo was assayed in the presence of 2 mM and 20 mM glucose (five islets per well; n = 8 per condition per genotype; chow diet). Results are expressed as a percentage of the total insulin content of the islets used in the assay. (C) Insulin content of islets was calculated from five islets per sample (n = 16 per group). (DK) Hyperinsulinemic–euglycemic clamp analysis of insulin sensitivity in 5-h-fasted mice. (D) Plasma glucose levels before and during the clamp. (E) Plasma insulin levels before and during the clamp. (F) Glucose infusion (GINF) rate needed to maintain euglycemia. (G) Glucose disposal rate (GDR) before and during the clamp was measured by the tracer dilution technique using [3-3H]glucose as tracer. (H) Hepatic glucose production (HGP) during the clamp. (I) Suppression of hepatic glucose production was calculated as the difference in HGP in the basal state (=basal GDR) and during the clamp divided by the basal HGP. (J) Rates of glucose disposal versus glucose infusion are shown for all of the mice in the study relative to a line with a slope of 1. HGP is the vertical difference between each data point and the line. (K) Glucose infusion rate (insulin sensitivity) is inversely correlated with the body weight of the mice. A linear fit is shown to all of the data. All values are presented as the mean ± SEM. Clamp data in DK were obtained from 13 wild-type and 12 Maf1−/− mice. (Black) Wild type (WT); (red) Maf1−/− (KO).
Figure 4.
Figure 4.
Altered lipid metabolism in Maf1−/− mice. (A,B) Serum-free fatty acids and serum cholesterol were measured in overnight-fasted mice maintained on a standard chow diet (n = 6 per group). (C) Hierarchical clustering of plasma metabolite profiles from Biocrates AbsoluteIDQ p180 analysis performed with mice on a breeder chow diet. The top 20 metabolites by t-test (P < 0.025) were clustered using Pearson's correlation to measure similarity and Ward's linkage to minimize the sum of the squares of the clusters (MetaboAnalyst) (see also Supplemental Figure S4 and Supplemental Table S1). (D) Lipolysis in eWAT explants from mice on a breeder chow diet. Glycerol release in explants was measured in the presence and absence of the β3-adrenergic receptor agonist CL-316,243 (CL, n = 8 for wild-type under both treatments; n = 7 for untreated Maf1−/−; n = 4 for CL-316,243-treated Maf1−/− explants). (E) Western blot of phospho-HSL (P-HSL) and total HSL from eWAT. (F) Quantitation of activated phospho-HSL over total HSL in eWAT (wild type, n = 8; Maf1−/−, n = 7; breeder chow diet). (G) De novo lipogenesis and cholesterol synthesis in livers from mice on a breeder chow diet were measured by tracer enrichment after 5 d of receiving 6% D2O in drinking water (n = 5 per group). All values are presented as the mean ± SEM.
Figure 5.
Figure 5.
Futile cycling of tRNAs as a mechanism for energy expenditure. (A) Log ratio versus abundance (MA plot) of uniquely mapped precursor tRNA-specific RNA-seq reads in eWAT of breeder chow-fed mice (n = 3 per group). Yellow and red dots correspond to loci exhibiting significant changes called by limma or GLM, respectively. Brown dots correspond to loci with significant changes called by both methods. Gray dots correspond to loci with scores that are not statistically different. (B) MA plot of uniquely mapped mature tRNA reads in eWAT. The color scheme is the same as in A. (C) Northern blots of precursor and mature tRNA species from the eWAT and livers of breeder chow-fed mice. The fold change normalized to U3 snRNA is shown below each panel. (D) Precursor tRNAIle (TAT) n-Ti16 (maroon), mature tRNALeu (AAG) (green), and mature tRNAiMet (CAT) (orange) levels were surveyed by Northern analysis in the indicated tissues of breeder chow-fed mice. The fold change was normalized to U3 snRNA. (E) Newly synthesized 5.8 S rRNA, 5S rRNA, and tRNAs from breeder chow-fed mice were quantified in total liver RNA following i.p. injection of 32P-orthophosphate and labeling for 4 h.
Figure 6.
Figure 6.
Elevated amino acid and polyamine levels in Maf1−/− tissues correlate with induction of autophagy and life span extension. (A) Two-dimensional score plot of principal components from PLS-DA of liver and skeletal muscle metabolite profiles from mice on a breeder chow diet. The variance explained by each component is in brackets. Ellipses define regions of 95% confidence. (Green) Wild type (WT); (red) knockout (KO). (B) VIP scores (>1.0 is considered significant) obtained by PLS-DA are plotted against the fold change in metabolite concentration (normalized per milligram of tissue) in quadriceps. All metabolites had P-values <0.05 (n = 5 per group). (Green) Putrescine and spermidine; (orange) amino acids; (maroon) glycerolphospholipids; (blue) C5 acylcarnitine. (C) RT-qPCR analysis of polyamine pathway gene expression in the livers (n = 5 per group) of chow-fed mice. (D) Normalized NNMT protein levels from Supplemental Figure 6, C and D (n = 3 per group, chow-fed mice). (E) NAD+ levels in the liver and quadriceps as determined by LC-MS (n = 5 per group, breeder chow-fed mice). (F) Examination of autophagic flux in liver explants from mice on a breeder chow diet. The level of LC3-II, the lipidated autophagosome-associated form of LC3, was monitored in the presence or absence of lysosomal inhibitors (Inh). A representative blot is shown from three biological replicates per genotype. (G) Net flux shows the normalized difference in LC3-II ± Inh for each genotype (n = 3 per group). (H) Rate of autophagolysosome fusion compares the normalized ratio of LC3-II ± Inh. (I) Immunoblots of liver homogenates (Hom) and hepatic LD fractions. PLIN2 shows the equivalence of LD content, and GAPDH shows the lack of cytosolic contamination. (J) Colocalization (white) of BODIPY 493/503-stained LDs (green) and LC3 (red) in overnight-fasted livers. Images are at the same magnification and are representative of data from four wild-type and three Maf1−/− mice. (K) Quantitation of liver glycerol (n = 4 per group). (L) Quantitation of liver triglycerides (n = 4 per group). The data in FL were from the same cohort of breeder chow-fed mice. (M) Kaplan-Meier survival curves of female mice on a breeder chow diet (mean life span of wild type 113 wk, n = 35 [black]; mean life span of Maf1−/− 121 wk, n = 33 [red]; P = 0.0054, log rank test; maximal life span assessed on the oldest quartile: 130 wk for wild type and 146 wk for Maf1−/−; P = 0.00013, t-test).

Similar articles

Cited by

References

    1. Alekseev AE, Reyes S, Yamada S, Hodgson-Zingman DM, Sattiraju S, Zhu Z, Sierra A, Gerbin M, Coetzee WA, Goldhamer DJ, et al.2010. Sarcolemmal ATP-sensitive K+ channels control energy expenditure determining body weight. Cell Metab 11: 58–69. - PMC - PubMed
    1. Alexandrov A, Chernyakov I, Gu W, Hiley SL, Hughes TR, Grayhack EJ, Phizicky EM. 2006. Rapid tRNA decay can result from lack of nonessential modifications. Mol Cell 21: 87–96. - PubMed
    1. Anunciado-Koza RP, Zhang J, Ukropec J, Bajpeyi S, Koza RA, Rogers RC, Cefalu WT, Mynatt RL, Kozak LP. 2011. Inactivation of the mitochondrial carrier SLC25A25 (ATP-Mg2+/Pi transporter) reduces physical endurance and metabolic efficiency in mice. J Biol Chem 286: 11659–11671. - PMC - PubMed
    1. Argmann CA, Champy MF, Auwerx J. 2006. Evaluation of energy homeostasis. Curr Protoc Mol Biol 73: 29B.1.1–29B.1.17. - PubMed
    1. Bai P, Cantó C, Oudart H, Brunyánszki A, Cen Y, Thomas C, Yamamoto H, Huber A, Kiss B, Houtkooper RH, et al.2011. PARP-1 inhibition increases mitochondrial metabolism through SIRT1 activation. Cell Metab 13: 461–468. - PMC - PubMed

Publication types