. 2015 May;110(3):33.
doi: 10.1007/s00395-015-0489-2. Epub 2015 Apr 30.

Transgenic systems for unequivocal identification of cardiac myocyte nuclei and analysis of cardiomyocyte cell cycle status

Affiliations

Transgenic systems for unequivocal identification of cardiac myocyte nuclei and analysis of cardiomyocyte cell cycle status

Alexandra Raulf et al. Basic Res Cardiol. 2015 May.

Abstract

Even though the mammalian heart has been investigated for many years, there are still uncertainties in the fields of cardiac cell biology and regeneration with regard to exact fractions of cardiomyocytes (CMs) at different developmental stages, their plasticity after cardiac lesion and also their basal turnover rate. A main shortcoming is the accurate identification of CM and the demonstration of CM division. Therefore, an in vivo model taking advantage of a live reporter-based identification of CM nuclei and their cell cycle status is needed. In this technical report, we describe the generation and characterization of embryonic stem cells and transgenic mice expressing a fusion protein of human histone 2B and the red fluorescence protein mCherry under control of the CM specific αMHC promoter. This fluorescence label allows unequivocal identification and quantitation of CM nuclei and nuclearity in isolated cells and native tissue slices. In ventricles of adults, we determined a fraction of <20 % CMs and binucleation of 77-90 %, while in atria a CM fraction of 30 % and a binucleation index of 14 % were found. We combined this transgenic system with the CAG-eGFP-anillin transgene, which identifies cell division and established a novel screening assay for cell cycle-modifying substances in isolated, postnatal CMs. Our transgenic live reporter-based system enables reliable identification of CM nuclei and determination of CM fractions and nuclearity in heart tissue. In combination with CAG-eGFP-anillin-mice, the cell cycle status of CMs can be monitored in detail enabling screening for proliferation-inducing substances in vitro and in vivo.


Figures

Fig. 1
Fig. 1
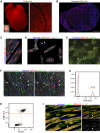
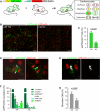
Identification of CM nuclei in vitro. a Expression construct used for the generation of αMHC-H2B-mCh transgenic mouse ESCs. b H2B-mCh expression in beating areas of EBs at d14 of differentiation. Scale bar 200 µm. c Section of an H2B-mCh+ EB indicates specific expression of the fusion protein in CMs, identified by α-actinin staining. Scale bar 50 µm. d Close-up of a CM-rich region of an H2B-mCh+ EB. CMs were identified by α-actinin staining. Scale bar 20 µm. e Protocol for differentiation of ESCs and selection for CMs. f Selection for CMs in H2B-mCh transgenic EBs by puromycin treatment. Left picture shows dissociated EBs without selection and right picture with puromycin treatment for 3 days. H2B-mCh+ CMs were verified by α-actinin staining. Scale bar 100 µm. g Quantification of the selection for CMs in αMHC-H2B-mCh transgenic EBs (d13) treated with puromycin for 3 days (n = 3)
Fig. 2
Fig. 2
Specificity of H2B-mCh expression in CM nuclei of adult transgenic mice. a Macroscopic picture of an αMHC-H2B-mCh heart at adult stage. Scale bars 500 µm. Right picture shows a close-up of the ventricular region. Scale bar 100 µm. b Transversal section of an αMHC-H2B-mCh heart reveals expression of the fusion protein in nuclei. Scale bar 500 µm. c Section of an αMHC-H2B-mCh heart stained for α-actinin to prove expression of the fusion protein in CMs. Scale bar 20 µm. d Langendorff dissociation demonstrates expression of H2B-mCh in all CMs. Scale bar 50 µm. e H2B-mCh is not expressed in nuclei of skeletal muscle cells of H2B-mCh mice. Scale bar 20 µm. f αMHC-H2B-mCh+ heart section stained with GSL to identify endothelial cells. CMs were identified by cross striation in DIC. Arrows mark nuclei that could be misinterpreted as CM nuclei, arrowheads mark cells that would not have been identified as CM nuclei without the transgene. Scale bar 20 µm. g Representative flow cytometric analysis of the percentages of H2B-mCh+ and PCM-1+ single adult DAPI+ nuclei. h Representative flow cytometric analysis of the percentages of H2B-mCh in single adult DAPI+ nuclei. i Staining of PCM-1 and α-actinin in a cryo-slice of an αMHC-H2B-mCh heart. The arrow marks a CM nucleus that is not stained by PCM-1. Scale bar 50 µm
Fig. 3
Fig. 3
Assessment of cardiac morphology in H2B-mCh mice and H2B-mCh expression during embryonic development. a Exclusion of hypertrophic effects of the transgene in Langendorff dissociated adult CMs. N = 3 animals per group; n > 110 CMs per group. b Comparison of heart weight to tibia length between 10-week-old male αMHC-H2B-mCh transgenic and wt littermates (n = 3). c Sections of H2B-mCh and wt hearts stained with Picrosirius red for collagen. Scale bar 100 µm. d Macroscopic pictures of E12.5, E15.5, and E18.5 H2B-mCh transgenic hearts illustrate the expression of the fusion protein in atrial and some ventricular CM nuclei. Scale bar 500 µm. e Section of an E15.5 H2B-mCh heart (left picture) displays strong expression in atrial CM nuclei (right upper picture) and weak expression in some ventricular trabecular CMs (right lower picture). Scale bars 200 µm (overview), 50 µm (close-ups)
Fig. 4
Fig. 4
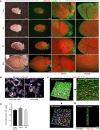
H2B-mCh transgene expression in postnatal mouse hearts. a Epifluorescence pictures of transgenic αMHC-H2B-mCh hearts at different postnatal days. Scale bars 1 mm in the overview pictures, 200 µm in close-ups of atrium and ventricle. b α-Actinin staining (white) of dissociated ventricular (left) and atrial CMs (right) of αMHC-H2B-mCh transgenic hearts proves expression of the fusion protein at P3. Scale bars 20 µm. c Illustration of three methods to quantify the portion of CM nuclei in thick slices of the heart. The 3D-analysis of H2B-mCh+ nuclei in correlation to all ToPro-3+ nuclei reflects the real fraction of CM nuclei. Virtual longitudinal sections (10 µm distance, 3–4 sections per slice) or virtual cross sections [40 µm distance, (4–5 sections per slice)] were analyzed. Scale bars 50 µm. Colored 3D image exemplarily depicts fragmentation of ToPro-3+ nuclei. d Quantification of the fraction of CM nuclei revealed similar results with all three methods (n = 3, two z-stacks per heart)
Fig. 5
Fig. 5
Determination of the percentage of CM nuclei at different developmental stages. a Scheme illustrates the strategy used for analyzing the CM nuclei proportion in different regions of the heart. b Quantification of the percentage of CM nuclei at different developmental stages. A atrium, LV left ventricle, RV right ventricle, (n = 3). c Compact zone compared to trabecular region. d Fraction of CMs in different zones of the heart as described in (a)
Fig. 6
Fig. 6
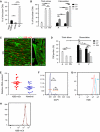
Determination of nuclearity and DNA content in H2B-mCh CMs. a Portion of CMs with two nuclei in one section (n = 3, 2 z-stacks per heart) determined in thick slice 3D reconstruction and virtual longitudinal and cross sections. b Quantification of the percentage of binuclear CMs in LV left ventricle and RV right ventricle at P3 (n ≥ 3), P7 (n ≥ 3), 9 W (n = 3), and in A atrium at 9 W (n = 2). Quantification was performed in z-stacks of thick slices for 9 W and cell dissociation for P3, P7, and 9 W. c Single z-layers of thick heart slices show differences in the tissue morphology of the LV left ventricle and A atrium at adult stage. Membranes are stained with Wheat germ agglutinin (green). Scale bar 50 µm. d Calculation of the portion of CMs taking into account the numbers of Fig. 5b and the grade of binuclearity from thick slices and cell dissociation. e Relative DNA content of Langendorff isolated CMs as assessed by H2B-mCh intensity or Hoechst intensity, respectively. f Representative flow cytometric analysis of the ploidy of H2B-mCh single adult DAPI positive nuclei. g Representative flow cytometric analysis of the fluorescence intensity of mCh from diploid and tetraploid CM nuclei. h Representative flow cytometric analysis of the fluorescence intensity of mCh+ nuclei
Fig. 7
Fig. 7
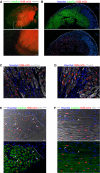
Visualization of CM nuclei after cardiac infarction. a Macroscopic pictures of an αMHC-H2B-mCh heart 10 days after cryoinjury. Close-up depicts border zone region. Scale bars overview: 1 mm, close-up: 200 µm. b Section of a cryo-infarcted αMHC-H2B-mCh heart. H2B-mCh signals are only abundant in intact CMs and are lost in the infarcted region. Scale bar 200 µm. (c, d) αMHC-H2B-mCh+ heart section stained with either α-actinin (c) or cardiac Troponin T (d) to identify CMs. Good co-localization between the cardiac markers and H2B-mCh in the border zone. Scale bars 20 µm. e H2B-mCh expression facilitates the identification of CM nuclei in cross sections of the border zone. Arrows depict CM nuclei, which are not centered in the cell. Scale bar 20 µm. f H2B-mCh expression facilitates the identification of individual surviving CMs (arrows) within the lesioned area. Scale bar 20 µm
Fig. 8
Fig. 8
Assay for screening the effects of cell cycle modifying substances on CMs. a Scheme depicts the cross-breeding of αMHC-H2B-mCh mice with the CAG-eGFP-anillin proliferation indicator mouse. Depending on the cell cycle status, CMs (H2B-mCh+ nuclei) express eGFP-anillin in different subcellular localizations. b Fluorescence pictures of dissociated αMHC-H2B-mCh/CAG-eGFP-anillin double transgenic hearts (P2), transfected with the cell cycle-modifying miR-199 and a miR-NC. Scale bars 100 µm. c Quantification of eGFP-anillin expression in miR-treated CMs 72 h after transfection (n ≥ 3). d Examples of CMs with cytokinesis-indicating eGFP-anillin localizations (arrows). Scale bars 100 µm. e Staining of eGFP-anillin/H2B-mCh CMs with the proliferation marker AURKB Aurora B kinase. Note the overlap between the M-phase specific localization of eGFP-anillin (green) contractile ring and Aurora B kinase (white). Scale bar 10 µm. f Analysis of different eGFP-anillin localizations in CMs after miR-treatment (n ≥ 3). g Portion of binuclear CMs 72 h after miR-transfection (n ≥ 3)

Similar articles

Cited by

References

    1. Ang KL, Shenje LT, Reuter S, Soonpaa MH, Rubart M, Field LJ, Galinanes M. Limitations of conventional approaches to identify myocyte nuclei in histologic sections of the heart. Am J Physiol Cell Physiol. 2010;298:C1603–C1609. doi: 10.1152/ajpcell.00435.2009. - DOI - PMC - PubMed
    1. Banerjee I, Fuseler JW, Price RL, Borg TK, Baudino TA. Determination of cell types and numbers during cardiac development in the neonatal and adult rat and mouse. Am J Physiol Heart Circ Physiol. 2007;293:H1883–H1891. doi: 10.1152/ajpheart.00514.2007. - DOI - PubMed
    1. Baudino TA, Carver W, Giles W, Borg TK. Cardiac fibroblasts: friend or foe? Am J Physiol Heart Circ Physiol. 2006;291:H1015–H1026. doi: 10.1152/ajpheart.00023.2006. - DOI - PubMed
    1. Bergmann O, Bhardwaj RD, Bernard S, Zdunek S, Barnabe-Heider F, Walsh S, Zupicich J, Alkass K, Buchholz BA, Druid H, Jovinge S, Frisen J. Evidence for cardiomyocyte renewal in humans. Science. 2009;324:98–102. doi: 10.1126/science.1164680. - DOI - PMC - PubMed
    1. Bergmann O, Jovinge S. Isolation of cardiomyocyte nuclei from post-mortem tissue. J Vis Exp. 2012;65:e4205. - PMC - PubMed

Publication types

LinkOut - more resources