. 2015 Jun 12;290(24):15327-36.
doi: 10.1074/jbc.M114.633560. Epub 2015 Apr 29.

The Endoplasmic Reticulum Stress Sensor IRE1α in Intestinal Epithelial Cells Is Essential for Protecting against Colitis

Affiliations

The Endoplasmic Reticulum Stress Sensor IRE1α in Intestinal Epithelial Cells Is Essential for Protecting against Colitis

Hai-Sheng Zhang et al. J Biol Chem. .

Abstract

Intestinal epithelial cells (IECs) have critical roles in maintaining homeostasis of intestinal epithelium. Endoplasmic reticulum (ER) stress is implicated in intestinal epithelium homeostasis and inflammatory bowel disease; however, it remains elusive whether IRE1α, a major sensor of ER stress, is directly involved in these processes. We demonstrate here that genetic ablation of Ire1α in IECs leads to spontaneous colitis in mice. Deletion of IRE1α in IECs results in loss of goblet cells and failure of intestinal epithelial barrier function. IRE1α deficiency induces cell apoptosis through induction of CHOP, the pro-apoptotic protein, and sensitizes cells to lipopolysaccharide, an endotoxin from bacteria. IRE1α deficiency confers upon mice higher susceptibility to chemical-induced colitis. These results suggest that IRE1α functions to maintain the intestinal epithelial homeostasis and plays an important role in defending against inflammation bowel diseases.

Keywords: colitis; endoplasmic reticulum stress (ER stress); inflammation; inflammatory bowel disease (IBD); intestinal epithelium.


Figures

FIGURE 1.
FIGURE 1.
Mice with IEC-specific deletion of Ire1α develop spontaneous colitis. A, schematic of the strategy for generation of the floxed mice (Ire1αflox/flox) in which the exon 2 of the Ire1α (Ern1) gene was flanked with loxP recombination sites as previously described in detail (23). Cre recombinase-mediated removal of the exon 2 leads to disruption of the Ern1 allele. Villin-Cre mice that express the Cre recombinase transgene under the control of Villin promoter were used to create intestinal epithelia-specific Ire1α knock-out mice (Ire1αflox/floxVillin-Cre) by intercrossing with Ire1αflox/flox mice. B, genotyping of the wild-type Ire1α allele, and the heterozygous and homozygous floxed-Ire1α allele. PCR was conducted with primers flanking the first loxP site, using tail genomic DNA isolated from mice. C, immunoblotting analysis of IRE1α protein in intestinal or colon epithelial cells isolated from age-matched (6–8 weeks) littermates of the indicated genotype. β-Actin was used as the loading control. D, body weight of sex- and age-matched (18–22 weeks) littermates. Data are mean ± S.E. Ire1α+/+ (n = 31), Ire1α+/− (n = 41), Ire1α−/− (n = 35). E, visible rectal bleeding in Ire1α−/− mice. Shown are representative female littermates at 22 weeks of age. F, the incidence of visible rectal bleeding was determined in male and female mice (16–24 weeks). G, representative images of colons from age-matched female littermates. H, colon length of age-matched female littermates (18∼22 weeks). Data are mean ± S.E. Ire1α+/+ (n = 8), Ire1α+/− (n = 9), and Ire1α−/− (n = 9). I, survival curves. Kaplan-Meier analysis was performed. Ire1α+/+ (n = 23), Ire1α−/− (n = 25). p = 0.0020 by Log-rank (Mantel-Cox) test.
FIGURE 2.
FIGURE 2.
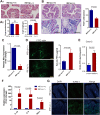
IRE1α deficiency results in intestinal barrier dysfunction and inflammation. A1, H&E staining of the distal colon tissue sections of female Ire1α+/+ and Ire1α−/− littermates. A2, crypt number and length were determined. Five female mice of each genotype were examined (18–22 weeks). Crypt length was measured as described (47). B, PAS staining of distal colon tissue sections. PAS-positive cells were quantified using the “Image-Pro Plus” software. Data are mean ± S.E. Ire1α+/+ (n = 4) and Ire1α−/− (n = 6). C, quantitative RT-PCR analysis of Muc2 mRNA abundance in isolated colon epithelial cells from age-matched female mice. Values from Ire1α+/+ mice were set as 1. Data are mean ± S.E. (n = 4). D, colon epithelial permeability was determined as described under “Materials and Methods.” Distribution of FITC-dextran in sectioned colon tissues was analyzed by fluorescence microscopy (left panel). The right panel shows the level of FITC-dextran in serum. Data are mean ± S.E. (n = 6 for each phenotype). E, effects of knockdown of IRE1α on paracellular permeability of Caco-2 monolayer. In vitro paracellular permeability was performed as described under “Materials and Methods.” F, analyses by quantitative RT-PCR of the mRNA abundance of Tnfα, Il-1β, and Il-6 in the colon epithelium. Values from Ire1α+/+ mice were set as 1. Data are mean ± S.E. Ire1α+/+ (n = 6), Ire1α−/− (n = 8). G, staining of colon tissue sections with ICAM-1 antibody. Scale bar = 100 μm.
FIGURE 3.
FIGURE 3.
IRE1α ablation exacerbates ER stress and apoptosis in colon epithelial cells. A, analysis by real-time PCR of Xbp1 mRNA splicing. The colon epithelial cells from age-matched female mice were isolated for the RNA preparation. The data are mean ± S.E. Ire1+/+ (n = 9), Ire1−/− (n = 11). B, P-JNK in colon epithelial cells of Ire1+/+ and Ire1−/− littermates (n = 4 for each phenotype). The relative p-JNK level was determined by measuring the density of the p-JNK band and normalized to that of JNK. The average p-JNK level of Ire1+/+ mice is designated as 1. C, phosphorylation of eIF2α and expression of CHOP in colon epithelial cells of Ire1α−/− and Ire1α+/+ mice (n = 4 for each phenotype). Relative CHOP level was determined as described above. D, quantitative RT-PCR analysis of Chop mRNA levels in colon epithelial cells from mice (n = 4). E, TUNEL staining of colon tissue sections from mice of the indicated genotype. The bottom panels are enlarged merged images. F, the panel shows statistic results of TUNEL-positive cells (n = 3). The data are mean ± S.E. G, increased cleavage of caspase 3 in colon epithelial cells of Ire1α−/− mice. The upper panel is representative of the Western blot for cleaved caspase 3. The lower panel shows the relative level of cleaved caspase 3 with that of control set as 1 (n = 5). Scale bar = 100 μm.
FIGURE 4.
FIGURE 4.
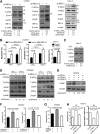
Knockdown of IRE1α promotes LPS-induced ER stress and cell apoptosis. A, CCD841 or Caco-2 cells were transfected with scrambled control siRNA or IRE1α siRNAs. After 48 h, the cells were harvested for immunoblotting. Densitometric quantification of IRE1α protein abundance is shown after normalization to β-actin, with the value of the control set as 1. B, CCD841 cells were transfected for 36 h with siRNAs as indicated prior to treatment with or without LPS at 2 μg/ml for 24 h. Apoptosis was measured as described under “Materials and Methods.” C, Caco-2 cells were treated with LPS (2 μg/ml) for 24 h, followed by immunoblot analysis of eIF2α phosphorylation and CHOP expression. D, transfected CCD841 cells were treated with or without LPS at 2 μg/ml for 12 h, followed by immunoblot analysis of eIF2α phosphorylation and CHOP expression. E–G, CCD841 cells were transfected for 36 h with scrambled control siRNA, siIRE1α, and/or siCHOP as indicated. E, immunoblot analysis of CHOP expression in CCD841. Densitometric quantification of the CHOP protein level is shown, with the value of the siIRE1α-1 knockdown cells set as 1. F, cell apoptosis analysis. G, transfected CCD841 cells were treated with LPS at 4 μg/ml for 24 h and apoptosis was determined. H, Caco-2 cells were transfected with control or IRE1α siRNA oligos in the presence or absence of Z-VAD (20 μm). After 48 h, the cells were collected for determination of cell apoptosis and Muc-2 mRNA. Data are mean ± S.E.
FIGURE 5.
FIGURE 5.
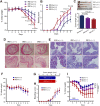
Ire1α−/− mice are more susceptible to DSS-induced colitis. A–E, age-matched (6–8 weeks) male littermates were treated with DSS (2% in drinking water) for 9 days as described under “Materials and Methods.” A, body weight was monitored at the indicated time. Data are mean ± S.E. Ire1α+/+ (n = 9), Ire1α+/− (n = 11), and Ire1α−/− (n = 9). p values are indicated for statistic analysis of Ire1α+/+ versus Ire1α−/−. B, bleeding score. Data are mean ± S.E. p values are indicated for statistic analysis of Ire1α+/+ versus Ire1α−/−. C, measurement of colon length. The upper panel shows representatives of colons and the lower panel shows statistic analysis of colon length. Data are mean ± S.E. D, H&E staining of colon tissue sections. E, PAS staining of colon tissue sections. F–H, antibiotic treatment abrogates the differences in susceptibility to DSS colitis. The experiments were performed as in A, except that a higher dose of DSS (3.5%) was used. Neomycin sulfate (1.5 g/liter) and metronidazole (1.5 g/liter) were added in drinking water over the examination. F, body weight; G, colon length; H, bleeding score. Ire1α+/+ (n = 5), Ire1α−/− (n = 4). I, body weight recovery for mice after DSS exposure. Age-matched male mice (6–8 weeks) were exposed to 2.5% DSS for 5 days, followed by normal water (n = 4 per genotype). Body weight was monitored. Two-way analysis of variance was employed for statistic analysis. Scale bar = 100 μm.

Similar articles

Cited by

References

    1. Baumgart D. C., Carding S. R. (2007) Inflammatory bowel disease: cause and immunobiology. Lancet 369, 1627–1640 - PubMed
    1. Braus N. A., Elliott D. E. (2009) Advances in the pathogenesis and treatment of IBD. Clin. Immunol. 132, 1–9 - PMC - PubMed
    1. Rutgeerts P., Vermeire S., Van Assche G. (2009) Biological therapies for inflammatory bowel diseases. Gastroenterology 136, 1182–1197 - PubMed
    1. Abraham C., Cho J. H. (2009) Inflammatory bowel disease. N. Engl. J. Med. 361, 2066–2078 - PMC - PubMed
    1. Hall P. A., Coates P. J., Ansari B., Hopwood D. (1994) Regulation of cell number in the mammalian gastrointestinal tract: the importance of apoptosis. J. Cell Sci. 107, 3569–3577 - PubMed

Publication types