. 2015 Apr 29:4:e05565.
doi: 10.7554/eLife.05565.

A simple biophysical model emulates budding yeast chromosome condensation

Affiliations

A simple biophysical model emulates budding yeast chromosome condensation

Tammy M K Cheng et al. Elife. .

Abstract

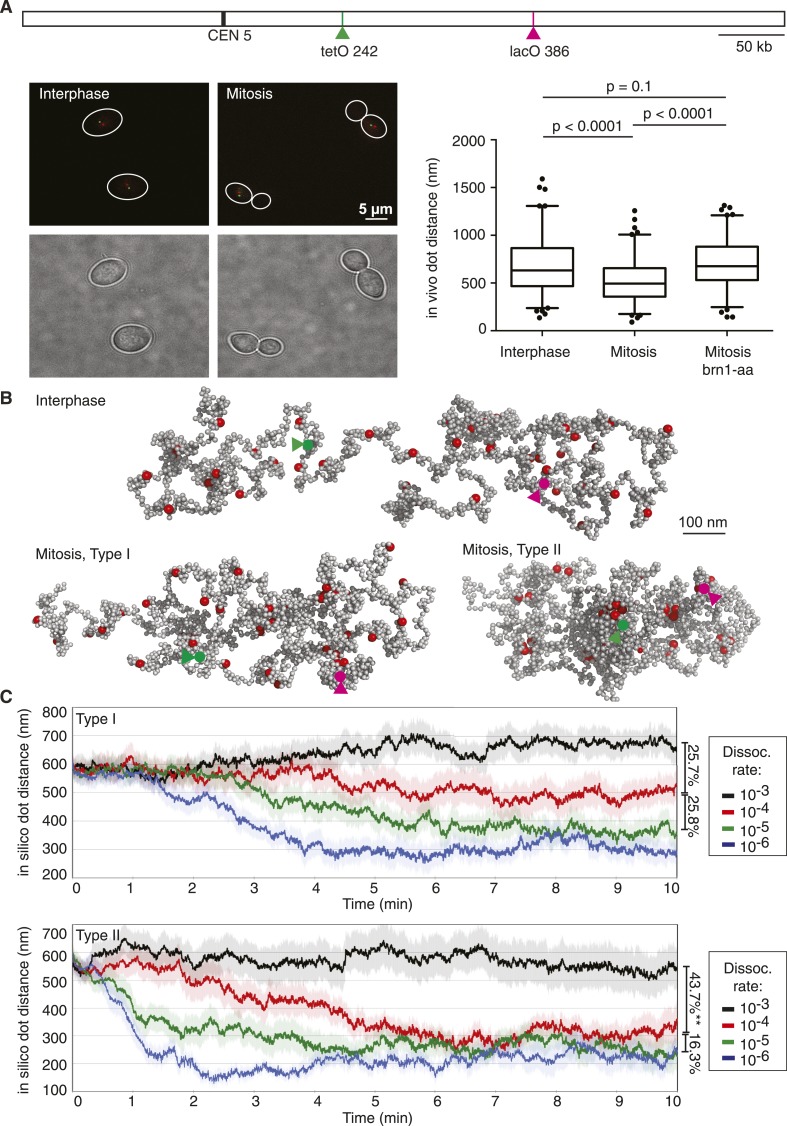
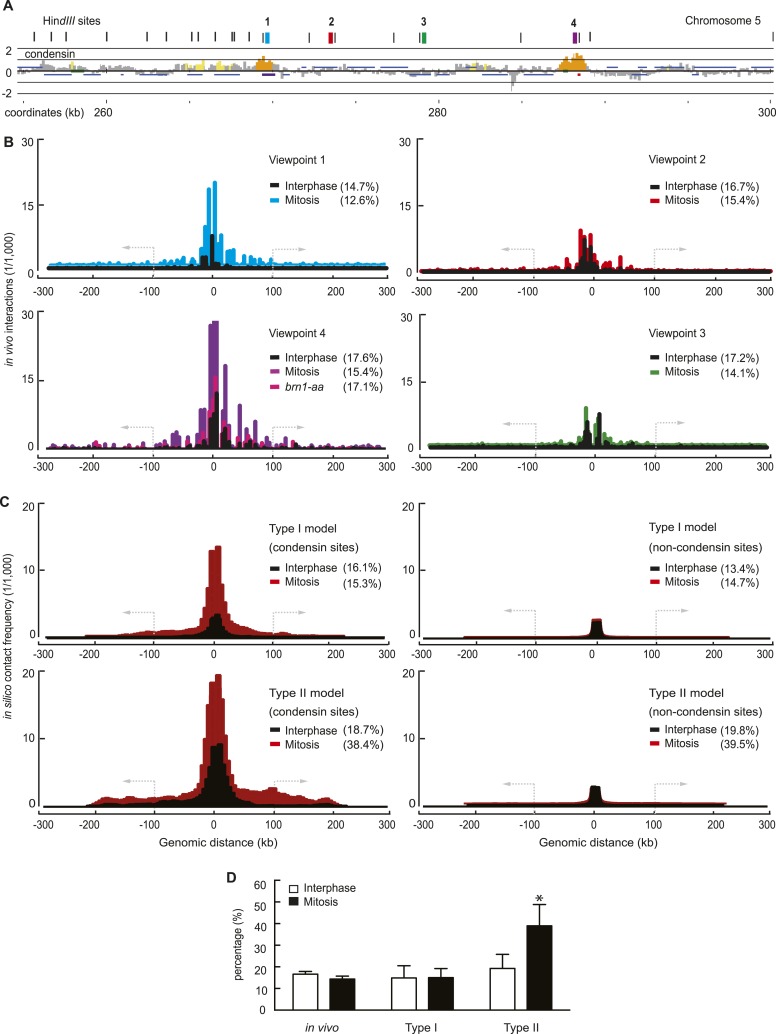
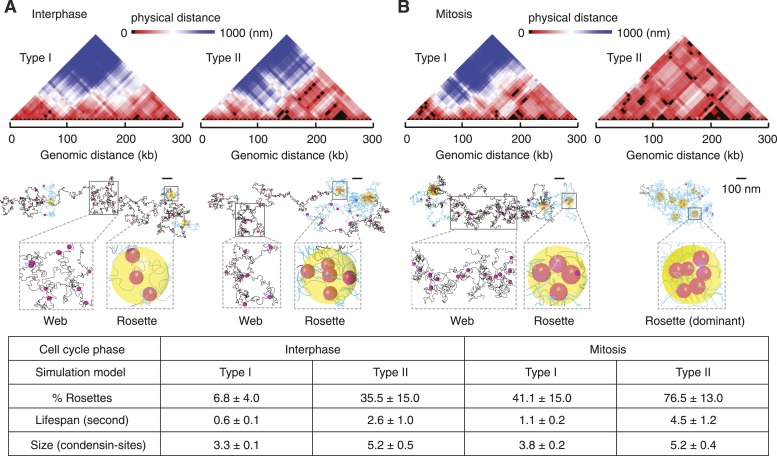
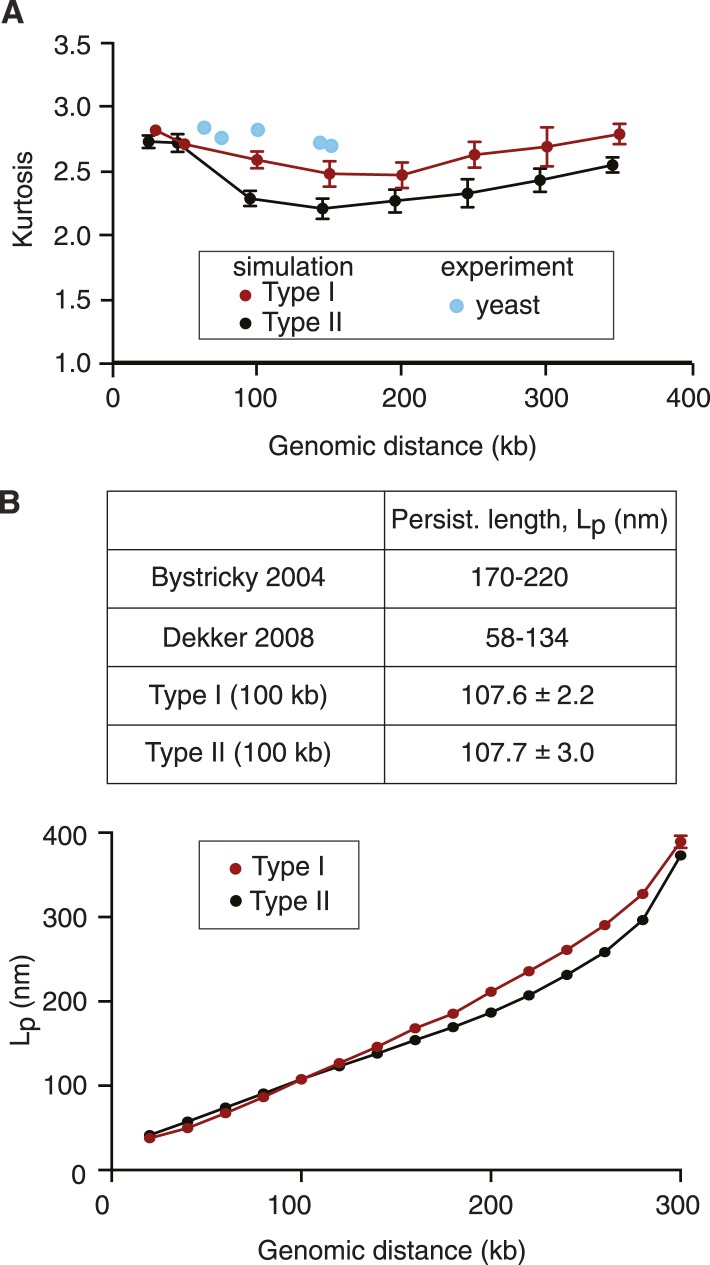
Mitotic chromosomes were one of the first cell biological structures to be described, yet their molecular architecture remains poorly understood. We have devised a simple biophysical model of a 300 kb-long nucleosome chain, the size of a budding yeast chromosome, constrained by interactions between binding sites of the chromosomal condensin complex, a key component of interphase and mitotic chromosomes. Comparisons of computational and experimental (4C) interaction maps, and other biophysical features, allow us to predict a mode of condensin action. Stochastic condensin-mediated pairwise interactions along the nucleosome chain generate native-like chromosome features and recapitulate chromosome compaction and individualization during mitotic condensation. Higher order interactions between condensin binding sites explain the data less well. Our results suggest that basic assumptions about chromatin behavior go a long way to explain chromosome architecture and are able to generate a molecular model of what the inside of a chromosome is likely to look like.

Keywords: S. cerevisiae; chromosome architecture; chromosomes; computational biology; condensin; genes; mitosis; systems biology.


Conflict of interest statement

The authors declare that no competing interests exist.

Figures

Figure 1.
Figure 1.. A computational chromosome model.
(A) Schematic of the forces enacted during simulation. Inter-joined grey beads represent nucleosomes, condensin binding sites are highlighted in red. Fentropic (blue arrows) move each bead in a Brownian dynamic trajectory, constrained by Ftension (red arrows), a spring force that connects nucleosome beads, Frepulsion (green arrows) that avoids overlaps between beads, Fattraction (purple arrows), a weak force that corrects the angle at which DNA linkers emanate from the nucleosomes and Fcondensin that maintains the vicinity of two condensin binding sites, if they meet. (B) Condensin localization along a 300 kb region on the right arm of budding yeast chromosome 5, showing condensin binding sites (red vertical lines) at approximately 10 kb intervals. (C) View of a relaxed starting conformation of the simulated 300 kb nucleosome chain. (D) Illustration of Type I and Type II interactions, where pairs of condensin binding sites interact, or where one binding site interacts with up to two others, respectively. DOI: http://dx.doi.org/10.7554/eLife.05565.003
Figure 1—figure supplement 1.
Figure 1—figure supplement 1.. Nucleosome displacement over time in our computational chromosome model.
The histograms show the distribution of the nucleosome bead displacement within 30 ms timeframes, collated from 1000 randomly chosen observations from 10 independent simulations of both the Type I and Type II models in an interphase state. DOI: http://dx.doi.org/10.7554/eLife.05565.004
Figure 1—figure supplement 2.
Figure 1—figure supplement 2.. α angle distribution of DNA entry and exit from nucleosomes in simulated chromosomes.
The α angle distribution of all nucleosomes was recorded from 1000 snapshots, collected from 10 independent simulations of both the Type I and Type II models. DOI: http://dx.doi.org/10.7554/eLife.05565.005
Figure 2.
Figure 2.. Chromosome dimensions during experimental and computational condensation.
(A) Scheme showing the location of the two loci whose distance was recorded in vivo and during each simulation. Example micrographs of wild type cells in interphase and mitosis are shown, together with a graph depicting the median, upper, and lower quartiles, with whiskers at 2.5 and 97.5%, outliers also plotted, for both wild type strains in interphase and mitosis, as well as for a strain in mitosis in which condensin has been depleted from the nucleus using the brn1-aa allele (Haruki et al., 2008; O'Reilly et al., 2012; Charbin et al., 2014). Statistical significance of the differences was assessed using a Wilcoxon–Mann–Whitney test. (B) Example of an interphase conformation (Type I model, condensin interaction dissociation rate 10−3) of a simulated chromosome, the two marker loci are highlighted, as well as mitotic conformations (dissociation rate 10−4) generated by the Type I and Type II models. (C) Traces of marker distance over time after the dissociation rates were set to the indicated values at t = 0. Shown are the mean and the standard error of 30 simulations. The linear compaction ratios are noted for the indicated comparisons. DOI: http://dx.doi.org/10.7554/eLife.05565.006
Figure 2—figure supplement 1.
Figure 2—figure supplement 1.. Traces of marker distances over time in the Type II model at dissociation probability 5 × 10⁻⁴.
Four representative cases of marker distance traces from simulations of the Type II model using dissociation probability 5 × 10⁻⁴. Distance between the two markers was ∼144 kb in the middle section of the chromatin chain, as in Figure 2. The dissociation rate was changed from 1 × 10⁻³ to 5 × 10⁻⁴ at time 0. Examples of simulations that remain in a stable equilibrium, either extended or compact, or that transition in either direction between the two states, are shown. DOI: http://dx.doi.org/10.7554/eLife.05565.007
Figure 3.
Figure 3.. Experimental and computational intrachromosomal interaction frequency maps.
(A) Close-up of the chromosomal viewpoints selected for 4C analysis. Condensin localization along part of the chromosome 5 right arm is shown together with genomic HindIII recognition sites and the four 4C view points that do (1 and 4) or do not (2 and 3) contain a condensin binding site. (B) Experimental 4C interaction maps of the four regions, in both interphase and mitosis. Shown is also a 4C map of region 4 in mitosis after condensin has been depleted from the nucleus using the brn1-aa allele. The y-axis shows sequencing read counts normalized to the total number of mapped reads in each sample. The percentage of interactions that extend farther than 100 kb from the viewpoint is indicated. (C) Averaged computational intrachromosomal interaction maps of 6 viewpoints within 50 kb from the chromosome ends, on or between condensin binding sites, generated using both the Type I and Type II model and sampled over 1000 time points and 30 simulations in interphase and mitosis (condensin interaction dissociation rates 10−3 and 10−4, respectively). The y-axis shows interaction frequencies of the viewpoints normalized to all interactions. (D) Percentage of interactions that extend beyond 100 kb from the viewpoint under the indicated conditions. The mean of the four experimental fragments, or of the simulated distributions, is shown together with the standard deviation. *p < 0.0001, Wilcoxon–Mann–Whitney test. DOI: http://dx.doi.org/10.7554/eLife.05565.010
Figure 4.
Figure 4.. Web and rosette characteristics of the intrachromosomal interaction pattern.
(A) 3D distance maps of the condensin binding sites, a snapshot of an interphase simulation is shown. Each position along the x axis represents a condensin binding site, the color-coded distance between each is shown above. The corresponding snapshot of the chromosome is partitioned into web (grey) and rosette (blue) compartments. Yellow spheres highlight the core of the rosette structures where more than two condensin binding sites are in proximity. (B) as (A), but snapshots are shown from simulations in mitosis. A summary of the percentage, life-span, and size of rosette structures within the chromosome, averaged over 3000 time intervals and 30 simulations is given in the table. DOI: http://dx.doi.org/10.7554/eLife.05565.011
Figure 5.
Figure 5.. Polymer characteristics of simulated and native budding yeast chromatin.
(A) Kurtosis values calculated from the simulations and experimental measurements in interphase. Experimental data were from Figure 2 and from published measurements (Bystricky et al., 2004). (B) The persistence length Lp of chromatin in the Type I and Type II model as a function of genomic distance. 100 chromosome conformations of each model were exhaustively sampled with the orientation correlation function, the means and standard deviations of Lp are plotted. The values in the table are from the 100 kb cut-off, a range similar to that used in the experimental measurements (Bystricky et al., 2004; Dekker, 2008). DOI: http://dx.doi.org/10.7554/eLife.05565.012
Figure 6.
Figure 6.. Chromosome individualization during condensation.
Snapshots are shown of chromosomes and their 3D distance maps, after 5 min of simulated chromosome condensation of two adjacent chromosomes using the Type I and Type II models. The average number of interchromosome contacts over the 10 min condensation timecourse are indicated. Statistical significance of the difference was assessed using a Wilcoxon–Mann–Whitney test. DOI: http://dx.doi.org/10.7554/eLife.05565.013

Similar articles

Cited by

References

    1. Anderson DE, Losada A, Erickson HP, Hirano T. Condensin and cohesin display different arm conformations with characteristic hinge angles. The Journal of Cell Biology. 2002;156:419–424. doi: 10.1083/jcb.200111002. - DOI - PMC - PubMed
    1. Balanda KP, MacGillivray HL. Kurtosis: a critical review. Americ Statistician. 1988;42:111–119.
    1. Barbieri M, Chotalia M, Fraser J, Lavitas LM, Dostie J, Pombo A, Nicodemi M. Complexity of chromatin folding is captured by the strings and binders switch model. Proceedings of the National Academy of Sciences of USA. 2012;109:18173–18178. doi: 10.1073/pnas.1204799109. - DOI - PMC - PubMed
    1. Bednar J, Horowitz RA, Grigoryev SA, Carruthers LM, Hansen JC, Koster AJ, Woodcock CL. Nucleosomes, linker DNA, and linker histone form a unique structural motif that directs the higher-order folding and compaction of chromatin. Proceedings of the National Academy of Sciences of USA. 1998;95:14173–14178. doi: 10.1073/pnas.95.24.14173. - DOI - PMC - PubMed
    1. Brackley CA, Taylor S, Papantonis A, Cook PR, Marenduzzo D. Nonspecific bridging-induced attraction drives clustering of DNA-binding proteins and genome organization. Proceedings of the National Academy of Sciences of USA. 2013;110:E3605–E3611. doi: 10.1073/pnas.1302950110. - DOI - PMC - PubMed

Publication types

MeSH terms