

Metagenomic and network analysis reveal wide distribution and co-occurrence of environmental antibiotic resistance genes
- PMID: 25918831
- PMCID: PMC4611512
- DOI: 10.1038/ismej.2015.59
Metagenomic and network analysis reveal wide distribution and co-occurrence of environmental antibiotic resistance genes
Abstract
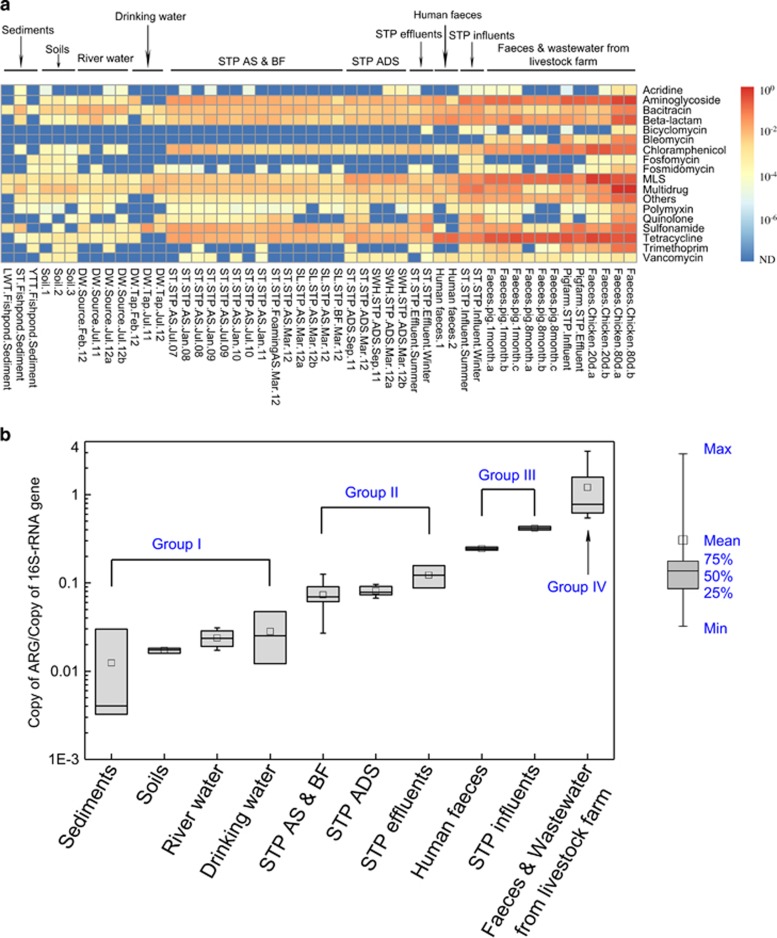
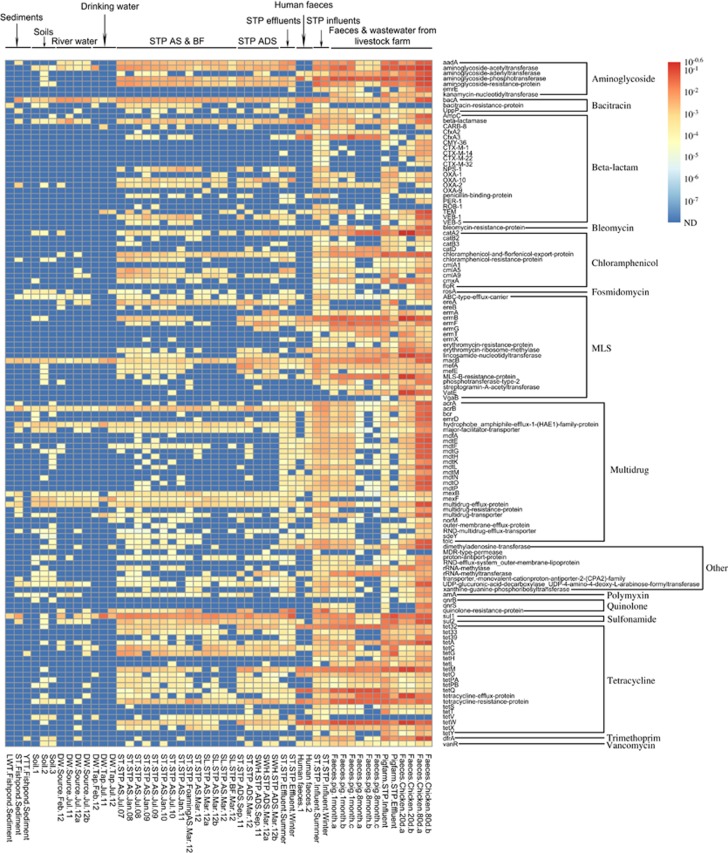
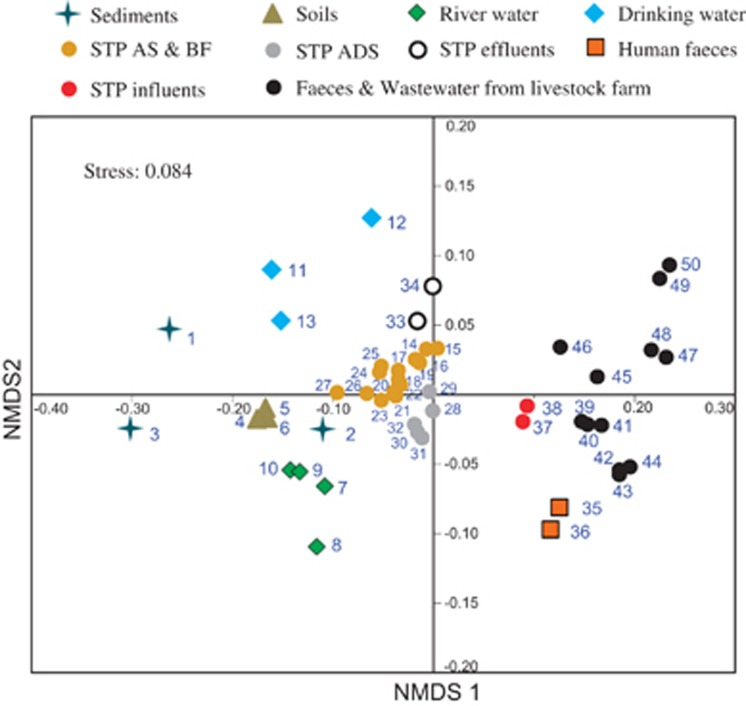
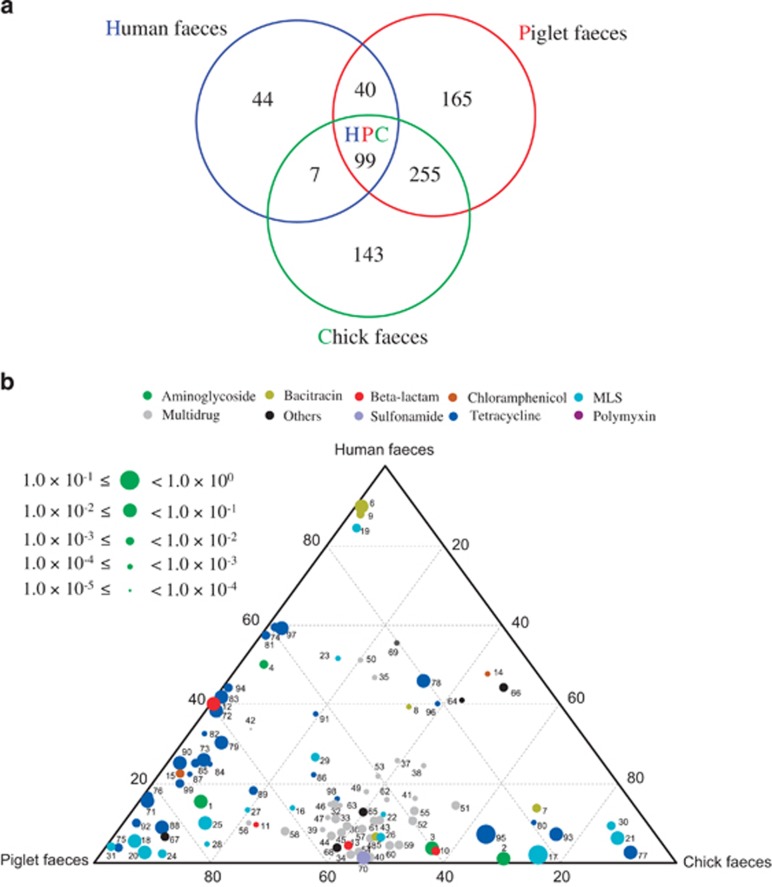
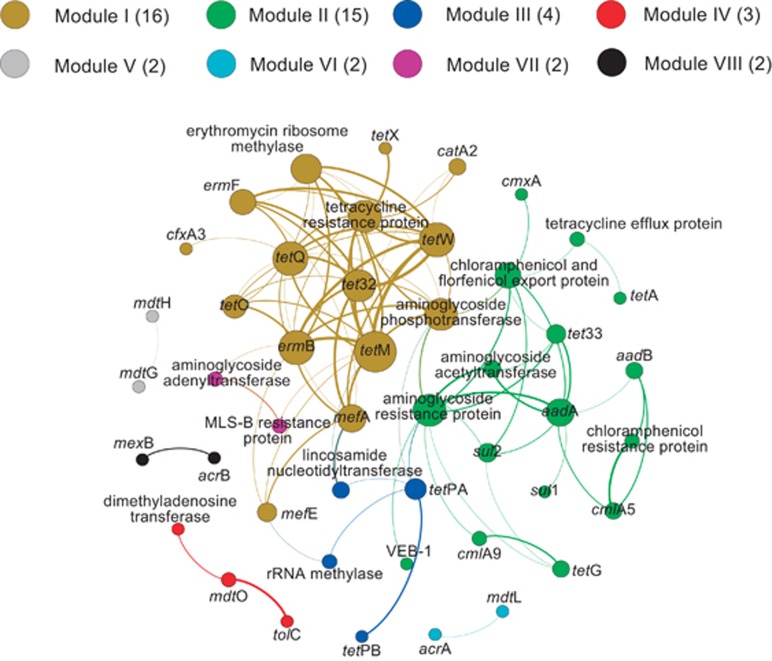
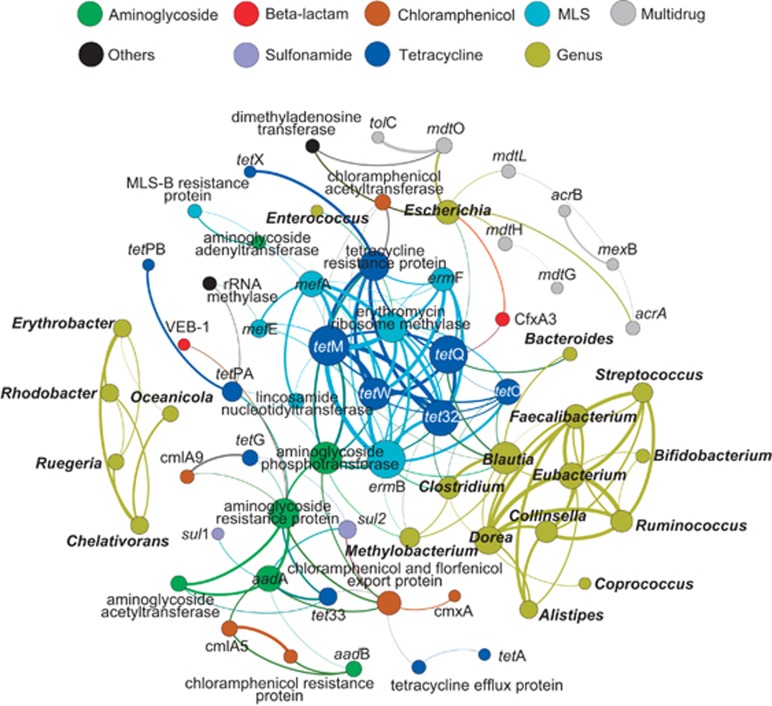
A metagenomic approach and network analysis was used to investigate the wide-spectrum profiles of antibiotic resistance genes (ARGs) and their co-occurrence patterns in 50 samples from 10 typical environments. In total, 260 ARG subtypes belonging to 18 ARG types were detected with an abundance range of 5.4 × 10(-6)-2.2 × 10(-1) copy of ARG per copy of 16S-rRNA gene. The trend of the total ARG abundances in environments matched well with the levels of anthropogenic impacts on these environments. From the less impacted environments to the seriously impacted environments, the total ARG abundances increased up to three orders of magnitude, that is, from 3.2 × 10(-3) to 3.1 × 10(0) copy of ARG per copy of 16S-rRNA gene. The abundant ARGs were associated with aminoglycoside, bacitracin, β-lactam, chloramphenicol, macrolide-lincosamide-streptogramin, quinolone, sulphonamide and tetracycline, in agreement with the antibiotics extensively used in human medicine or veterinary medicine/promoters. The widespread occurrences and abundance variation trend of vancomycin resistance genes in different environments might imply the spread of vancomycin resistance genes because of the selective pressure resulting from vancomycin use. The simultaneous enrichment of 12 ARG types in adult chicken faeces suggests the coselection of multiple ARGs in this production system. Non-metric multidimensional scaling analysis revealed that samples belonging to the same environment generally possessed similar ARG compositions. Based on the co-occurrence pattern revealed by network analysis, tetM and aminoglycoside resistance protein, the hubs of the ARG network, are proposed to be indicators to quantitatively estimate the abundance of 23 other co-occurring ARG subtypes by power functions.
Figures
Similar articles
-
Antibiotic resistome in a large-scale healthy human gut microbiota deciphered by metagenomic and network analyses.Environ Microbiol. 2018 Jan;20(1):355-368. doi: 10.1111/1462-2920.14009. Epub 2017 Dec 15. Environ Microbiol. 2018. PMID: 29194931
-
Antibiotic resistome in landfill leachate from different cities of China deciphered by metagenomic analysis.Water Res. 2018 May 1;134:126-139. doi: 10.1016/j.watres.2018.01.063. Epub 2018 Feb 5. Water Res. 2018. PMID: 29407646
-
Characteristics of antibiotic resistance gene distribution in rainfall runoff and combined sewer overflow.Environ Sci Pollut Res Int. 2023 Mar;30(11):30766-30778. doi: 10.1007/s11356-022-24257-1. Epub 2022 Nov 28. Environ Sci Pollut Res Int. 2023. PMID: 36441318
-
Antibiotic resistance genes in China: occurrence, risk, and correlation among different parameters.Environ Sci Pollut Res Int. 2018 Aug;25(22):21467-21482. doi: 10.1007/s11356-018-2507-z. Epub 2018 Jun 12. Environ Sci Pollut Res Int. 2018. PMID: 29948704 Review.
-
Genomic and Metagenomic Approaches for Predictive Surveillance of Emerging Pathogens and Antibiotic Resistance.Clin Pharmacol Ther. 2019 Sep;106(3):512-524. doi: 10.1002/cpt.1535. Epub 2019 Jul 22. Clin Pharmacol Ther. 2019. PMID: 31172511 Free PMC article. Review.
Cited by
-
Migratory birds-one major source of environmental antibiotic resistance around Qinghai Lake, China.Sci Total Environ. 2020 Oct 15;739:139758. doi: 10.1016/j.scitotenv.2020.139758. Epub 2020 May 30. Sci Total Environ. 2020. PMID: 32540654 Free PMC article.
-
Shotgun Metagenomics-Guided Prediction Reveals the Metal Tolerance and Antibiotic Resistance of Microbes in Poly-Extreme Environments in the Danakil Depression, Afar Region.Antibiotics (Basel). 2023 Dec 4;12(12):1697. doi: 10.3390/antibiotics12121697. Antibiotics (Basel). 2023. PMID: 38136731 Free PMC article.
-
Impact of cell lysis treatment before saliva metagenomic DNA extraction on the oral microbiome and the associated resistome.Clin Exp Dent Res. 2024 Aug;10(4):e905. doi: 10.1002/cre2.905. Clin Exp Dent Res. 2024. PMID: 38938117 Free PMC article.
-
Insights into the impact of manure on the environmental antibiotic residues and resistance pool.Front Microbiol. 2022 Sep 16;13:965132. doi: 10.3389/fmicb.2022.965132. eCollection 2022. Front Microbiol. 2022. PMID: 36187968 Free PMC article. Review.
-
Exploring the antibiotic resistome in activated sludge and anaerobic digestion sludge in an urban wastewater treatment plant via metagenomic analysis.J Microbiol. 2020 Feb;58(2):123-130. doi: 10.1007/s12275-020-9309-y. Epub 2019 Dec 23. J Microbiol. 2020. PMID: 31875929
References
-
- Albertsen M, Hugenholtz P, Skarshewski A, Nielsen KL, Tyson GW, Nielsen PH. (2013). Genome sequences of rare, uncultured bacteria obtained by differential coverage binning of multiple metagenomes. Nat Biotechnol 31: 533–538. - PubMed
-
- Bastian M, Heymann S, Jacomy M. (2009). Gephi: an open source software for exploring and manipulating networks. Proc Third Int ICWSM Conf (ICWSM) 8: 361–362.
-
- Benjamini Y, Hochberg Y. (1995). Controlling the false discovery rate: a practical and powerful approach to multiple testing. J R Stat Soc Ser B (Methodological) 57: 289–300.
-
- Burch TR, Sadowsky MJ, LaPara TM. (2013). Air-drying beds reduce the quantities of antibiotic resistance genes and class 1 integrons in residual municipal wastewater solids. Environ Sci Technol 47: 9965–9971. - PubMed
Publication types
MeSH terms
Substances
LinkOut - more resources
Full Text Sources
Other Literature Sources
Medical
