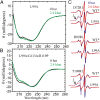
Structure-relaxation mechanism for the response of T4 lysozyme cavity mutants to hydrostatic pressure
- PMID: 25918400
- PMCID: PMC4434698
- DOI: 10.1073/pnas.1506505112
Structure-relaxation mechanism for the response of T4 lysozyme cavity mutants to hydrostatic pressure
Abstract
Application of hydrostatic pressure shifts protein conformational equilibria in a direction to reduce the volume of the system. A current view is that the volume reduction is dominated by elimination of voids or cavities in the protein interior via cavity hydration, although an alternative mechanism wherein cavities are filled with protein side chains resulting from a structure relaxation has been suggested [López CJ, Yang Z, Altenbach C, Hubbell WL (2013) Proc Natl Acad Sci USA 110(46):E4306-E4315]. In the present study, mechanisms for elimination of cavities under high pressure are investigated in the L99A cavity mutant of T4 lysozyme and derivatives thereof using site-directed spin labeling, pressure-resolved double electron-electron resonance, and high-pressure circular dichroism spectroscopy. In the L99A mutant, the ground state is in equilibrium with an excited state of only ∼ 3% of the population in which the cavity is filled by a protein side chain [Bouvignies et al. (2011) Nature 477(7362):111-114]. The results of the present study show that in L99A the native ground state is the dominant conformation to pressures of 3 kbar, with cavity hydration apparently taking place in the range of 2-3 kbar. However, in the presence of additional mutations that lower the free energy of the excited state, pressure strongly populates the excited state, thereby eliminating the cavity with a native side chain rather than solvent. Thus, both cavity hydration and structure relaxation are mechanisms for cavity elimination under pressure, and which is dominant is determined by details of the energy landscape.
Keywords: DEER; EPR; conformational exchange; protein structural dynamics.
Conflict of interest statement
The authors declare no conflict of interest.
Figures


Similar articles
-
Structural and thermodynamic characterization of T4 lysozyme mutants and the contribution of internal cavities to pressure denaturation.Biochemistry. 2008 Oct 21;47(42):11097-109. doi: 10.1021/bi801287m. Epub 2008 Sep 25. Biochemistry. 2008. PMID: 18816066 Free PMC article.
-
Motion of spin-labeled side chains in T4 lysozyme. Correlation with protein structure and dynamics.Biochemistry. 1996 Jun 18;35(24):7692-704. doi: 10.1021/bi960482k. Biochemistry. 1996. PMID: 8672470
-
Conformational selection and adaptation to ligand binding in T4 lysozyme cavity mutants.Proc Natl Acad Sci U S A. 2013 Nov 12;110(46):E4306-15. doi: 10.1073/pnas.1318754110. Epub 2013 Oct 28. Proc Natl Acad Sci U S A. 2013. PMID: 24167295 Free PMC article.
-
Structural and genetic analysis of the folding and function of T4 lysozyme.FASEB J. 1996 Jan;10(1):35-41. doi: 10.1096/fasebj.10.1.8566545. FASEB J. 1996. PMID: 8566545 Review.
-
Lessons from the lysozyme of phage T4.Protein Sci. 2010 Apr;19(4):631-41. doi: 10.1002/pro.344. Protein Sci. 2010. PMID: 20095051 Free PMC article. Review.
Cited by
-
Capturing Invisible Motions in the Transition from Ground to Rare Excited States of T4 Lysozyme L99A.Biophys J. 2016 Oct 18;111(8):1631-1640. doi: 10.1016/j.bpj.2016.08.041. Biophys J. 2016. PMID: 27760351 Free PMC article.
-
A pressure-jump EPR system to monitor millisecond conformational exchange rates of spin-labeled proteins.Protein Sci. 2024 Dec;33(12):e5220. doi: 10.1002/pro.5220. Protein Sci. 2024. PMID: 39565088
-
A pressure-jump EPR system to monitor millisecond conformational exchange rates of spin-labeled proteins.bioRxiv [Preprint]. 2024 May 11:2024.05.07.593074. doi: 10.1101/2024.05.07.593074. bioRxiv. 2024. Update in: Protein Sci. 2024 Dec;33(12):e5220. doi: 10.1002/pro.5220 PMID: 38766191 Free PMC article. Updated. Preprint.
-
Viewing rare conformations of the β2 adrenergic receptor with pressure-resolved DEER spectroscopy.Proc Natl Acad Sci U S A. 2020 Dec 15;117(50):31824-31831. doi: 10.1073/pnas.2013904117. Epub 2020 Nov 30. Proc Natl Acad Sci U S A. 2020. PMID: 33257561 Free PMC article.
-
DEER-PREdict: Software for efficient calculation of spin-labeling EPR and NMR data from conformational ensembles.PLoS Comput Biol. 2021 Jan 22;17(1):e1008551. doi: 10.1371/journal.pcbi.1008551. eCollection 2021 Jan. PLoS Comput Biol. 2021. PMID: 33481784 Free PMC article.
References
-
- Fanucci GE, Lee JY, Cafiso DS. Spectroscopic evidence that osmolytes used in crystallization buffers inhibit a conformation change in a membrane protein. Biochemistry. 2003;42(45):13106–13112. - PubMed
-
- Mulder FA, Hon B, Muhandiram DR, Dahlquist FW, Kay LE. Flexibility and ligand exchange in a buried cavity mutant of T4 lysozyme studied by multinuclear NMR. Biochemistry. 2000;39(41):12614–12622. - PubMed
Publication types
MeSH terms
Substances
Grants and funding
LinkOut - more resources
Full Text Sources
Other Literature Sources

