. 2015 Apr 23;161(3):526-540.
doi: 10.1016/j.cell.2015.03.027.

Mammalian NET-Seq Reveals Genome-wide Nascent Transcription Coupled to RNA Processing

Affiliations

Mammalian NET-Seq Reveals Genome-wide Nascent Transcription Coupled to RNA Processing

Takayuki Nojima et al. Cell. .

Abstract

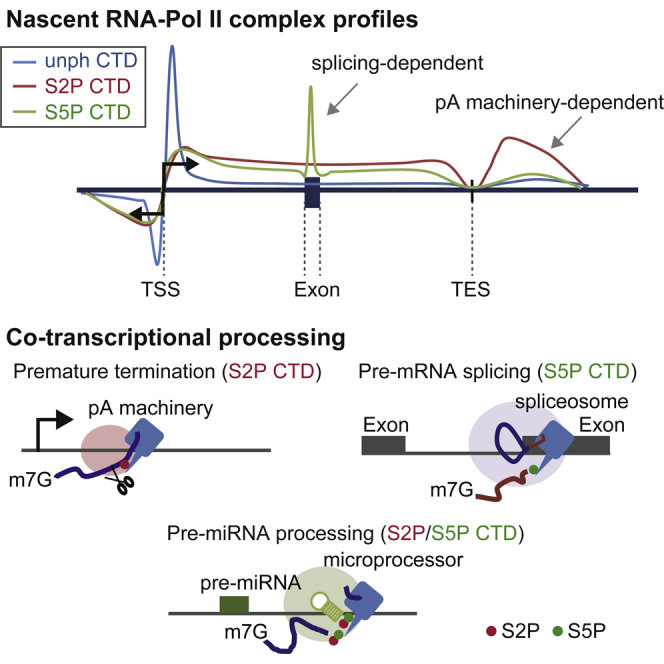
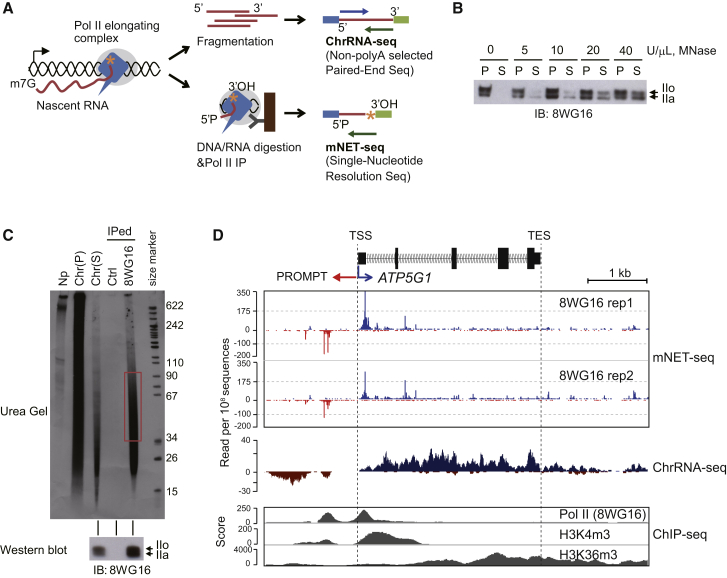
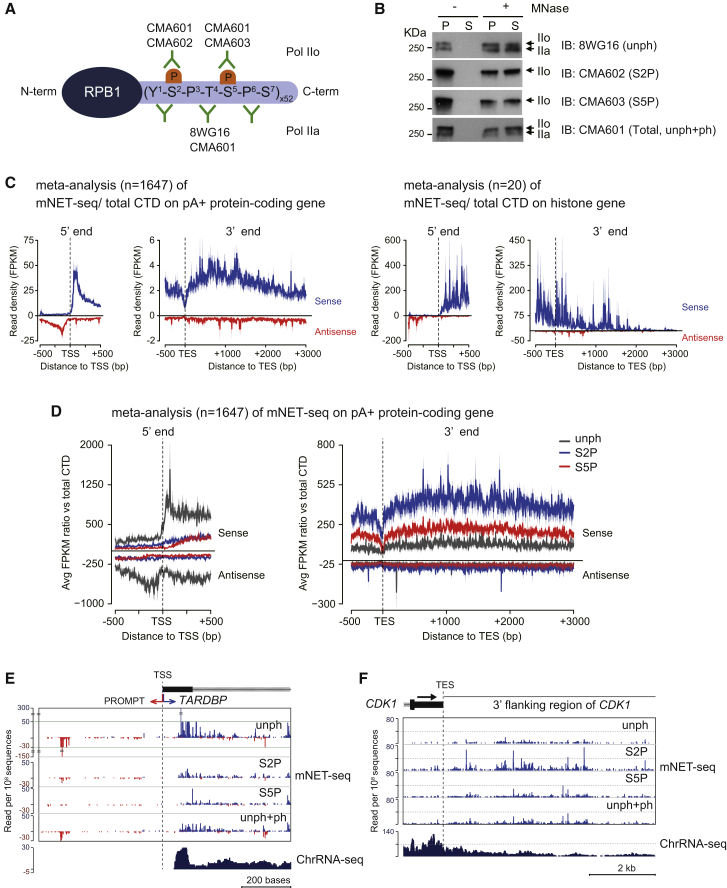
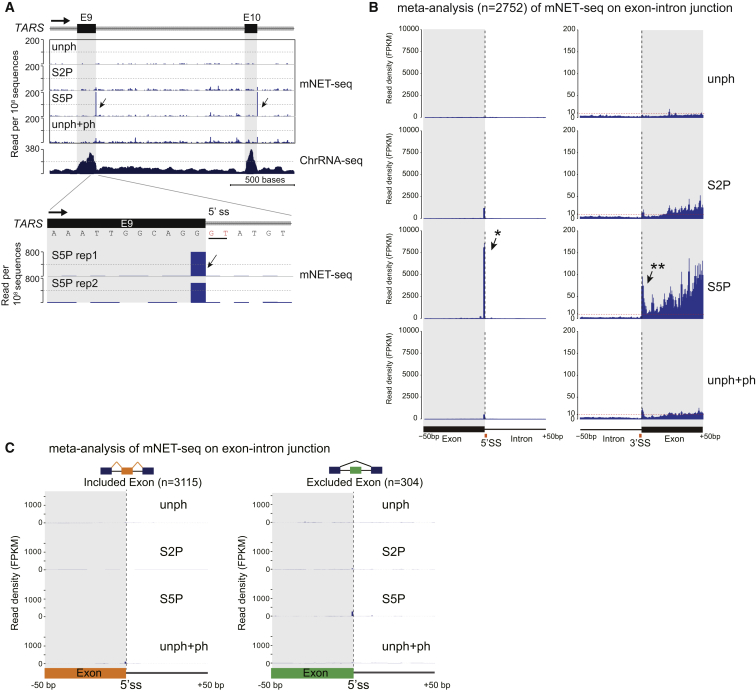
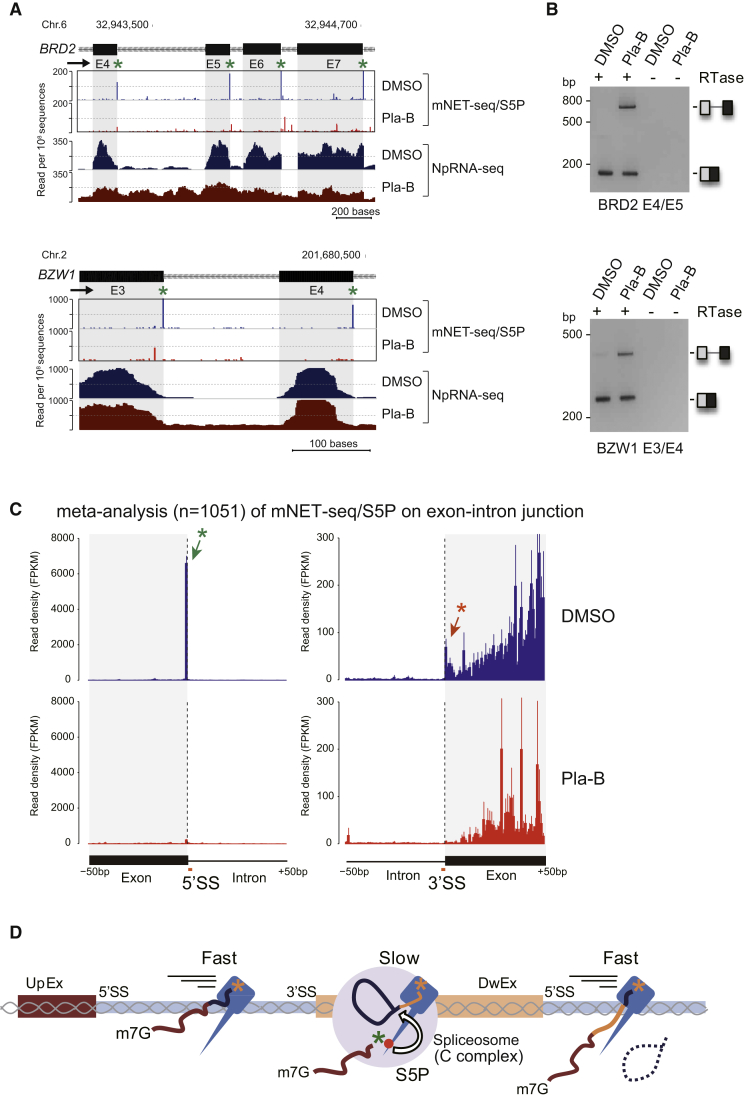
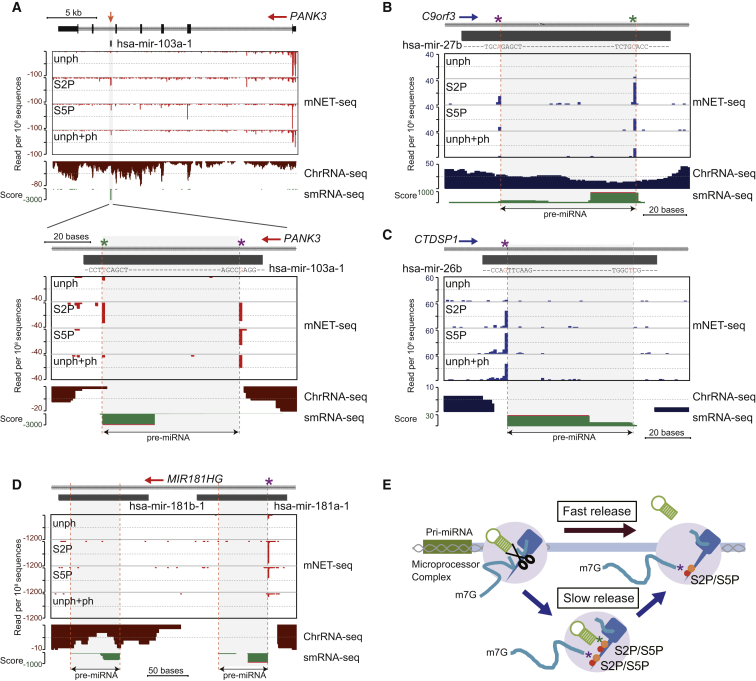
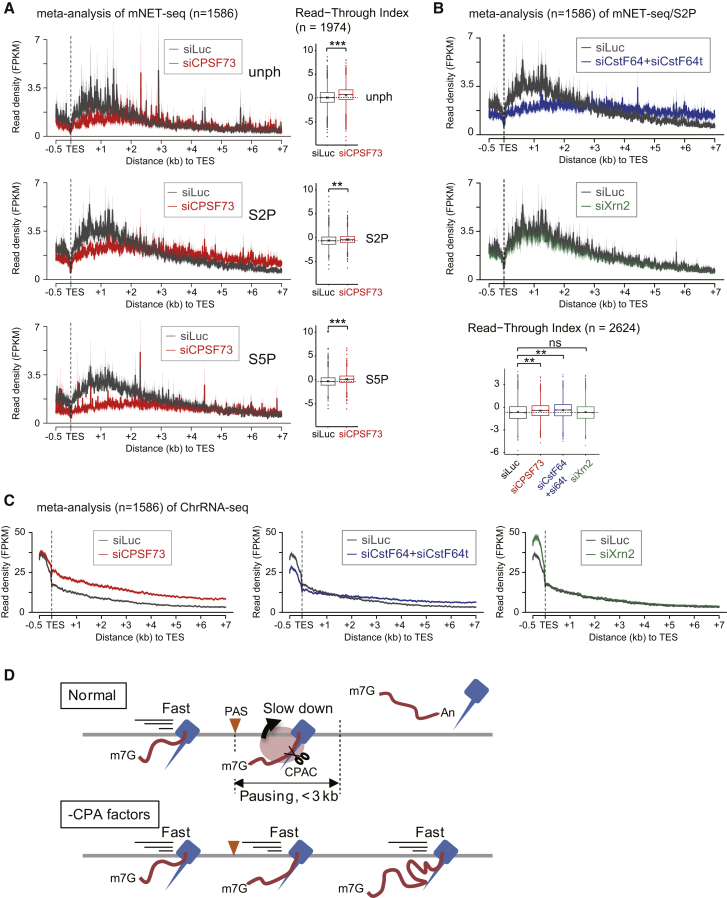
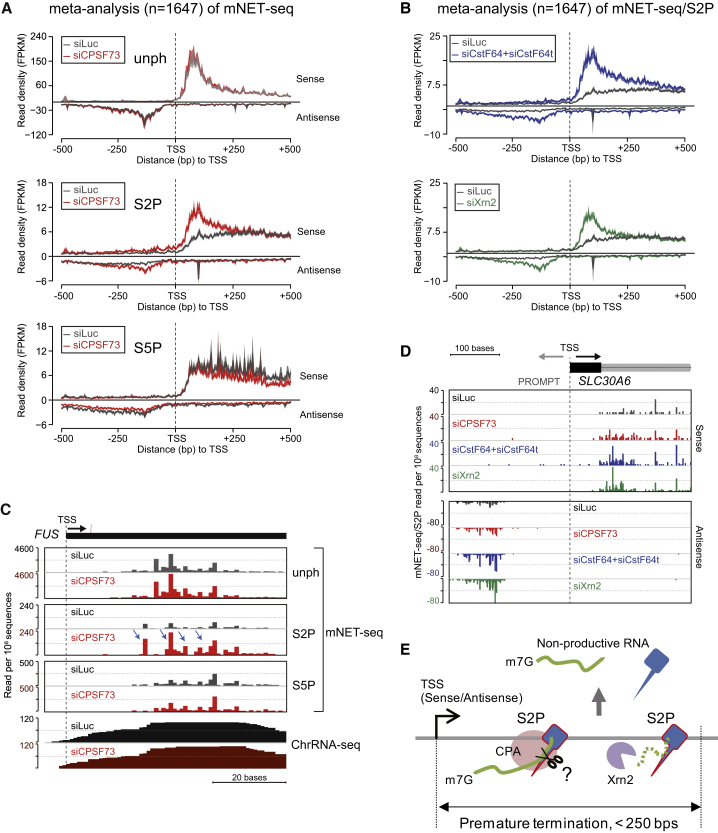
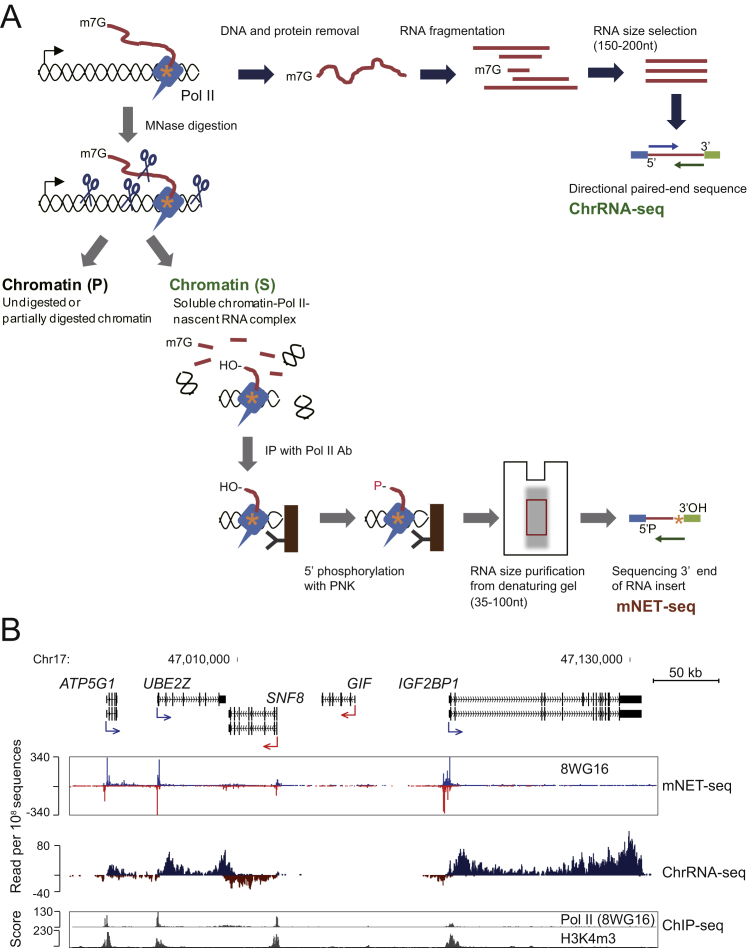
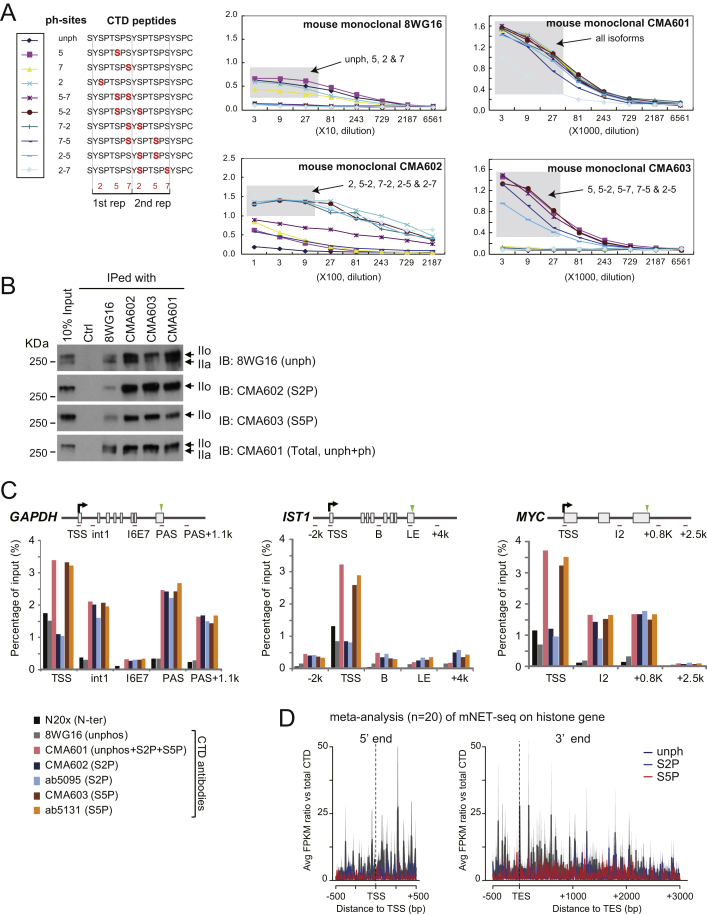
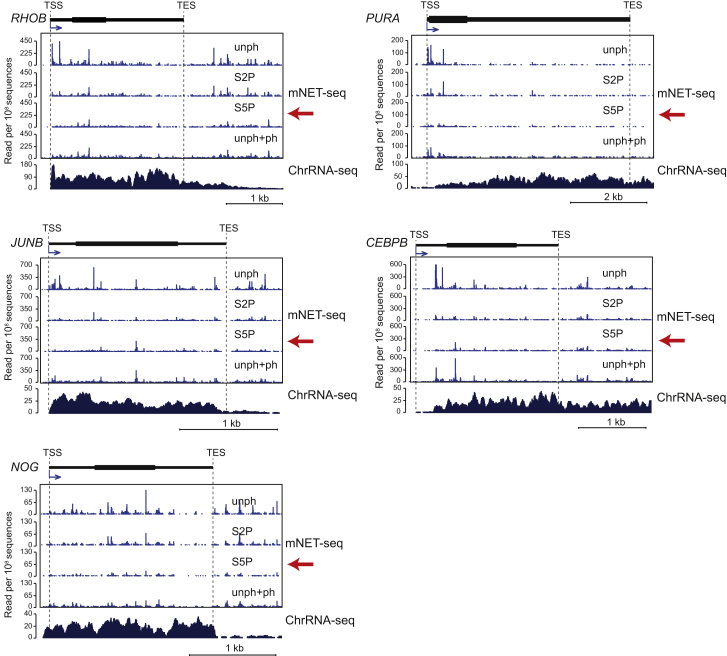
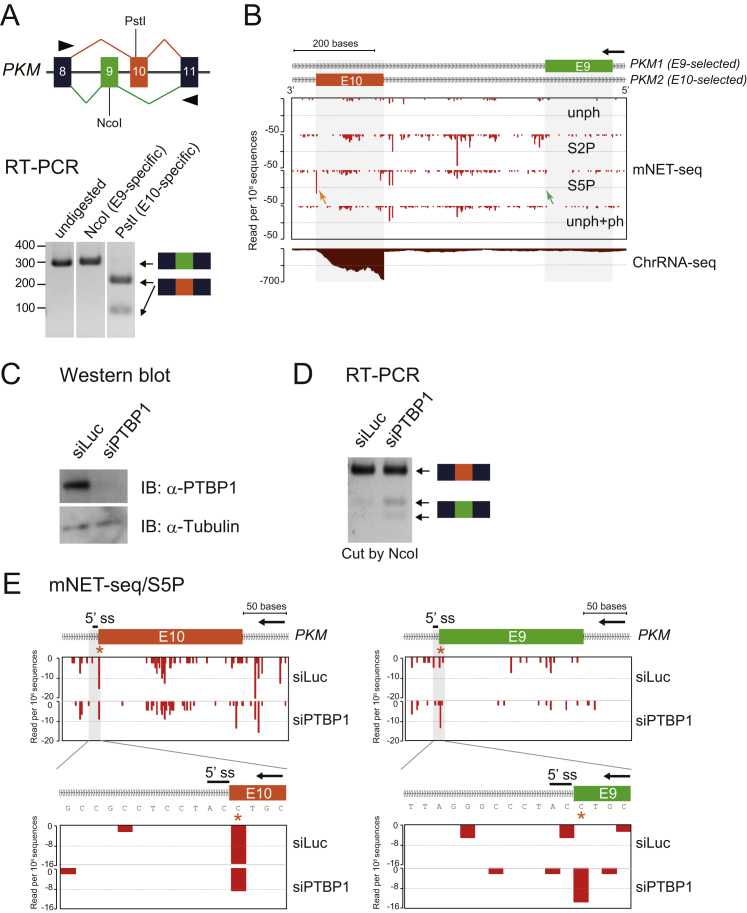
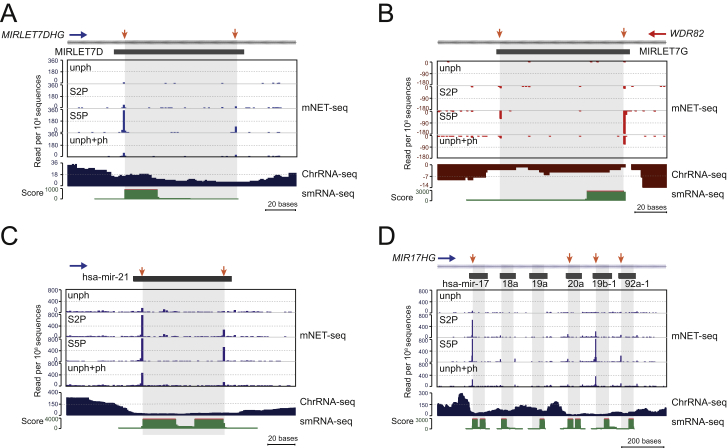
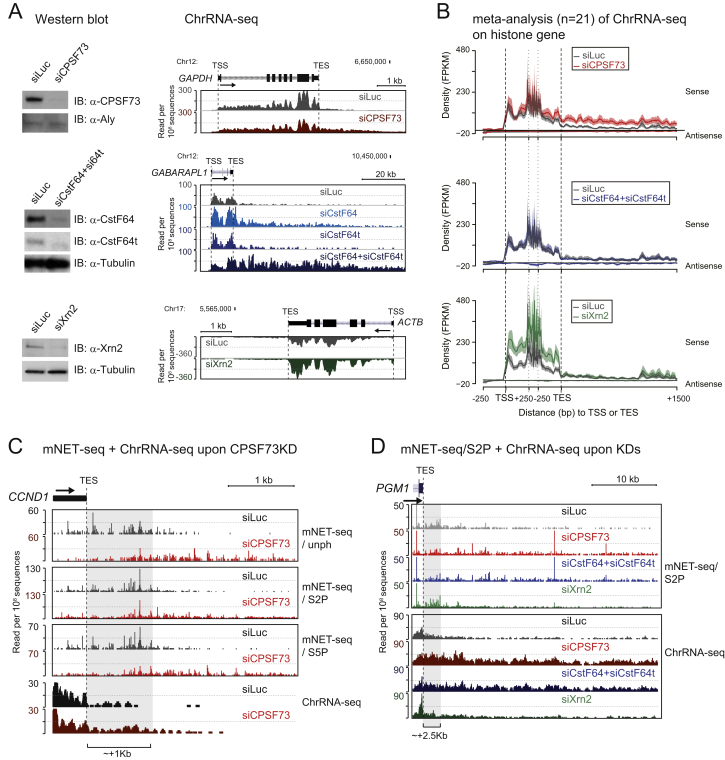
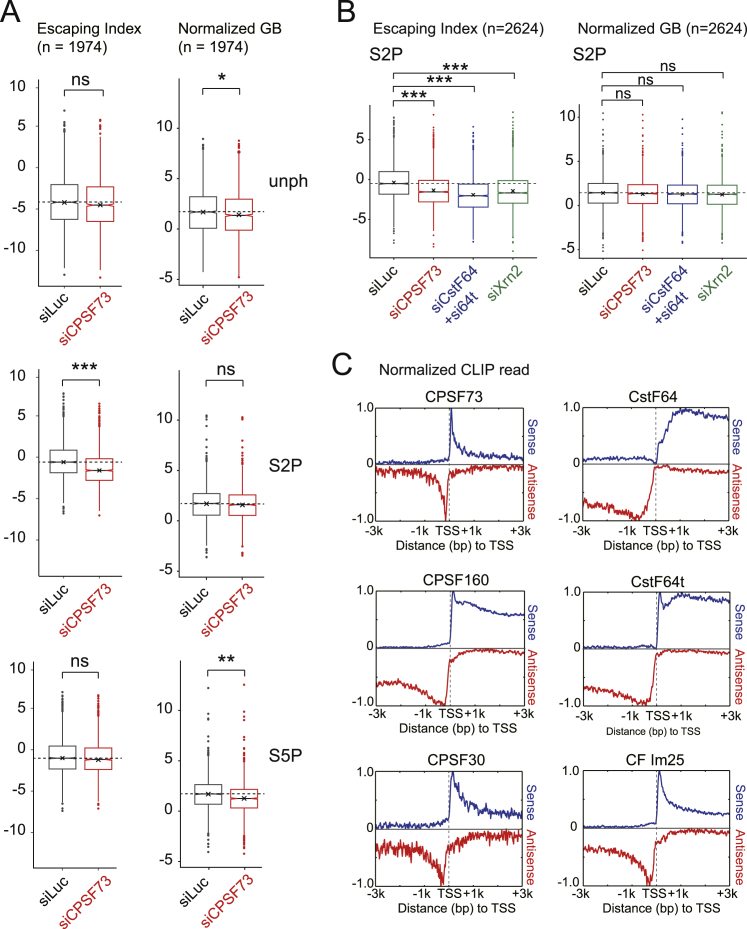
Transcription is a highly dynamic process. Consequently, we have developed native elongating transcript sequencing technology for mammalian chromatin (mNET-seq), which generates single-nucleotide resolution, nascent transcription profiles. Nascent RNA was detected in the active site of RNA polymerase II (Pol II) along with associated RNA processing intermediates. In particular, we detected 5'splice site cleavage by the spliceosome, showing that cleaved upstream exon transcripts are associated with Pol II CTD phosphorylated on the serine 5 position (S5P), which is accumulated over downstream exons. Also, depletion of termination factors substantially reduces Pol II pausing at gene ends, leading to termination defects. Notably, termination factors play an additional promoter role by restricting non-productive RNA synthesis in a Pol II CTD S2P-specific manner. Our results suggest that CTD phosphorylation patterns established for yeast transcription are significantly different in mammals. Taken together, mNET-seq provides dynamic and detailed snapshots of the complex events underlying transcription in mammals.


Figures

None
Graphical abstract
Figure 1
Figure 1
mNET-Seq Methodology (A) ChrRNA-seq and mNET-seq strategies. Pol II (blue) elongating complex (gray circle) and associated nascent RNA (red line) in chromatin. Orange asterisk depicts the 3'OH of nascent RNA. For ChrRNA-seq (top), fragmented nascent RNA is subjected to directional paired-end deep sequencing. For mNET-seq (bottom), DNA and RNA are digested with MNase and Pol II-nascent RNA complex precipitated with Pol II antibody. Isolated RNA is deep sequenced, and the 3′ end nucleotide uniquely mapped on the human genome. (B) Pol II release from insoluble chromatin DNA. Chromatin DNA was digested with increasing amounts of MNase. Western blot used 8WG16 Pol II antibody. P; pellet, S; supernatant. IIo and IIa indicate phosphorylated and unphosphorylated Pol II. (C) Nascent RNA distribution in mNET-seq method. Nascent RNA was 32P-labeled by NRO reaction. Fractionated nascent RNA are nucleoplasm (Np), chromatin pellet (Chr (P)) and supernatant (Chr (S)). IP was with 8WG16 Pol II antibody. 35–100 nt RNA purified from gel (red box). IPed Pol II was detected by western blot (bottom). (D) ATP5G1 mNET-seq. Two biological replicates of mNET-seq/unph using 8WG16 Pol II antibody. ChrRNA-seq shown as mNET-seq input. ChIP-seq (Pol II [8WG16], H3K4m3, and H3K36m3) data are from ENCODE project data sets (Consortium et al., 2012).
Figure 2
Figure 2
mNET-Seq with Different Phospho-CTD Modifications (A) Diagram showing different Pol II antibody epitopes on CTD (Stasevich et al., 2014). (B) Specificity of Pol II phosphorylation released from chromatin following MNase treatment with indicated Pol II antibodies. (C) Meta-analyses of mNET-seq/unph+ph on TSS and TES of pA+ protein-coding genes (left) and histone genes (right). Read density (FPKM) of mNET-seq data were plotted around TSS (±0.5 kb) and TES (−0.5 k∼+3 kb). Data on pA+ and histone genes are represented as mean ± SEM. mNET-seq sense strand, blue; antisense strand, red. (D) Meta-analyses of mNET-seq on TSS and TES of pA+ protein-coding genes. Ratio of read density (FPKM) of indicated mNET-seq data to mNET-seq/unph+ph data was plotted around TSS (±0.5 kb) and TES (−0.5 k∼+3 kb). unph, dark gray; S2P, blue; S5P, red. Line and shading represent mean ± SEM for each bin. (E and F) mNET-seq profiles over TSS of TARDBP (E) and TES of CDK1 (F). Read density, read per 108 sequences.
Figure 3
Figure 3
Exon Tethering to Ser5-Phosphorylated Pol II Complex (A) TARS mNET-seq profile with different antibodies, followed by expanded view of exon 9 5′SS. S5P-dominant peaks are indicated by black arrows. (B) Meta-analysis of mNET-seq profiles over 3′ ends (left) and 5′ ends (right) of co-transcriptionally spliced exons. Single asterisk, peak at 3′ end of spliced exon; double asterisk, accumulation of Pol II at 5′ end of spliced exon. (C) Meta-analysis of mNET-seq data over 5′SS of included exons (orange) and excluded exons (green). For (B) and (C), bars represent mean ± SEM for each base.
Figure 4
Figure 4
Effect of Splicing Inhibition on mNET-Seq and ChrRNA-Seq Profiles (A) mNET-seq and NpRNA-seq on BRD2 and BZW1 from HeLa cell treated with DMSO (blue) or splicing inhibitor Pla-B (red). Green asterisks denote 5′SS peaks. (B) RT-PCR analysis of indicated exon splicing showing unspliced and spliced RNA products. (C) Meta-analysis of mNET-seq/S5P around exon 5′SS and 3′SS from DMSO (blue) and Pla-B (red) treated HeLa cells. S5P-peaks at 5′ and 3′ ends of spliced exons are shown by orange and green asterisks, respectively. Bars represent mean ± SEM for each base. (D) Co-transcriptional splicing model. 3′OH of upstream exon (UpEx, dark red) and RNA in Pol II catalytic site are shown as green and orange asterisks, respectively. 3′OH of the UpEX RNA is protected in S5P Pol II-spliceosome C complex (gray circle). S5P Pol II pauses over DwEx.
Figure 5
Figure 5
Pre-miRNA Biogenesis from Protein-Coding Gene Introns (A–D) mNET-seq with different Pol II antibodies versus ChrRNA-seq over intronic pre-miRNAs. (A) mNET-seq data on PANK3 with magnified view over hsa-mir-103a-1 denoted by a black rectangle. The pre-miRNA is indicated by an orange arrow (top). Three other pre-miRNA are also shown: hsa-mir-27b (B), hsa-mir-26b (C), and hsa-mir181a/b-1 (D). Drosha cleavage sites are identified by dashed orange lines, and asterisks indicate frequent cleavage sites (5′ end, purple; 3′end, green). Small RNA-seq data are shown below (green). (E) Model of co-transcriptional pre-miRNA biogenesis. Pre-miRNA DNA and hairpin RNA are shown in green. Co-transcriptional Drosha cleavage (scissors) and spliceosome (gray) shown with 3′ ends of cleaved RNA (purple asterisk) and pre-miRNA (green asterisk) tethered to phosphorylated CTD. Pre-miRNA release may occur from the transcription complex, fast (dark red arrow) or slow (blue arrows).
Figure 6
Figure 6
Nascent RNA within Pol II Complex at TES (A) Meta-analysis of mNET-seq with indicated Pol II antibodies over TES regions (−0.5 k∼+7kb) from siLuc (dark gray) and siCPSF73 (red) treated HeLa cells (left) is shown. Also shown are RTIs of mNET-seq following CPSF73 knockdown (right). GB signals were divided by signals in a 2 kb region from TES (TES+2k) for RTI (see Extended Experimental Procedures). Dashed line is median of siLuc. (∗∗) p value < 8.52 × 10−11, and (∗∗∗) p value < 2.17 × 10−35 by two-sided Mann-Whitney test. (B) Meta-analysis of mNET-seq/S2P following termination factor knockdown over TES regions (top). siLuc (dark gray), siCstF64+siCstF64t (blue), and siXrn2 (green). RTI of mNET-seq following indicated knockdown (bottom) is shown. (∗∗) p value < 1.94 × 10−15 by two-sided Mann-Whitney test; ns indicates no difference between samples (p value = 0.9894 by two-sided Mann-Whitney test). (C) Meta-profiles of ChrRNA-seq following indicated knockdown over TES. siLuc (dark gray), siCPSF73 (red), siCstF64+siCstF64t (blue), and siXrn2 (green). (D) Model correlating Pol II pausing and PAS-dependent transcription termination at TES. RNA cleavage (scissors) by CPA complex (red circle) at PAS (orange triangle). Pol II elongation speed over 3′ flank region is regulated by PAS recognition on average over a 3 kb region from TES. For (A)–(C), line and shading represent mean ± SEM for each bin.
Figure 7
Figure 7
Promoter-Associated RNA Turnover Regulated by Termination Factors (A) Meta-analysis of mNET-seq with indicated Pol II antibodies over TSS regions (−0.5k∼+0.5 kb) from siLuc (dark gray) and siCPSF73 (red) treated HeLa cells (left). (B) Meta-analyses of mNET-seq/S2P following knockdown of CstF64+CstF64t (blue) and Xrn2 (green) at TSS (left). (C) mNET-seq of FUS with indicated Pol II antibodies and ChrRNA-seq from siLuc (dark gray) and siCPSF73 (red) treated HeLa cells. Increased mNET-seq/S2P signals following depletion of CPSF73 are denoted by blue arrows. (D) mNET-seq/S2P maps with indicated knockdowns around TSS of SLC30A6 on both mRNA and PROMPT strands. (E) Model showing effects of CPA and Xrn2 at TSS. S2P Pol II-CPA complex (red circle) cleaves TSS-associated nascent RNA, and Xrn2 (purple) degrades cleaved RNA from 5′ end to 3′ end over a region of 250 bp from TSS. For (A) and (B), line and shading represent mean ± SEM for each bin.
Figure S1
Figure S1
Detailed ChrRNA-Seq and mNET-Seq Methods, Related to Figure 1 (A) (Above) ChrRNA-seq method. Pol II and RNA synthesis site are diagrammed as tailed blue box and orange asterisk, respectively. Chromatin-bound RNA (red line) is purified from isolated chromatin fraction by DNase and proteinase K treatments. RNA is fragmented to 150–200 nt and adapters ligated on both ends for paired-end 51bases directional deep sequencing (blue and green arrows). (Below) mNET-seq method. Chromatin DNA and chromatin-bound RNA are digested with MNase I (light blue scissors). To separate insoluble pellet (P) and soluble chromatin supernatant (S), digested chromatin is centrifuged. Soluble Pol II-nascent RNA complex is immunoprecipitated (IP) with Pol II antibody. 5′ hydroxyl (OH) is then phosphorylated with PNK on beads and phenol extraction performed to remove DNA and proteins. IPed RNA is purified from denaturing gel (size range 35–100 nt). RNA adapters are added to both ends strand-specifically and deep sequencing is conducted from reverse sequence primer (green arrow) to read 3′ end of insert (orange asterisk). (B) Example of mNET-seq and ChrRNA-seq data view on human chromosome 17. mNET-seq and ChrRNA-seq reads on the plus strand, blue and dark blue, respectively; mNET-seq and ChrRNA-seq reads on the minus strand, red and dark red, respectively. ChIP-seq (Pol II [8WG16] and H3K4m3) data are from the ENCODE project data sets (Consortium et al., 2012).
Figure S2
Figure S2
Specificity of Pol II Antibodies, Related to Figure 2 (A) ELISA assay (right) was performed with indicated CTD heptapeptides (left) and Pol II antibodies (right). (B) Pol II precipitated from cell extracts with indicated antibodies detected by western blot using each antibody. (C) Pol II ChIP was conducted with indicated Pol II antibodies on GAPDH, IST1, and MYC. Positions of primer sets and PAS are shown by red bars and green triangles, respectively. TSS denoted by black arrow. (D) meta-analyses of mNET-seq on 5′ end (−0.5 k∼+0.5 kb from TSS) and 3′end (−0.5 k∼+3kb from TES) of histone gene. 8WG16 (unph), dark gray; CMA602 (S2P), blue; CMA603 (S5P), red; n = 20. Line and shading represent mean ± SEM for each bin.
Figure S3
Figure S3
Intronless Genes, Related to Figure 3 Example of intronless genes. mNET-seq with indicated Pol II antibodies and ChrRNA-seq data are shown on indicated intronless genes; RHOB, PURA, JUNB, CEBPB, and NOG. mNET-seq/S5P data set are indicated by red arrows. Read density, reads per 108 sequences.
Figure S4
Figure S4
mNET-seq Profiles for PKM Alternative Splicing after PTBP1 Depletion, Related to Figure 4 (A) PKM exons 8–11 are illustrated. Exon 9 (green) and exon 10 (orange) are mutually exclusive. PCR primers indicated as black triangles. RT-PCR products were digested with indicated exon-specific restriction enzyme (NcoI or PstI). (B) mNET-seq data around mutually exclusive exons 9 and 10 of PKM. mNET-seq/S5P signals at 3′ end of exon 9 and exon 10 are shown by green and orange arrows, respectively. Transcription direction, black arrow. (C) Western blot of PTBP1 and tubulin from siPTBP1-treated HeLa cells. (D) PKM RT-PCR products from PTBP1-depleted HeLa nuclear RNA were digested by NcoI. (E) mNET-seq/S5P data over mutually exclusive exons 9 and 10 of PKM from siLuc and siPTBP1-treated HeLa cells (top), followed by expanded view around 5′SS of introns 10 and 11. S5P-peaks at 3′ ends of exons, orange asterisks. Transcription direction, black arrows.
Figure S5
Figure S5
Further Examples of mNET-Seq and ChrRNA-Seq Profiles over Pre-miRNA, Related to Figure 5 mNET-seq analysis with unph, S2P, S5P, and unph+ph antibodies compared with ChrRNA-seq and small RNA-seq profiles for MIRLET7D (A), MIRLET7G (B), hsa-mir-21 (C), and MIR17HG (D). Note MIR17HG harbors polycistronic pre-miRNA. Frequent RNA cleavage sites (miRBase) are indicated by orange arrows.
Figure S6
Figure S6
mNET-Seq and ChrRNA-Seq Profiles upon CPA Factors and Xrn2 Knockdown, Related to Figure 6 (A) Termination defect on pA+ protein-coding genes. Western blots showing knockdown efficiencies of siRNA treatments for CPSF73, CstF64, CstF64t, and Xrn2. Aly and Tubulin proteins are loading controls (left). Termination defect detected following depletion of CPSF73 protein (red) on GAPDH (right top). Additive termination defect seen following double-knockdown of CstF64 and CstF64t (turquoise and blue and dark blue double) on GABARAPL1 (right middle). No termination defect detected following Xrn2 depletion (green) on ACTB (right bottom). (B) mNET-seq meta-profile on histone gene upon CPA factors and Xrn2 knockdown. Effect of siCPSF73 (red, top), siCstF64+siCstF64t (blue, middle), and siXrn2 (green, bottom). n = 21. Line and shading represent mean ± SEM for each bin. (C) TES of CCND1 as an example of mNET-seq with three different Pol II antibodies (top) and ChrRNA-seq (bottom) from siLuc (control siRNA, dark gray) and siCPSF73 (red) treated HeLa cells. Grey shaded region shows the decrease of Pol II density in siCPSF73-treated cells. (D) TES of PGM1 as an example of mNET-seq/S2P (top) and ChrRNA-seq (bottom) from siLuc (control siRNA, dark gray), siCPSF73 (red), siCstF64+siCstF64t (blue), and siXrn2 (green) treated HeLa cells. Grey shaded region shows the decrease of Pol II density in siCPSF73 and siCstF64+siCstF64t-teated cells.
Figure S7
Figure S7
TSS Escaping Indexes and CLIP Analysis, Related to Figure 7 (A) EI and normalized GB profiles of each mNET-seq (right). GB signals were divided by signals in promoter region (PRO, −50 to +250 bp over TSS) for EI. The EI (n = 1,974) and normalized GB (n = 1,974) with indicated Pol II antibodies and siRNA treatments are shown below. (∗∗∗) p value < 8.4 × 10−48, (∗∗) p value < 6.7 × 10−20 and () p value < 4.5 × 10−4 by two-sided Mann-Whitney test; (ns) indicates no difference between samples (p value > 0.001 by two-sided Mann-Whitney test). (B) The EI (left, n = 2,106) and normalized GB (right, n = 1,974) with indicated siRNA treatments are shown below. (∗∗∗) p value < 1.3 × 10−63 by two-sided Mann-Whitney test; (ns) indicates no difference between samples (p value > 0.001 by two-sided Mann-Whitney test). (C) CLIP analysis of TSS associated CPA factors (Martin et al., 2012). Normalized read counts and distance from TSS are shown at y and x axes. Sense, blue; antisense, red.

Similar articles

Cited by

References

    1. Adelman K., Lis J.T. Promoter-proximal pausing of RNA polymerase II: emerging roles in metazoans. Nat. Rev. Genet. 2012;13:720–731. - PMC - PubMed
    1. Adelman K., Marr M.T., Werner J., Saunders A., Ni Z., Andrulis E.D., Lis J.T. Efficient release from promoter-proximal stall sites requires transcript cleavage factor TFIIS. Mol. Cell. 2005;17:103–112. - PubMed
    1. Ahn S.H., Kim M., Buratowski S. Phosphorylation of serine 2 within the RNA polymerase II C-terminal domain couples transcription and 3′ end processing. Mol. Cell. 2004;13:67–76. - PubMed
    1. Alexander R.D., Innocente S.A., Barrass J.D., Beggs J.D. Splicing-dependent RNA polymerase pausing in yeast. Mol. Cell. 2010;40:582–593. - PMC - PubMed
    1. Almada A.E., Wu X., Kriz A.J., Burge C.B., Sharp P.A. Promoter directionality is controlled by U1 snRNP and polyadenylation signals. Nature. 2013;499:360–363. - PMC - PubMed

Supplemental References

    1. Hart T., Komori H.K., LaMere S., Podshivalova K., Salomon D.R. Finding the active genes in deep RNA-seq gene expression studies. BMC Genomics. 2013;14:778. - PMC - PubMed
    1. Li H., Handsaker B., Wysoker A., Fennell T., Ruan J., Homer N., Marth G., Abecasis G., Durbin R., 1000 Genome Project Data Processing Subgroup The Sequence Alignment/Map format and SAMtools. Bioinformatics. 2009;25:2078–2079. - PMC - PubMed
    1. Trapnell C., Williams B.A., Pertea G., Mortazavi A., Kwan G., van Baren M.J., Salzberg S.L., Wold B.J., Pachter L. Transcript assembly and quantification by RNA-Seq reveals unannotated transcripts and isoform switching during cell differentiation. Nat. Biotechnol. 2010;28:511–515. - PMC - PubMed

Publication types