Mitosis. Microtubule detyrosination guides chromosomes during mitosis
- PMID: 25908662
- PMCID: PMC4506776
- DOI: 10.1126/science.aaa5175
Mitosis. Microtubule detyrosination guides chromosomes during mitosis
Abstract
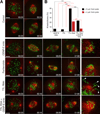
Before chromosomes segregate into daughter cells, they align at the mitotic spindle equator, a process known as chromosome congression. Centromere-associated protein E (CENP-E)/Kinesin-7 is a microtubule plus-end-directed kinetochore motor required for congression of pole-proximal chromosomes. Because the plus-ends of many astral microtubules in the spindle point to the cell cortex, it remains unknown how CENP-E guides pole-proximal chromosomes specifically toward the equator. We found that congression of pole-proximal chromosomes depended on specific posttranslational detyrosination of spindle microtubules that point to the equator. In vitro reconstitution experiments demonstrated that CENP-E-dependent transport was strongly enhanced on detyrosinated microtubules. Blocking tubulin tyrosination in cells caused ubiquitous detyrosination of spindle microtubules, and CENP-E transported chromosomes away from spindle poles in random directions. Thus, CENP-E-driven chromosome congression is guided by microtubule detyrosination.
Copyright © 2015, American Association for the Advancement of Science.
Conflict of interest statement
The authors declare no conflict of interests.
Figures


Comment in
-
Post-translational modifications: A chromosome's guide to the spindle equator.Nat Rev Mol Cell Biol. 2015 Jun;16(6):326-7. doi: 10.1038/nrm4000. Nat Rev Mol Cell Biol. 2015. PMID: 25999060 No abstract available.
Similar articles
-
Kinetochore motors drive congression of peripheral polar chromosomes by overcoming random arm-ejection forces.Nat Cell Biol. 2014 Dec;16(12):1249-56. doi: 10.1038/ncb3060. Epub 2014 Nov 10. Nat Cell Biol. 2014. PMID: 25383660
-
Leaving no-one behind: how CENP-E facilitates chromosome alignment.Essays Biochem. 2020 Sep 4;64(2):313-324. doi: 10.1042/EBC20190073. Essays Biochem. 2020. PMID: 32347304 Free PMC article. Review.
-
Impaired CENP-E Function Renders Large Chromosomes More Vulnerable to Congression Failure.Biomolecules. 2019 Jan 26;9(2):44. doi: 10.3390/biom9020044. Biomolecules. 2019. PMID: 30691136 Free PMC article.
-
Mechanisms of kinesin-7 CENP-E in kinetochore-microtubule capture and chromosome alignment during cell division.Biol Cell. 2019 Jun;111(6):143-160. doi: 10.1111/boc.201800082. Epub 2019 Feb 26. Biol Cell. 2019. PMID: 30784092 Review.
-
The Tubulin Code: A Navigation System for Chromosomes during Mitosis.Trends Cell Biol. 2016 Oct;26(10):766-775. doi: 10.1016/j.tcb.2016.06.001. Epub 2016 Jun 22. Trends Cell Biol. 2016. PMID: 27344407 Free PMC article. Review.
Cited by
-
Dual Chromatin and Cytoskeletal Remodeling by SETD2.Cell. 2016 Aug 11;166(4):950-962. doi: 10.1016/j.cell.2016.07.005. Cell. 2016. PMID: 27518565 Free PMC article.
-
ATAT1-enriched vesicles promote microtubule acetylation via axonal transport.Sci Adv. 2019 Dec 18;5(12):eaax2705. doi: 10.1126/sciadv.aax2705. eCollection 2019 Dec. Sci Adv. 2019. PMID: 31897425 Free PMC article.
-
CENP-E activation by Aurora A and B controls kinetochore fibrous corona disassembly.Nat Commun. 2023 Sep 1;14(1):5317. doi: 10.1038/s41467-023-41091-2. Nat Commun. 2023. PMID: 37658044 Free PMC article.
-
More than two populations of microtubules comprise the dynamic mitotic spindle.J Cell Sci. 2022 Feb 1;135(3):jcs258745. doi: 10.1242/jcs.258745. Epub 2022 Feb 2. J Cell Sci. 2022. PMID: 34907446 Free PMC article.
-
Posttranslational modifications of the cytoskeleton.Cytoskeleton (Hoboken). 2021 Apr;78(4):142-173. doi: 10.1002/cm.21679. Epub 2021 Jul 2. Cytoskeleton (Hoboken). 2021. PMID: 34152688 Free PMC article. Review.
References
-
- Barisic M, Aguiar P, Geley S, Maiato H. Kinetochore motors drive congression of peripheral polar chromosomes by overcoming random arm-ejection forces. Nature cell biology. 2014;16 - PubMed
Publication types
MeSH terms
Substances
Grants and funding
LinkOut - more resources
Full Text Sources
Other Literature Sources
Molecular Biology Databases

