

GPI-anchored proteins do not reside in ordered domains in the live cell plasma membrane
- PMID: 25897971
- PMCID: PMC4430820
- DOI: 10.1038/ncomms7969
GPI-anchored proteins do not reside in ordered domains in the live cell plasma membrane
Abstract
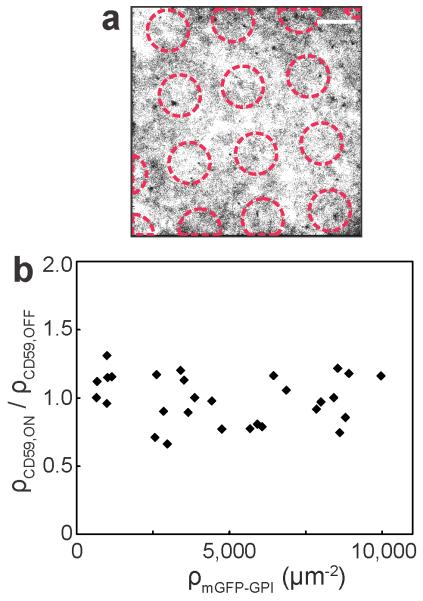
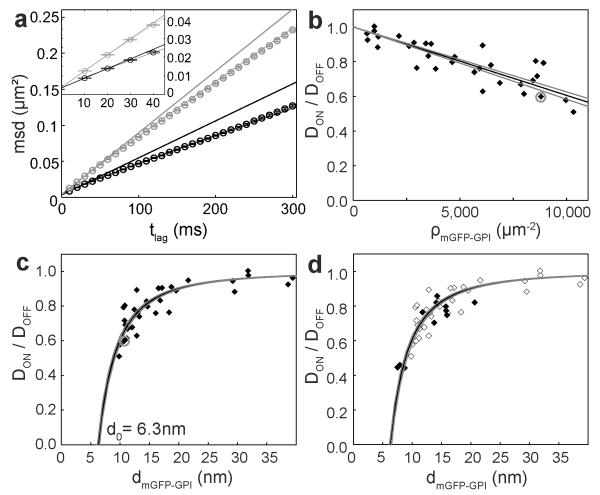
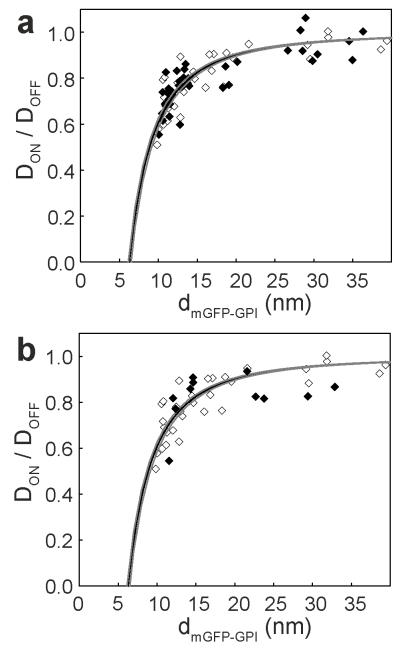
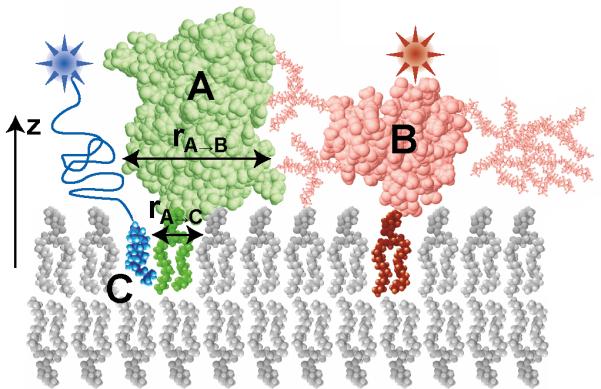
The organization of proteins and lipids in the plasma membrane has been the subject of a long-lasting debate. Membrane rafts of higher lipid chain order were proposed to mediate protein interactions, but have thus far not been directly observed. Here we use protein micropatterning combined with single-molecule tracking to put current models to the test: we rearranged lipid-anchored raft proteins (glycosylphosphatidylinositol(GPI)-anchored-mGFP) directly in the live cell plasma membrane and measured the effect on the local membrane environment. Intriguingly, this treatment does neither nucleate the formation of an ordered membrane phase nor result in any enrichment of nanoscopic-ordered domains within the micropatterned regions. In contrast, we find that immobilized mGFP-GPIs behave as inert obstacles to the diffusion of other membrane constituents without influencing their membrane environment over distances beyond their physical size. Our results indicate that phase partitioning is not a fundamental element of protein organization in the plasma membrane.
Figures


Similar articles
-
Transient GPI-anchored protein homodimers are units for raft organization and function.Nat Chem Biol. 2012 Sep;8(9):774-83. doi: 10.1038/nchembio.1028. Epub 2012 Jul 22. Nat Chem Biol. 2012. PMID: 22820419
-
Unraveling of Lipid Raft Organization in Cell Plasma Membranes by Single-Molecule Imaging of Ganglioside Probes.Adv Exp Med Biol. 2018;1104:41-58. doi: 10.1007/978-981-13-2158-0_3. Adv Exp Med Biol. 2018. PMID: 30484243 Review.
-
Differential insertion of GPI-anchored GFPs into lipid rafts of live cells.FASEB J. 2005 Jan;19(1):73-5. doi: 10.1096/fj.03-1338fje. Epub 2004 Oct 29. FASEB J. 2005. PMID: 15516372
-
Membrane insertion and intercellular transfer of glycosylphosphatidylinositol-anchored proteins: potential therapeutic applications.Arch Physiol Biochem. 2020 May;126(2):139-156. doi: 10.1080/13813455.2018.1498904. Epub 2018 Nov 16. Arch Physiol Biochem. 2020. PMID: 30445857 Review.
-
Revealing the Raft Domain Organization in the Plasma Membrane by Single-Molecule Imaging of Fluorescent Ganglioside Analogs.Methods Enzymol. 2018;598:267-282. doi: 10.1016/bs.mie.2017.06.038. Epub 2017 Oct 31. Methods Enzymol. 2018. PMID: 29306438
Cited by
-
Detection of misfolded protein aggregates from a clinical perspective.J Clin Transl Res. 2016 Mar 22;2(1):11-26. eCollection 2016 Apr 15. J Clin Transl Res. 2016. PMID: 30873457 Free PMC article. Review.
-
Determination of the Membrane Environment of CD59 in Living Cells.Biomolecules. 2018 May 17;8(2):28. doi: 10.3390/biom8020028. Biomolecules. 2018. PMID: 29772810 Free PMC article.
-
Protein Micropatterning Assay: Quantitative Analysis of Protein-Protein Interactions.Methods Mol Biol. 2017;1550:261-270. doi: 10.1007/978-1-4939-6747-6_18. Methods Mol Biol. 2017. PMID: 28188535 Free PMC article.
-
(Patho)Physiology of Glycosylphosphatidylinositol-Anchored Proteins I: Localization at Plasma Membranes and Extracellular Compartments.Biomolecules. 2023 May 18;13(5):855. doi: 10.3390/biom13050855. Biomolecules. 2023. PMID: 37238725 Free PMC article. Review.
-
Multi-level suppression of receptor-PI3K-mTORC1 by fatty acid synthase inhibitors is crucial for their efficacy against ovarian cancer cells.Oncotarget. 2017 Feb 14;8(7):11600-11613. doi: 10.18632/oncotarget.14591. Oncotarget. 2017. PMID: 28086243 Free PMC article.
References
-
- Singer SJ, Nicolson GL. The fluid mosaic model of the structure of cell membranes. Science. 1972;175:720–31. - PubMed
-
- Jacobson K, Mouritsen OG, Anderson RG. Lipid rafts: at a crossroad between cell biology and physics. Nat Cell Biol. 2007;9:7–14. - PubMed
-
- Palsdottir H, Hunte C. Lipids in membrane protein structures. Biochimica Et Biophysica Acta-Biomembranes. 2004;1666:2–18. - PubMed
-
- Niemela PS, et al. Membrane proteins diffuse as dynamic complexes with lipids. J Am Chem Soc. 2010;132:7574–5. - PubMed
Publication types
MeSH terms
Substances
Grants and funding
LinkOut - more resources
Full Text Sources
Other Literature Sources
