. 2015 Mar 20;17(1):42.
doi: 10.1186/s13058-015-0549-4.

Mesenchymal stem cells mediate the clinical phenotype of inflammatory breast cancer in a preclinical model

Affiliations

Mesenchymal stem cells mediate the clinical phenotype of inflammatory breast cancer in a preclinical model

Lara Lacerda et al. Breast Cancer Res. .

Abstract

Introduction: Inflammatory breast cancer (IBC) is an aggressive type of breast cancer, characterized by very rapid progression, enlargement of the breast, skin edema causing an orange peel appearance (peau d'orange), erythema, thickening, and dermal lymphatic invasion. It is characterized by E-cadherin overexpression in the primary and metastatic disease, but to date no robust molecular features that specifically identify IBC have been reported. Further, models that recapitulate all of these clinical findings are limited and as a result no studies have demonstrated modulation of these clinical features as opposed to simply tumor cell growth.

Methods: Hypothesizing the clinical presentation of IBC may be mediated in part by the microenvironment, we examined the effect of co-injection of IBC xenografts with mesenchymal stem/stromal cells (MSCs).

Results: MSCs co-injection significantly increased the clinical features of skin invasion and metastasis in the SUM149 xenograft model. Primary tumors co-injected with MSCs expressed higher phospho-epidermal growth factor receptor (p-EGFR) and promoted metastasis development after tumor resection, effects that were abrogated by treatment with the epidermal growth factor receptor (EGFR) inhibitor, erlotinib. E-cadherin expression was maintained in primary tumor xenografts with MSCs co-injection compared to control and erlotinib treatment dramatically decreased this expression in control and MSCs co-injected tumors. Tumor samples from patients demonstrate correlation between stromal and tumor p-EGFR staining only in IBC tumors.

Conclusions: Our findings demonstrate that the IBC clinical phenotype is promoted by signaling from the microenvironment perhaps in addition to tumor cell drivers.


Figures

Scheme 1
Scheme 1
Bilateral injections plan. Mice on control and erlotinib diets were injected bilaterally with SUM149 cells, but only half of the mice were co-injected in one side (left) with 10% mesenchymal stem cells (MSCs).
Figure 1
Figure 1
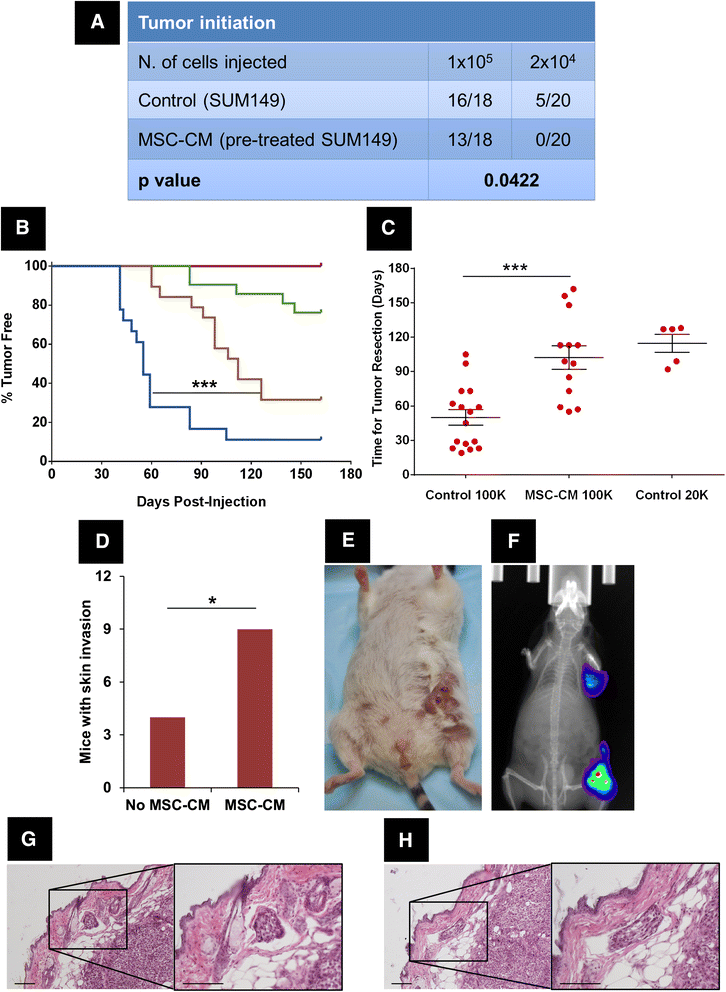
Pretreatment with conditioned medium from mesenchymal stem/stromal cells (MSC-CM) reduces tumor initiation and delays tumor growth but promotes skin invasion in an inflammatory breast cancer (IBC) xenograft model. SUM149 cells were cultured in vitro as mammospheres with and without MSC-CM for 5 days and then injected into the cleared mammary fat pad of SCID/Beige mice at two different dilutions: 1 × 105 and 2 × 104 (20 mice per group). Tumor initiation was monitored for 6 months. (A) Number of tumors observed in each group of injections. Tumor initiation of SUM149 cells following pretreatment with MSC-CM at permissive and restrictive cell dilutions is lower than control SUM149 cells. P = 0.04; ELDA. (B) Time to tumor initiation (palpable tumor). Blue line, control 1 × 105 cells; gold line, MSC-CM 1 × 105 cells; green line, control 2 × 104 cells; red line, MSC-CM 2 × 104 cells. *** P = 0.001, log-rank test. Tumor latency of SUM149 cells following pretreatment with MSC-CM (gold line) at a permissive cell dilution is longer than control SUM149 cells (blue line). (C) Time to tumor development between palpable and a volume of 300 mm3. Tumor growth of SUM149 cells following pretreatment with MSC-CM at a permissive cell dilution is slower comparing with control SUM149 cells. *** P = 0.001, Student’s t test. (D) Number of tumors that showed skin invasion in groups injected with 1 × 105 SUM149 cells. Tumors of SUM149 cells pretreated with MSC-CM invaded the skin of mice more frequently than control SUM149 cells. * P = 0.03, Fisher’s exact test. (E) Image of a mouse injected with SUM149 cells pretreated with MSC-CM showing gross skin involvement following primary tumor resection. (F) Image of same mouse as in E showing metastasis in the axilla by bioimaging of luciferase signal. (G and H) Hematoxylin and eosin (H&E) staining of tissue section from a mouse injected with 1 × 105 SUM149 cells pretreated with MSC-CM showing IBC characteristic dermal lymphovascular invasion (dermolymphatic tumor emboli). Scale bar is 200 μm in all images.
Figure 2
Figure 2
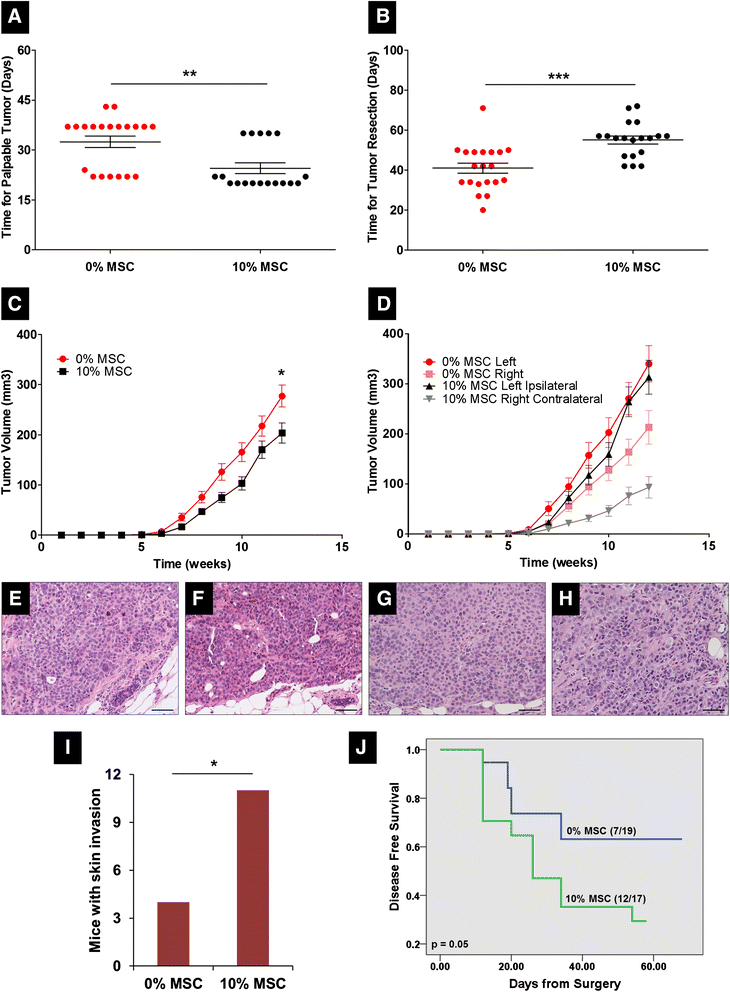
Mesenchymal stem/stromal cells (MSCs) inhibit primary tumor growth but increase skin invasion and development of metastasis. SUM149 cells (5 × 105) were injected bilaterally into the cleared mammary fat pad of SCID/Beige mice with or without MSCs (10% of total number of cells injected per mammary gland, see Scheme 1). Tumor growth and tumor-skin involvement were monitored and tumors were resected in a survival surgery when tumors reached a volume of 300 mm3. Development of metastases was monitored for 8 weeks post-resection of primary tumor. (A) Time for tumor first detection by palpation. Tumor latency of mice co-injected with 10% MSC is shorter than control group (0% MSC). ** P = 0.002, Student’s t test. (B) Time to tumor development between palpable and a volume of 300 mm3. Tumor growth of mice co-injected with 10% MSC is slower than control group (0% MSC). *** P = 0.001, Student’s t test. (C) Tumor growth curves of 0% and 10% MSC groups prepared with average of tumor burden per mouse, showing a statistical difference between groups. * P = 0.02, Student’s t test. (D) Tumor growth curves of 0% and 10% MSC groups prepared with average of tumor volume per side of injection, showing inhibition of contralateral tumors via co-injection of 10% MSC. (E) Hematoxylin and eosin (H&E) staining of tumor section of left-sided tumor from 0% MSC group. (F) H&E staining of tumor section of right-sided tumor from 0% MSC group. (G) H&E staining of tumor section of left-sided (ipsilateral) tumor from 10% MSC group. (H) H&E staining of tumor section of right-sided (contralateral) tumor from 10% MSC group. Scale bar is 100 μm in all images. (I) Number of tumors that showed skin invasion. Tumors of SUM149 cells co-injected with 10% MSC invaded the skin of mouse more frequently than control SUM149 cells (0% MSC). * P = 0.02, Fisher’s exact test. (J) Metastasis-free survival curve. Blue line, 0% MSC; green line, 10% MSC. P = 0.05, log-rank test. Mice co-injected with 10% MSC developed more rapidly spontaneous metastasis after resection than control group.
Figure 3
Figure 3
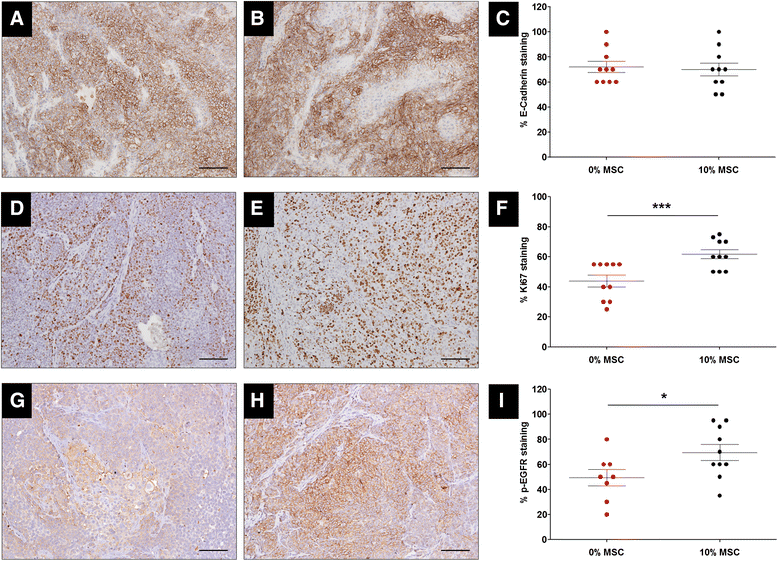
Tumor proliferation and epidermal growth factor receptor (EGFR) signaling are increased in mice co-injected with SUM149 cells and mesenchymal stem/stromal cells (MSCs). SUM149 cells (5 × 105) were injected bilaterally into the cleared mammary fat pad of SCID/Beige mice with or without MSCs (10% of total number of cells injected per mammary gland). Tumors were resected in a survival surgery when tumors reached a volume of 300 mm3, fixed in formalin, embedded in paraffin, cut, stained and scored by a pathologist specialized in inflammatory breast cancer (IBC). (A) E-cadherin staining of tumor section from 0% MSC group. (B) E-cadherin staining of tumor section from 10% MSC group. (C) Quantification and comparison of E-cadherin staining between 0% and 10% MSC groups. E-cadherin staining was similar between 0% and 10% groups. P = NS, Student’s t test. (D) Ki-67 staining of tumor section from 0% MSC group. (E) Ki-67 staining of tumor section from 10% MSC group. (F) Quantification and comparison of Ki-67 staining between 0% and 10% MSC groups. Ki-67 staining from 10% MSC group was higher than in 0% MSC group (61.8% vs. 44.0%). *** P = 0.001, Student’s t test. (G) Phospho-EGFR (p-EGFR) staining of tumor section from 0% MSC group. (H) p-EGFR staining of tumor section from 10% MSC group. (I) Quantification and comparison of p-EGFR staining between 0% and 10% MSC groups. p-EGFR staining from 10% MSC group was higher than in 0% MSC group (69.5% vs. 49.4%). * P = 0.05, Student’s t test. Scale bar is 200 μm in all images.
Figure 4
Figure 4
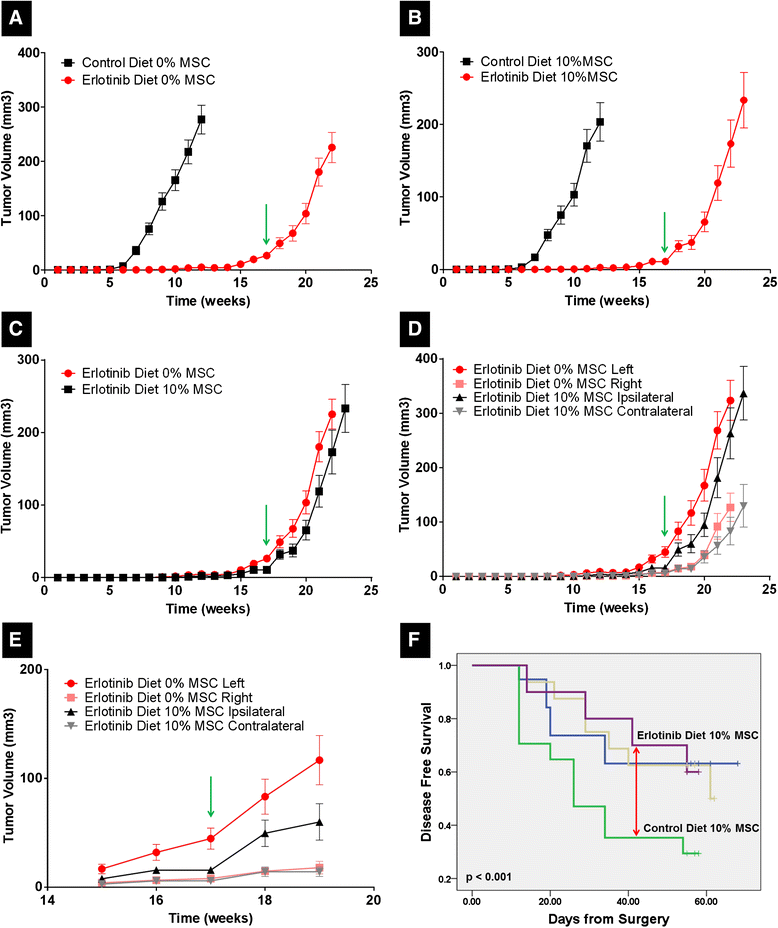
Mesenchymal stem/stromal cells (MSCs) increase the sensitivity of metastatic inflammatory breast cancer (IBC) xenografts to erlotinib. SUM149 cells (5 × 105) were injected bilaterally into the cleared mammary fat pad of SCID/Beige mice with or without MSCs (10% of total number of cells injected per mammary gland, see Scheme 1). Mice were treated with erlotinib diet (dose of 40 mg/kg per day). Treatment started on day 1 following injection of cells and ended 17 weeks later. Tumor growth was monitored and tumors were resected in a survival surgery when tumors reached a volume of 300 mm3. Development of metastases was monitored for 8 weeks post-resection of primary tumor. (A) Tumor growth curves of 0% MSC groups treated with and without erlotinib, prepared with average of tumor burden per mouse. Green arrow indicates when erlotinib treatment was discontinued. (B) Tumor growth curves of 10% MSC groups treated with and without erlotinib, prepared with average of tumor burden per mouse. Green arrow indicates when erlotinib treatment was discontinued. (C) Tumor growth curves of 0% and 10% MSC groups treated with erlotinib, prepared with average of tumor burden per mouse, showing no statistical difference between groups. P = NS, Student’s t test. Green arrow indicates when erlotinib treatment was discontinued. (D) Tumor growth curves of 0% and 10% MSC groups treated with erlotinib, prepared with average of tumor volume per side of injection, showing no difference between right side of 0% and 10% groups and left side of 0% and 10% groups. Green arrow indicates when erlotinib treatment was discontinued. (E) Tumor growth curves between weeks 15 and 19 of 0% and 10% MSC groups treated with erlotinib, prepared with average of tumor volume per side of injection, showing that erlotinib inhibited the effects promoted by MSC in the contralateral tumors. Erlotinib treatment was stopped at 17 weeks (green arrow). (F) Metastasis-free survival curve. Purple line, 10% MSC group treated with erlotinib diet; tan line, 0% MSC group treated with erlotinib diet; blue line, 0% MSC group treated with control diet; green line, 10% MSC groups treated with control diet. P = 0.001, log-rank test. Erlotinib treatment inhibited mice co-injected with 10% MSC to developed spontaneous metastasis after resection in comparison with 10% MSC untreated group.
Figure 5
Figure 5
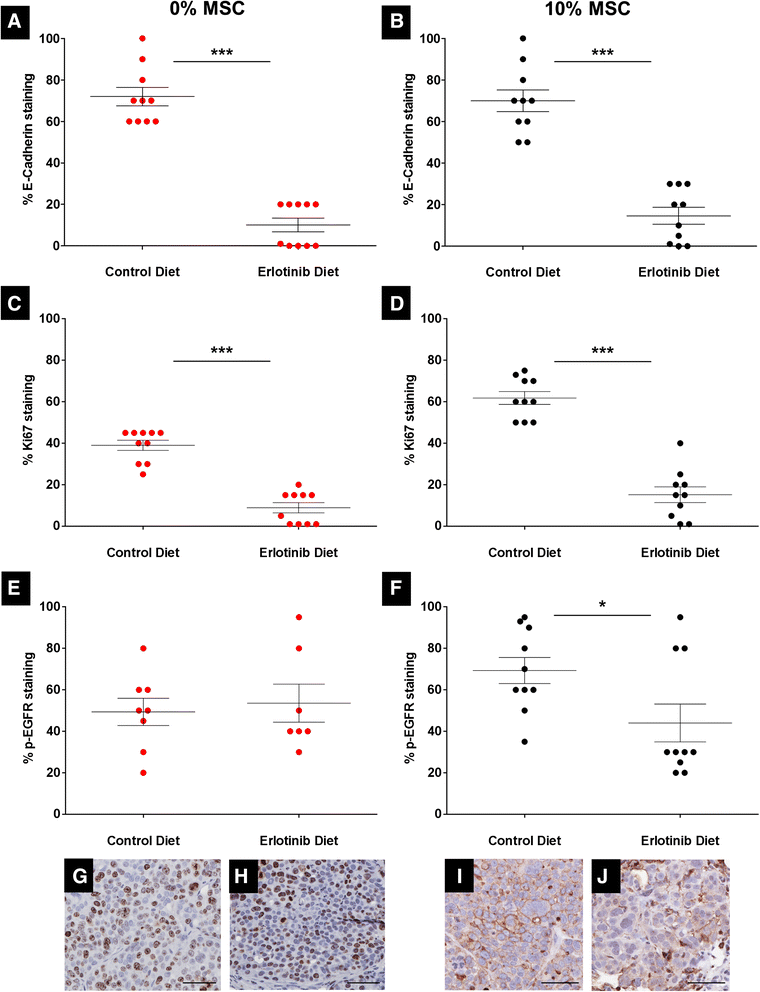
Epidermal growth factor receptor (EGFR) signaling in mice co-injected with SUM149 cells and mesenchymal stem/stromal cells (MSCs) is decreased by erlotinib treatment. SUM149 cells (5 × 105) were injected bilaterally into the cleared mammary fat pad of SCID/Beige mice with or without MSCs (10% of total number of cells injected per mammary gland, see Scheme 1). Mice were treated with erlotinib diet (dose of 40 mg/kg per day). Treatment started on day 1 following injection of cells and ended 17 weeks later. Tumors were resected in a survival surgery when tumors reached a volume of 300 mm3, fixed in formalin, embedded in paraffin, cut, stained and scored by a pathologist specialized in inflammatory breast cancer (IBC). Metastases were collected and processed as the tumors 8 weeks post-resection of primary tumors. (A) Quantification and comparison of E-cadherin staining between control (untreated) and erlotinib-treated groups of mice that were injected only with SUM149 cells. E-cadherin staining of tumor sections from 0% MSC group treated with erlotinib was lower than in untreated 0% MSC group (control diet) (72.0% vs. 10.1%). *** P = 0.001, Student’s t test. (B) Quantification and comparison of E-cadherin staining between control (untreated) and erlotinib-treated groups of mice that were co-injected with SUM149 cells and MSCs. E-cadherin staining of tumor sections from 10% MSC group treated with erlotinib was lower than in untreated 10% MSC group (control diet) (70.0% vs. 14.6%). *** P = 0.001, Student’s t test. (C) Quantification and comparison of Ki-67 staining between control (untreated) and erlotinib-treated groups of mice that were injected only with SUM149 cells. Ki-67 staining of tumor sections from 0% MSC group treated with erlotinib was lower than in untreated 0% MSC group (control diet) (39.0% vs. 8.9%). *** P = 0.001, Student’s t test. (D) Quantification and comparison of Ki-67 staining between control (untreated) and erlotinib-treated groups of mice that were co-injected with SUM149 cells and MSCs. Ki-67 staining of tumor sections from 10% MSC group treated with erlotinib was lower than in untreated 10% MSC group (control diet) (61.8% vs. 15.2%). *** P = 0.001, Student’s t test. (E) Quantification and comparison of phospho-EGFR (p-EGFR) staining between control (untreated) and erlotinib-treated groups of mice that were injected only with SUM149 cells. p-EGFR staining of tumor sections from 0% MSC groups was similar regardless of treatment with erlotinib (49.4% vs. 53.6%). P = NS, Student’s t test. (F) Quantification and comparison of p-EGFR staining between control (untreated) and erlotinib-treated groups of mice that were co-injected with SUM149 cells and MSCs. p-EGFR staining of tumor sections from 10% MSC group treated with erlotinib was lower than in untreated 10% MSC group (control diet) (69.3% vs. 44.0%). *** P = 0.03, Student’s t test. (G) Ki-67 staining of metastasis section from 10% MSC group in control diet. (H) Ki-67 staining of metastasis section from 10% MSC group in erlotinib diet. (I) p-EGFR staining of metastasis section from 10% MSC group in control diet. (J) p-EGFR staining of metastasis section from 10% MSC group in erlotinib diet. Scale bar is 100 μm in all images.
Figure 6
Figure 6
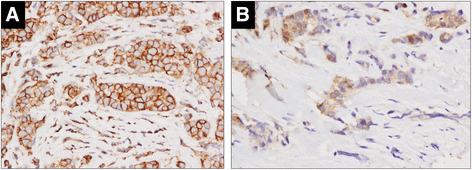
Phospho-epidermal growth factor receptor (p-EGFR) tumor and stromal staining intensity is correlated in inflammatory breast cancer (IBC) but not in non-IBC. Primary tumor samples obtained from breast cancer patients at MD Anderson Cancer Center (details about the patients are described in reference [18]) were used to create a tissue microarray (TMA), which was stained for p-EGFR. Tumor and stroma staining was scored by a pathologist specialized in IBC. (A) Representative p-EGFR staining of tumor section from IBC patient (estrogen receptor (ER)/progesterone receptor (PR) and human epidermal growth factor receptor 2 (HER2) negative) scored as tumor 3+ and stroma 3+. (B) Representative p-EGFR staining of tumor section from non-IBC patient (ER/PR negative and HER2 positive) scored as tumor 2+ and stroma 0 to 1. 400X magnification in both images.

Similar articles

Cited by

References

    1. Gonzalez-Angulo AM, Hennessy BT, Broglio K, Meric-Bernstam F, Cristofanilli M, Giordano SH, et al. Trends for inflammatory breast cancer: is survival improving? Oncologist. 2007;12:904–912. doi: 10.1634/theoncologist.12-8-904. - DOI - PubMed
    1. Makower D, Sparano JA. How do I treat inflammatory breast cancer? Curr Treat Options in Oncol. 2013;14:66–74. doi: 10.1007/s11864-012-0214-4. - DOI - PubMed
    1. Van Laere SJ, Ueno NT, Finetti P, Vermeulen PB, Lucci A, Robertson FM, et al. Uncovering the molecular secrets of Inflammatory Breast Cancer biology: An integrated analysis of three distinct Affymetrix gene expression data sets. Clin Cancer Res. 2013;19:4685–4696. doi: 10.1158/1078-0432.CCR-12-2549. - DOI - PMC - PubMed
    1. Robertson FM, Petricoin EF, III, Van Laere SJ, Bertucci F, Chu K, Fernandez SV, et al. Presence of anaplastic lymphoma kinase in inflammatory breast cancer. SpringerPlus. 2013;2:497. doi: 10.1186/2193-1801-2-497. - DOI - PMC - PubMed
    1. Klopp AH, Gupta A, Spaeth E, Andreeff M, Marini F., 3rd Concise review: dissecting a discrepancy in the literature: do mesenchymal stem cells support or suppress tumor growth? Stem Cells. 2011;29:11–19. doi: 10.1002/stem.559. - DOI - PMC - PubMed

Publication types

MeSH terms