. 2015 Jun 15;75(12):2520-9.
doi: 10.1158/0008-5472.CAN-14-3095. Epub 2015 Apr 16.

Grapefruit-Derived Nanovectors Use an Activated Leukocyte Trafficking Pathway to Deliver Therapeutic Agents to Inflammatory Tumor Sites

Affiliations

Grapefruit-Derived Nanovectors Use an Activated Leukocyte Trafficking Pathway to Deliver Therapeutic Agents to Inflammatory Tumor Sites

Qilong Wang et al. Cancer Res. .

Erratum in

Abstract

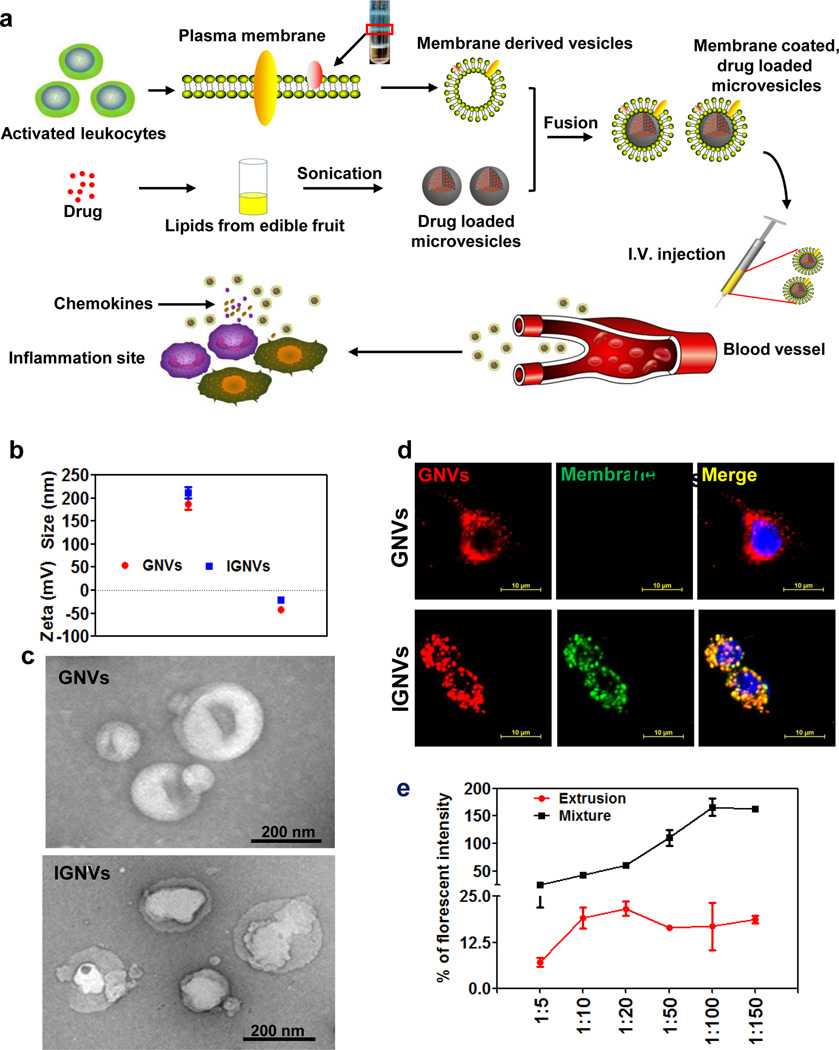
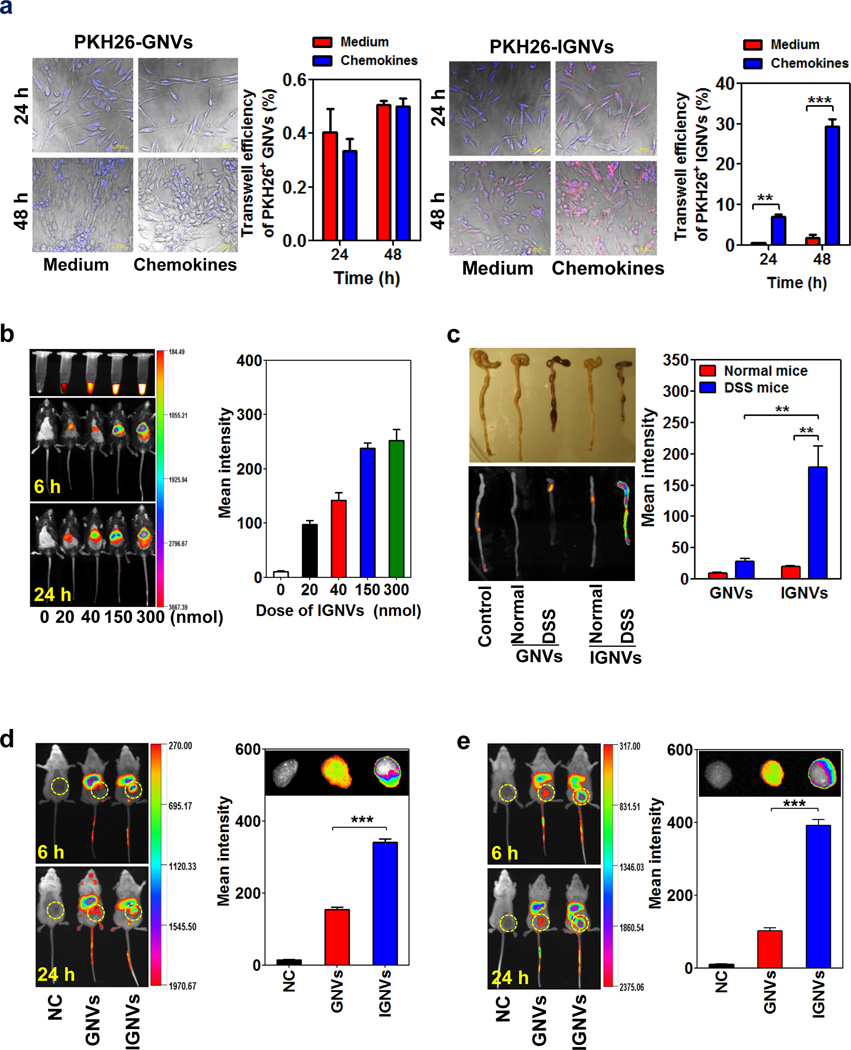
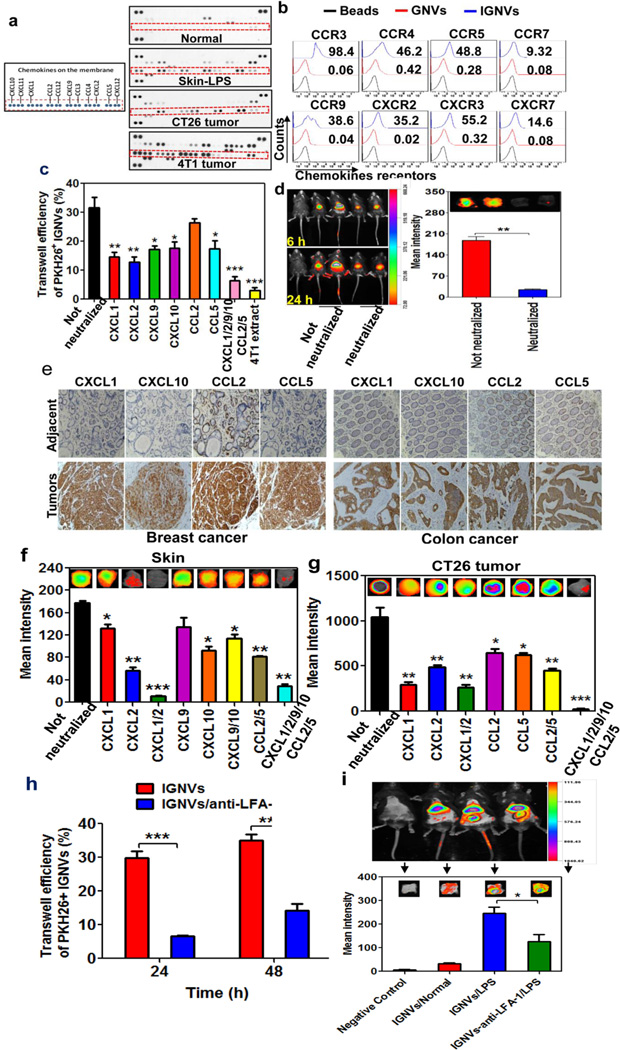
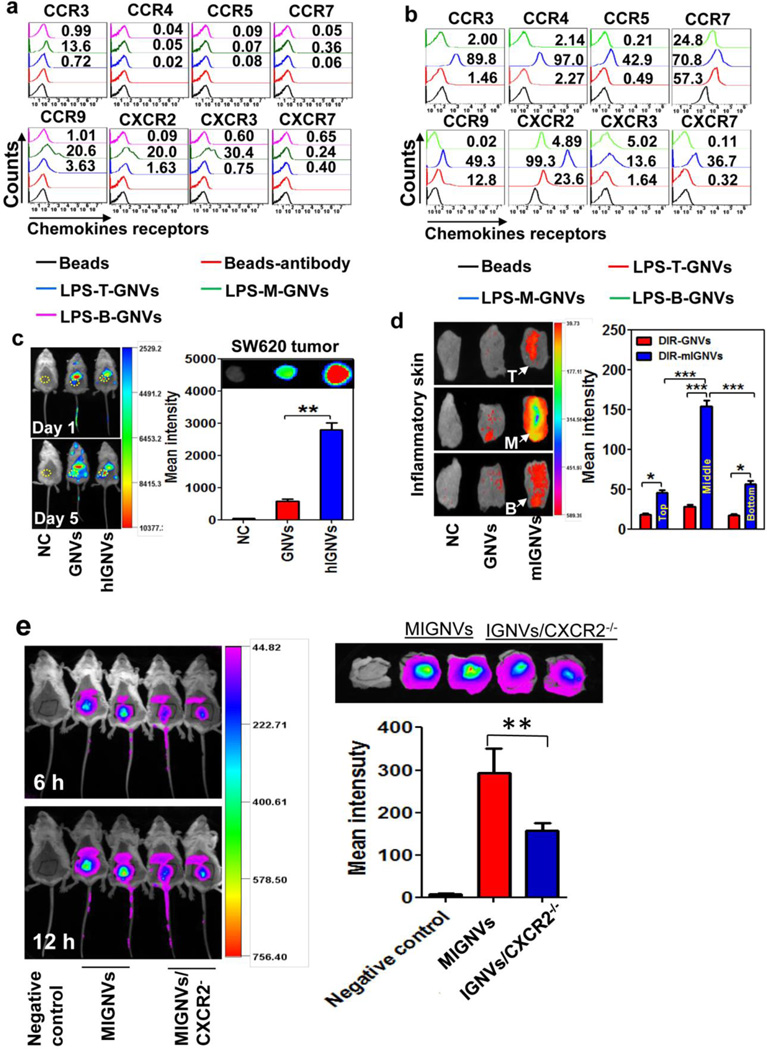
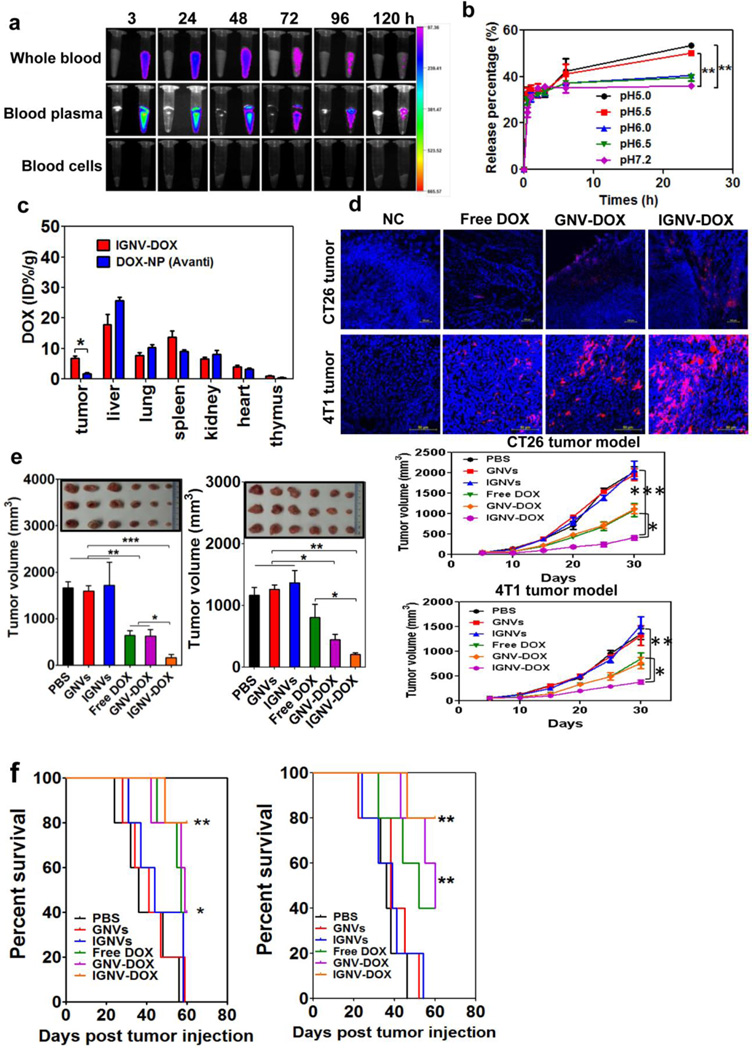
Inflammation is a hallmark of cancer. Activated immune cells are intrinsically capable of homing to inflammatory sites. Using three inflammatory-driven disease mouse models, we show that grapefruit-derived nanovectors (GNV) coated with inflammatory-related receptor enriched membranes of activated leukocytes (IGNVs) are enhanced for homing to inflammatory tumor tissues. Blocking LFA-1 or CXCR1 and CXCR2 on the IGNVs significantly inhibits IGNV homing to the inflammatory tissue. The therapeutic potential of IGNVs was further demonstrated by enhancing the chemotherapeutic effect as shown by inhibition of tumor growth in two tumor models and inhibiting the inflammatory effects of dextran sulfate sodium-induced mouse colitis. The fact that IGNVs are capable of homing to inflammatory tissue and that chemokines are overexpressed in diseased human tissue provides the rationale for using IGNVs to more directly deliver therapeutic agents to inflammatory tumor sites and the rationale for the use of IGNVs as treatment for certain cancers in personalized medicine.


Conflict of interest statement

CONFLICT OF INTEREST: No potential conflicts of interest were disclosed.

Figures

Figure 1
Figure 1. Characterization of plasma membrane-coated GNVs (IGNVs)
a, Schematics of the preparation process of the IGNVs and drug loaded-GNV microvesicles for targeted delivery of therapeutic agents to inflammatory sites. b, Size distribution and surface Zeta potential of free GNVs (red) and EL4 cells plasma membrane coated GNVs (IGNVs, blue) were measured using a ZetaSizer. c, Free GNVs (left) and IGNVs (right) were visualized and imaged by scanning electron microscopy. d, The co-localization of the EL4 cell derived plasma membranes and GNV cores. For assembling IGNVs, the EL4 cell derived plasma membranes were labeled with PKH67 green dye and GNV cores were labeled with PKH26 red dye. 4T1 cells were cultured in the presence of GNVs (upper panel) or IGNVs (bottom panel) for 12 h. Representative images of cells were then taken using a confocal microscope at a magnification of ×400. e, FRET based measurements of IGNV formation. DiO labeled GNVs and DPA labeled membrane vesicles (n=3) were mixed, and subsequently the mixture was extruded 20 times through a 200 nm polycarbonate porous membrane using an Avanti mini extruder or the mixture without further extrusion was used as a control. The extruded products and the mixed products were then diluted and the intensity of fluorescence was measured. Data (b, c, d and e) are representative of three independent experiments.
Figure 2
Figure 2. IGNVs utilize the activated leukocyte membrane dependent pathways and efficiently target delivery of IGNVs to inflammatory sites
a, Transwell assay for detecting chemotaxis of EL4 cell plasma membrane coated GNVs. HUVEC cells were cultured in the upper chamber and 4TO7 cells were cultured in the lower chamber of a transwell plate. Transmigration of the PKH26 (red color) labeled GNVs or IGNVs were imaged after 24 h and 48 h in culture using a confocal microscope. The intensity of the fluorescent signal of media in the lower chamber (n=3) was measured and expressed as the % of transwell efficiency of fluorescent intensity of PKH26 labeled GNVs or IGNVs. Data are representative of three independent experiments. Distribution of DiR dye labeled IGNVs in: b, LPS induced skin acute inflammatory mouse model; c, DSS induced colitis mice; d, CT26 tumor model; and e, 4T1 tumor model. Live-mouse images (left) were collected 6 h and 24 h after I.V. injection of DiR dye labeled IGNVs. Skin, colon and tumor tissues were removed 24 h after the injection and scanned for DiR dye signals. A representative image from each group of mice is shown (left panels) and followed by graphical figures (right panels) presented as the mean net intensity (Sum Intensity/Area, n=5). **p<0.01 and ***p<0.001. Data are representative of at least five independent experiments.
Figure 3
Figure 3. Chemokine mediated pathways play a causative role in efficient targeted delivery of IGNVs to inflammatory sites
a, Chemokine expression in normal skin (Normal), LPS induced acute inflammatory skin tissues (Skin-LPS), CT26 (CT26 tumor) and 4T1 (4T1 tumor) were determined using the Proteome Profiler from R&D systems. Each dot represents a chemokine detected by a capture antibody and printed in duplicate on the membrane. b, Expression of chemokine receptors on IGNVs was analyzed by FACS analysis of IGNVs coated on 4 µm-diameter aldehyde/sulfate latex beads. A representative image (n=5) from each sample is shown c, In vitro transmigration of IGNVs. HUVEC cells (n=3) were cultured in the fibronectin coated-upper chamber as a transmigration barrier. PKH26 labeled IGNVs (PKH26-IGNVs) were pre-incubated with recombinant chemokines as listed in figure 1c or with the extract from 4T1 tumor. After washing, pre-incubated PKH26-IGNVs were added to the upper chamber, and cultured in the presence of recombinant chemokines (CXCL1/2/9/10 plus CCL2/5) in the lower chamber. After a 24 h incubation, the intensity of PKH26 fluorescence of media in the lower chamber (n=3) was measured and expressed as the % of transwell efficiency of PKH26+ IGNVs. d, Images of IGNVs in LPS-induced acute skin inflammatory mice. DiR dye labeled IGNVs were pre-incubated overnight at 4°C with (Neutralized) or without (Not neutralized) 4T1 extract before an I.V. injection. A representative image at 6 h and 24 h after the injection from each group of mice (n=5) is shown (left) and followed by graphical figures (right) presented as the mean net intensity (Sum Intensity/Area, n=5). Data are representative of at least three independent experiments. e, Immunohistochemical staining of chemokines (CCL2, CCL5, CXCL9 and CXCL10) expressed in human breast cancer, colon cancer tissues (bottom panels) and paired adjacent tissues (upper panels). A representative image (n=20 for colon cancer, n=21 for breast cancer) from each sample is shown. DiR dye labeled IGNVs were pre-incubated at 4°C overnight with recombinant chemokines as listed in the figures and then I.V. injected into LPS-induced acute skin inflammatory mice (f) or CT26 tumor-bearing mice (g). DiR dye signals in skin and tumor tissues were determined 24 h after the injection. h, Transmigration of IGNVs with/without LFA-1 neutralization. PKH26 labeled IGNVs were pre-incubated overnight with anti-LFA-1 antibody at 4°C and then added into the apical chamber. The intensity of PKH26 fluorescence of the media in the lower chamber was measured after 24 and 48 h of incubation and expressed as the % of transwell efficiency of PKH26+IGNVs. i, DiR dye labeled IGNVs were pre-incubated with functional anti-LFA-1 antibody at 4°C overnight, washed, I.V. injected into LPS-induced acute skin inflammatory mice and the DiR signals was detected after 24 h injection. A representative image (f, g, i) from each group of mice (n=5) 24 h after the injection is shown and graphical figures are presented as the mean net intensity (Sum Intensity/Area, n=5). *p<0.05, **p<0.01 and ***p<0.001. Data are the mean ± S.E.M. of at least three independent experiments.
Figure 4
Figure 4. Targeting to human colon cancer by coating GNVs with the plasma membrane of LPS stimulated leukocytes isolated from peripheral blood of healthy human subjects (hIGNVs) or of mice (mIGNVs)
Profiles of hIGNV (a) and mIGNV (b) chemokine receptors are shown based on FACS analysis. Representative histograms (n=5) show the percentage of staining of chemokine receptors from the hIGNVs and mIGNVs. Three different bands from sucrose gradients of plasma membrane from LPS stimulated leukocytes were used for coating GNVs: Top band (LPS-T), middle band (LPS-M), and bottom band (LPS-B). c, Trafficking of DiR dye labeled hIGNVs in human colon cancer SW620-bearing mice. Mice were I.V. injected with DiR dye labeled hIGNVs. Live imaging of whole mice was carried out on day 1 and 5 after the injection. At day 5 after the injection, tumors were removed and scanned. Trafficking of DiR dye labeled-mIGNVs in LPS-induced an acute skin inflammatory mouse model were measured. Mice were I.V. injected with DiR dye labeled mIGNVs without (d) or with (e) CXCR2 knockout. Skin was removed 72 h (d) or 24 h (e) after the injection and scanned. A representative image (c, d) from each group of mice is shown and graphical figures are presented as the mean net intensity (Sum Intensity/Area, n=5). *p<0.05, **p<0.01 and ***p<0.001. Data are the mean ± S.E.M. of at least three independent experiments (c,d, e).
Figure 5
Figure 5. Targeted therapeutic drug delivery for mouse cancer and colitis therapy
a, Stability of circulating IGNVs. Representative imagines (n=3) are shown. b, In vitro release profile of doxorubicin from IGNV-DOX in PBS buffer with different pH values (5.0, 5.5, 6.0, 6.5 and 7.2, n=5). **p<0.01. c, Biodistribution of doxorubicin in 4T1 tumor-bearing mice. 4T1 tumor-bearing mice (n=5) were I.V. injected with IGNV-DOX or DOX-NP™, and the doxorubicin in 4T1 tumor tissues, livers, lungs, spleens, kidneys, hearts and thymus were measured. *p<0.05. Data (b, c) are the mean ± S.E.M. of at least three independent experiments. d, Biodistribution of doxorubicin in CT26 and 4T1 tumor tissues. Free doxorubicin (Free DOX), GNVs delivered doxorubicin (GNV-DOX) and IGNVs delivered doxorubicin (IGNV-DOX) were I.V. injected into CT26 (n=5) and 4T1 tumor-bearing mice (n=5). Tumor tissues were removed, fixed and sectioned. Doxorubicin in tumor tissues was observed using a confocal imaging system. The images for one representative experiment of three are shown. e, CT26 and 4T1 cells were injected subcutaneously (CT26) or in a mammary fat pad (4T1) of BALB/c mice. Mice were I.V. injected with IGNV-DOX or controls as listed in the figure every 3 days for 30 days from 7 days after tumor cells were injected. Representative images of tumors (e, left panel) from each group (n=5) are shown, tumor volume was measured every 5 days, (e, right panel), and the survival rate (f) of mice was calculated. *p<0.05, and **p<0.01. Data are the mean ± S.E.M. of at least three independent experiments (e,f).

Similar articles

Cited by

References

    1. Kugelberg E. T cell responses: kiss and run. Nature reviews Immunology. 2014;14(3):134. - PubMed
    1. Pober JS, Sessa WC. Evolving functions of endothelial cells in inflammation. Nature reviews Immunology. 2007;7(10):803–815. - PubMed
    1. Schall TJ, Proudfoot AE. Overcoming hurdles in developing successful drugs targeting chemokine receptors. Nature reviews Immunology. 2011;11(5):355–363. - PubMed
    1. Mantovani A, Bonecchi R, Locati M. Tuning inflammation and immunity by chemokine sequestration: decoys and more. Nature reviews Immunology. 2006;6(12):907–918. - PubMed
    1. Ben-Baruch A. Organ selectivity in metastasis: regulation by chemokines and their receptors. Clinical & experimental metastasis. 2008;25(4):345–356. - PubMed

Publication types

MeSH terms